Deck 2: Simple Regression Analysis
Full screen (f)
Question
Dependent Variable: WHY
Method: Least Squares
Sample(adjusted): 19652006
Included observations: 30 atter adjusting endpoints
Use the Eviews output above to help with A) through I) below.
A) Interpret the coefficient on EX1.
B) Interpret R2 for this regression.
C) Replace the "?"'s with the appropriate values. An 80% confidence interval around the coefficient on EX1 is: 20.04112 +/- (?)(?)
D) Perform a positive sign test on the coefficient attached to EX2. Show the 5-step procedure.
E) IF you performed a test of significance on the constant term at the 87 percent critical level, would you reject the null hypothesis or not? Explain.
F) Perform a test to determine if the coefficient attached to EX2 is greater than 7.47. Show the 5-step procedure.
G) Based on the information in the table above (and ignoring Ramsey's Reset test which we will perform in a moment) do you think the regression above is under or over specified? Explain.
H)1.Perform Ramsey's Reset Test on the regression above using the Eviews printout below. Show the 5-step procedure.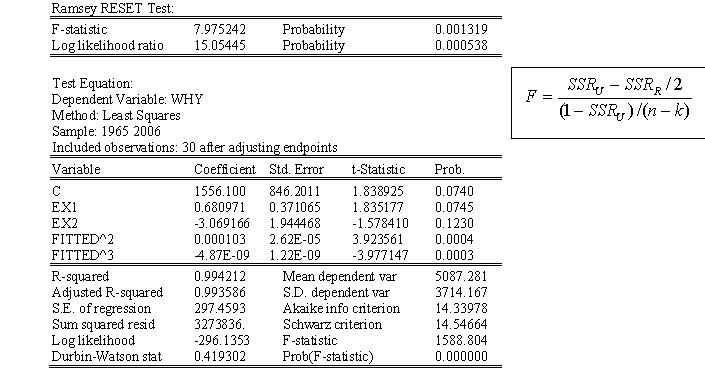
2. What is the difference between "FITTED^2" and "FITTED^3" in the Eviews printout above? Do the two terms appear in the restricted or unrestricted regression?
Question
Question
Question
Question
Question
Question
Question
Question
Question
Question
Question

Unlock Deck
Sign up to unlock the cards in this deck!
Unlock Deck
Unlock Deck
1/12
Play
Full screen (f)
Deck 2: Simple Regression Analysis
1
Dependent Variable: WHY
Method: Least Squares
Sample(adjusted): 19652006
Included observations: 30 atter adjusting endpoints
Use the Eviews output above to help with A) through I) below.
A) Interpret the coefficient on EX1.
B) Interpret R2 for this regression.
C) Replace the "?"'s with the appropriate values. An 80% confidence interval around the coefficient on EX1 is: 20.04112 +/- (?)(?)
D) Perform a positive sign test on the coefficient attached to EX2. Show the 5-step procedure.
E) IF you performed a test of significance on the constant term at the 87 percent critical level, would you reject the null hypothesis or not? Explain.
F) Perform a test to determine if the coefficient attached to EX2 is greater than 7.47. Show the 5-step procedure.
G) Based on the information in the table above (and ignoring Ramsey's Reset test which we will perform in a moment) do you think the regression above is under or over specified? Explain.
H)1.Perform Ramsey's Reset Test on the regression above using the Eviews printout below. Show the 5-step procedure.
2. What is the difference between "FITTED^2" and "FITTED^3" in the Eviews printout above? Do the two terms appear in the restricted or unrestricted regression?
Method: Least Squares
Sample(adjusted): 19652006
Included observations: 30 atter adjusting endpoints
Use the Eviews output above to help with A) through I) below.
A) Interpret the coefficient on EX1.
B) Interpret R2 for this regression.
C) Replace the "?"'s with the appropriate values. An 80% confidence interval around the coefficient on EX1 is: 20.04112 +/- (?)(?)
D) Perform a positive sign test on the coefficient attached to EX2. Show the 5-step procedure.
E) IF you performed a test of significance on the constant term at the 87 percent critical level, would you reject the null hypothesis or not? Explain.
F) Perform a test to determine if the coefficient attached to EX2 is greater than 7.47. Show the 5-step procedure.
G) Based on the information in the table above (and ignoring Ramsey's Reset test which we will perform in a moment) do you think the regression above is under or over specified? Explain.
H)1.Perform Ramsey's Reset Test on the regression above using the Eviews printout below. Show the 5-step procedure.
2. What is the difference between "FITTED^2" and "FITTED^3" in the Eviews printout above? Do the two terms appear in the restricted or unrestricted regression?
A) If EX1 increases 1 unit, then WHY is expected to increase 20.04 units holding EX2 constant.
B) 99% of the variation in WHY is explained by EX1 and EX2.
C) 12.57 and 1.314
D) 1) Ho: = 0 Ha: > 0 (minus 2 for messing up step 1)
2) 5%
3) If t-ratio > tc, then reject Ho
4) 66.84 > 1.703 (d.f. = n- k = 30 - 3 =27)
5) Reject Ho is not significantly positive
E) Not reject because the P-value > .87
F) 1. Ho: Ha:
3. If t-ratio , then reject
4. (d.f. )
5. Do not reject Ho; is not statistically greater than 7.47 . G) All we have to go on is significance and EX1 is insignificant at the 5% critical level. So the equation may be over specified.
H) 1)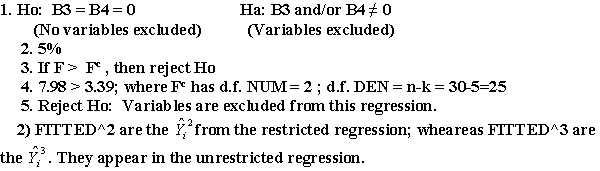
2
A) Criticize stepwise regression
B) What criteria are important for determining if a particular explanatory variable belongs in a regression. (4pts.)
B) What criteria are important for determining if a particular explanatory variable belongs in a regression. (4pts.)
A) It ignores theory.
Perhaps the pool stinks.
Includes or excludes variables based on biased statistics.
Ignores Ramsey's reset test, Akaike, Schwarz, Hannan-Quinn
B) Theory, significance, measures of goodness-of-fit, altered estimators, Ramsey's reset test.
Perhaps the pool stinks.
Includes or excludes variables based on biased statistics.
Ignores Ramsey's reset test, Akaike, Schwarz, Hannan-Quinn
B) Theory, significance, measures of goodness-of-fit, altered estimators, Ramsey's reset test.
3
If a regression is underspecified, then the estimators will not average out to equal the
true values of the structural parameters in repeated sampling.
true values of the structural parameters in repeated sampling.
True
4
If a regression is over specified then the estimators should change markedly once the extraneous variables are removed.
Unlock Deck
Unlock for access to all 12 flashcards in this deck.
Unlock Deck
k this deck
5
The constant term is biased in a regression missing an important explanatory variable.
Unlock Deck
Unlock for access to all 12 flashcards in this deck.
Unlock Deck
k this deck
6
A 95% confidence interval for a given coefficient can never be larger than a 90% confidence interval.
Unlock Deck
Unlock for access to all 12 flashcards in this deck.
Unlock Deck
k this deck
7
The standard error of the regression (SER) is monotonically decreasing with respect to the number of explanatory variables.
Unlock Deck
Unlock for access to all 12 flashcards in this deck.
Unlock Deck
k this deck
8
Raising the critical level of a test from 5% to 10% decreases the probability that the test will result in a TYPE II error.
Unlock Deck
Unlock for access to all 12 flashcards in this deck.
Unlock Deck
k this deck
9
The Schwarz Criterion is monotonically decreasing with respect to the number of explanatory variables.
Unlock Deck
Unlock for access to all 12 flashcards in this deck.
Unlock Deck
k this deck
10
If the prob-value is less than .05, then the hypothesis test will reject Ho at the 5% critical level.
Unlock Deck
Unlock for access to all 12 flashcards in this deck.
Unlock Deck
k this deck
11
You can conduct a positive sign test on a negative coefficient, but the results will be the same every time: Do not reject Ho.
Unlock Deck
Unlock for access to all 12 flashcards in this deck.
Unlock Deck
k this deck
12
If a test of significance results in "Do not reject Ho", then there is absolutely no chance that a TYPE II error has been committed
Unlock Deck
Unlock for access to all 12 flashcards in this deck.
Unlock Deck
k this deck
Unlock Deck
Unlock for access to all 12 flashcards in this deck.


