Deck 21: Income Inequality and the Redistribution of Income
Full screen (f)
Question
Question
Table 21.1: 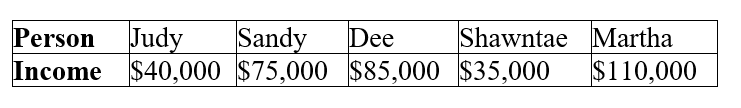 The above table lists the incomes for the 5 people who live on the remote island nation of Richlandia.
-Refer to Table 21.1. What is the median income on Richlandia?
A) $40,000
B) $69,000
C) $75,000
D) $85,000
The above table lists the incomes for the 5 people who live on the remote island nation of Richlandia.-Refer to Table 21.1. What is the median income on Richlandia?
A) $40,000
B) $69,000
C) $75,000
D) $85,000
Question
Table 21.1: The above table lists the incomes for the 5 people who live on the remote island nation of Richlandia.
-Refer to Table 21.1. What is the mean income on Richlandia?
A) $40,000
B) $69,000
C) $75,000
D) $85,000
The above table lists the incomes for the 5 people who live on the remote island nation of Richlandia.-Refer to Table 21.1. What is the mean income on Richlandia?
A) $40,000
B) $69,000
C) $75,000
D) $85,000
Question
Table 21.1: The above table lists the incomes for the 5 people who live on the remote island nation of Richlandia.
-Refer to Table 21.1. If Martha's income doubled to $220,000 while the incomes of the other four residents did not change, what would happen to the original median income on Richlandia?
A) It would increase by $22,000.
B) It would increase by $44,000.
C) It would double.
D) It would not change.
The above table lists the incomes for the 5 people who live on the remote island nation of Richlandia.-Refer to Table 21.1. If Martha's income doubled to $220,000 while the incomes of the other four residents did not change, what would happen to the original median income on Richlandia?
A) It would increase by $22,000.
B) It would increase by $44,000.
C) It would double.
D) It would not change.
Question
Table 21.1: The above table lists the incomes for the 5 people who live on the remote island nation of Richlandia.
-Refer to Table 21.1. If Martha's income doubled to $220,000 while the incomes of the other four residents did not change, what would happen to the original mean income on Richlandia?
A) It would increase by $22,000.
B) It would increase by $44,000.
C) It would double.
D) It would not change.
The above table lists the incomes for the 5 people who live on the remote island nation of Richlandia.-Refer to Table 21.1. If Martha's income doubled to $220,000 while the incomes of the other four residents did not change, what would happen to the original mean income on Richlandia?
A) It would increase by $22,000.
B) It would increase by $44,000.
C) It would double.
D) It would not change.
Question
Question
Table 21.2 : 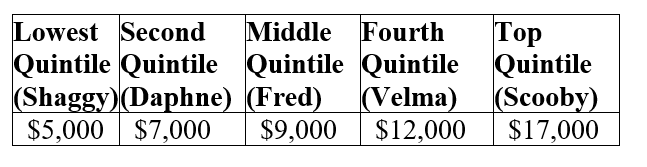 The above table lists the incomes for the 5 people who live in the small country of Mysteria.
-Refer to Table 21.2. What is the median income in Mysteria?
A) $5,000
B) $9,000
C) $10,000
D) $17,000
The above table lists the incomes for the 5 people who live in the small country of Mysteria.-Refer to Table 21.2. What is the median income in Mysteria?
A) $5,000
B) $9,000
C) $10,000
D) $17,000
Question
Table 21.2 : The above table lists the incomes for the 5 people who live in the small country of Mysteria.
-Refer to Table 21.2. The bottom 20 percent of earners took home ________ of all income earned in Mysteria.
A) 5%
B) 8.33%
C) 10%
D) 29.4%
The above table lists the incomes for the 5 people who live in the small country of Mysteria.-Refer to Table 21.2. The bottom 20 percent of earners took home ________ of all income earned in Mysteria.
A) 5%
B) 8.33%
C) 10%
D) 29.4%
Question
Table 21.2 : The above table lists the incomes for the 5 people who live in the small country of Mysteria.
-Refer to Table 21.2. The middle 20 percent of earners took home ________ of all income earned in Mysteria.
A) 9%
B) 18%
C) 42.9%
D) 52.9%
The above table lists the incomes for the 5 people who live in the small country of Mysteria.-Refer to Table 21.2. The middle 20 percent of earners took home ________ of all income earned in Mysteria.
A) 9%
B) 18%
C) 42.9%
D) 52.9%
Question
Table 21.2 : The above table lists the incomes for the 5 people who live in the small country of Mysteria.
-Refer to Table 21.2. The top 20 percent of earners took home ________ of all income earned in Mysteria.
A) 17%
B) 22%
C) 34%
D) 51.5%
The above table lists the incomes for the 5 people who live in the small country of Mysteria.-Refer to Table 21.2. The top 20 percent of earners took home ________ of all income earned in Mysteria.
A) 17%
B) 22%
C) 34%
D) 51.5%
Question
Figure 21.1 : 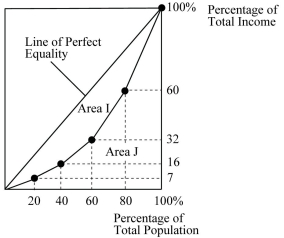 The above figure shows the Lorenz curve for a hypothetical country.
-Refer to Figure 21.1. The middle 20% of the population earn ________ of total income.
A) 16%
B) 23%
C) 28%
D) 32%
The above figure shows the Lorenz curve for a hypothetical country.-Refer to Figure 21.1. The middle 20% of the population earn ________ of total income.
A) 16%
B) 23%
C) 28%
D) 32%
Question
Figure 21.1 : The above figure shows the Lorenz curve for a hypothetical country.
-Refer to Figure 21.1. The highest 20% of the population earn ________ of total income.
A) 40%
B) 44%
C) 60%
D) 80%
The above figure shows the Lorenz curve for a hypothetical country.-Refer to Figure 21.1. The highest 20% of the population earn ________ of total income.
A) 40%
B) 44%
C) 60%
D) 80%
Question
Figure 21.1 : The above figure shows the Lorenz curve for a hypothetical country.
-Refer to Figure 21.1. If Area I = 1,700 and Area J = 3,300, what is the Gini coefficient?
A) 0.17
B) 0.34
C) 0.52
D) 2.94
The above figure shows the Lorenz curve for a hypothetical country.-Refer to Figure 21.1. If Area I = 1,700 and Area J = 3,300, what is the Gini coefficient?
A) 0.17
B) 0.34
C) 0.52
D) 2.94
Question
Figure 21.2 : 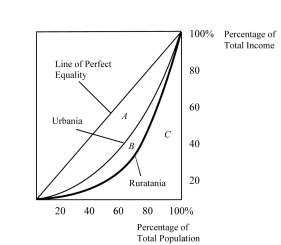 The above figure shows the Lorenz curves for Urbania and Ruratania.
-Refer to Figure 21.2. Which country has the more unequal distribution of income?
A) Urbania
B) Ruratania
C) They may have the same absolute income distribution although their relative income distribution is different.
D) There is insufficient information to answer the question.
The above figure shows the Lorenz curves for Urbania and Ruratania.-Refer to Figure 21.2. Which country has the more unequal distribution of income?
A) Urbania
B) Ruratania
C) They may have the same absolute income distribution although their relative income distribution is different.
D) There is insufficient information to answer the question.
Question
Figure 21.2 : The above figure shows the Lorenz curves for Urbania and Ruratania.
-Refer to Figure 21.2. If area A = 2,000, area B = 400, and area C = 2,600, what is the Gini coefficient for Urbania (rounded to two decimal places)?
A) 0.40
B) 0.43
C) 0.67
D) 0.77
The above figure shows the Lorenz curves for Urbania and Ruratania.-Refer to Figure 21.2. If area A = 2,000, area B = 400, and area C = 2,600, what is the Gini coefficient for Urbania (rounded to two decimal places)?
A) 0.40
B) 0.43
C) 0.67
D) 0.77
Question
Figure 21.2 : The above figure shows the Lorenz curves for Urbania and Ruratania.
-Refer to Figure 21.2. If area A = 2,000, area B = 400, and area C = 2,600, what is the Gini coefficient for Ruratania (rounded to two decimal places)?
A) 0.08
B) 0.15
C) 0.48
D) 0.92
The above figure shows the Lorenz curves for Urbania and Ruratania.-Refer to Figure 21.2. If area A = 2,000, area B = 400, and area C = 2,600, what is the Gini coefficient for Ruratania (rounded to two decimal places)?
A) 0.08
B) 0.15
C) 0.48
D) 0.92
Question
Question
Question
Question
Question
Question
Question
Table 21.3 : 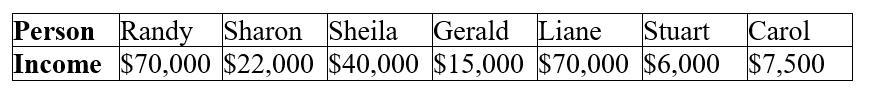 The above table lists the incomes for the 7 people who live in the tiny nation of Marklar.
-Refer to Table 21.3. What are the median income and the mean income for Marklar. Are they the same?
The above table lists the incomes for the 7 people who live in the tiny nation of Marklar.-Refer to Table 21.3. What are the median income and the mean income for Marklar. Are they the same?
Question
Question
Question
Question
Question
Question
Question
Question
Question
Question
Question
Question
Question
Question
Question
Question
Question
Question
Question
Question
Question
Question
Question
Question
Question
Question
Question
Question
Question
Question
Question
Question
Question
Question
Question
Question
Question
Question
Question
Question
Question
Question
Question
Question
Question
Question

Unlock Deck
Sign up to unlock the cards in this deck!
Unlock Deck
Unlock Deck
1/69
Play
Full screen (f)
Deck 21: Income Inequality and the Redistribution of Income
1
The income of the middle person in an income distribution is called the
A) mean income.
B) average income.
C) median income.
D) per capita income.
A) mean income.
B) average income.
C) median income.
D) per capita income.
median income.
2
Table 21.1: The above table lists the incomes for the 5 people who live on the remote island nation of Richlandia.
-Refer to Table 21.1. What is the median income on Richlandia?
A) $40,000
B) $69,000
C) $75,000
D) $85,000
The above table lists the incomes for the 5 people who live on the remote island nation of Richlandia.-Refer to Table 21.1. What is the median income on Richlandia?
A) $40,000
B) $69,000
C) $75,000
D) $85,000
$75,000
3
Table 21.1: The above table lists the incomes for the 5 people who live on the remote island nation of Richlandia.
-Refer to Table 21.1. What is the mean income on Richlandia?
A) $40,000
B) $69,000
C) $75,000
D) $85,000
The above table lists the incomes for the 5 people who live on the remote island nation of Richlandia.-Refer to Table 21.1. What is the mean income on Richlandia?
A) $40,000
B) $69,000
C) $75,000
D) $85,000
$69,000
4
Table 21.1: The above table lists the incomes for the 5 people who live on the remote island nation of Richlandia.
-Refer to Table 21.1. If Martha's income doubled to $220,000 while the incomes of the other four residents did not change, what would happen to the original median income on Richlandia?
A) It would increase by $22,000.
B) It would increase by $44,000.
C) It would double.
D) It would not change.
The above table lists the incomes for the 5 people who live on the remote island nation of Richlandia.-Refer to Table 21.1. If Martha's income doubled to $220,000 while the incomes of the other four residents did not change, what would happen to the original median income on Richlandia?
A) It would increase by $22,000.
B) It would increase by $44,000.
C) It would double.
D) It would not change.
Unlock Deck
Unlock for access to all 69 flashcards in this deck.
Unlock Deck
k this deck
5
Table 21.1: The above table lists the incomes for the 5 people who live on the remote island nation of Richlandia.
-Refer to Table 21.1. If Martha's income doubled to $220,000 while the incomes of the other four residents did not change, what would happen to the original mean income on Richlandia?
A) It would increase by $22,000.
B) It would increase by $44,000.
C) It would double.
D) It would not change.
The above table lists the incomes for the 5 people who live on the remote island nation of Richlandia.-Refer to Table 21.1. If Martha's income doubled to $220,000 while the incomes of the other four residents did not change, what would happen to the original mean income on Richlandia?
A) It would increase by $22,000.
B) It would increase by $44,000.
C) It would double.
D) It would not change.
Unlock Deck
Unlock for access to all 69 flashcards in this deck.
Unlock Deck
k this deck
6
A quintile is a group that contains
A) exactly 5 people.
B) exactly one-fifth of the population.
C) five identical siblings.
D) five musicians or singers.
A) exactly 5 people.
B) exactly one-fifth of the population.
C) five identical siblings.
D) five musicians or singers.
Unlock Deck
Unlock for access to all 69 flashcards in this deck.
Unlock Deck
k this deck
7
Table 21.2 : The above table lists the incomes for the 5 people who live in the small country of Mysteria.
-Refer to Table 21.2. What is the median income in Mysteria?
A) $5,000
B) $9,000
C) $10,000
D) $17,000
The above table lists the incomes for the 5 people who live in the small country of Mysteria.-Refer to Table 21.2. What is the median income in Mysteria?
A) $5,000
B) $9,000
C) $10,000
D) $17,000
Unlock Deck
Unlock for access to all 69 flashcards in this deck.
Unlock Deck
k this deck
8
Table 21.2 : The above table lists the incomes for the 5 people who live in the small country of Mysteria.
-Refer to Table 21.2. The bottom 20 percent of earners took home ________ of all income earned in Mysteria.
A) 5%
B) 8.33%
C) 10%
D) 29.4%
The above table lists the incomes for the 5 people who live in the small country of Mysteria.-Refer to Table 21.2. The bottom 20 percent of earners took home ________ of all income earned in Mysteria.
A) 5%
B) 8.33%
C) 10%
D) 29.4%
Unlock Deck
Unlock for access to all 69 flashcards in this deck.
Unlock Deck
k this deck
9
Table 21.2 : The above table lists the incomes for the 5 people who live in the small country of Mysteria.
-Refer to Table 21.2. The middle 20 percent of earners took home ________ of all income earned in Mysteria.
A) 9%
B) 18%
C) 42.9%
D) 52.9%
The above table lists the incomes for the 5 people who live in the small country of Mysteria.-Refer to Table 21.2. The middle 20 percent of earners took home ________ of all income earned in Mysteria.
A) 9%
B) 18%
C) 42.9%
D) 52.9%
Unlock Deck
Unlock for access to all 69 flashcards in this deck.
Unlock Deck
k this deck
10
Table 21.2 : The above table lists the incomes for the 5 people who live in the small country of Mysteria.
-Refer to Table 21.2. The top 20 percent of earners took home ________ of all income earned in Mysteria.
A) 17%
B) 22%
C) 34%
D) 51.5%
The above table lists the incomes for the 5 people who live in the small country of Mysteria.-Refer to Table 21.2. The top 20 percent of earners took home ________ of all income earned in Mysteria.
A) 17%
B) 22%
C) 34%
D) 51.5%
Unlock Deck
Unlock for access to all 69 flashcards in this deck.
Unlock Deck
k this deck
11
Figure 21.1 : The above figure shows the Lorenz curve for a hypothetical country.
-Refer to Figure 21.1. The middle 20% of the population earn ________ of total income.
A) 16%
B) 23%
C) 28%
D) 32%
The above figure shows the Lorenz curve for a hypothetical country.-Refer to Figure 21.1. The middle 20% of the population earn ________ of total income.
A) 16%
B) 23%
C) 28%
D) 32%
Unlock Deck
Unlock for access to all 69 flashcards in this deck.
Unlock Deck
k this deck
12
Figure 21.1 : The above figure shows the Lorenz curve for a hypothetical country.
-Refer to Figure 21.1. The highest 20% of the population earn ________ of total income.
A) 40%
B) 44%
C) 60%
D) 80%
The above figure shows the Lorenz curve for a hypothetical country.-Refer to Figure 21.1. The highest 20% of the population earn ________ of total income.
A) 40%
B) 44%
C) 60%
D) 80%
Unlock Deck
Unlock for access to all 69 flashcards in this deck.
Unlock Deck
k this deck
13
Figure 21.1 : The above figure shows the Lorenz curve for a hypothetical country.
-Refer to Figure 21.1. If Area I = 1,700 and Area J = 3,300, what is the Gini coefficient?
A) 0.17
B) 0.34
C) 0.52
D) 2.94
The above figure shows the Lorenz curve for a hypothetical country.-Refer to Figure 21.1. If Area I = 1,700 and Area J = 3,300, what is the Gini coefficient?
A) 0.17
B) 0.34
C) 0.52
D) 2.94
Unlock Deck
Unlock for access to all 69 flashcards in this deck.
Unlock Deck
k this deck
14
Figure 21.2 : The above figure shows the Lorenz curves for Urbania and Ruratania.
-Refer to Figure 21.2. Which country has the more unequal distribution of income?
A) Urbania
B) Ruratania
C) They may have the same absolute income distribution although their relative income distribution is different.
D) There is insufficient information to answer the question.
The above figure shows the Lorenz curves for Urbania and Ruratania.-Refer to Figure 21.2. Which country has the more unequal distribution of income?
A) Urbania
B) Ruratania
C) They may have the same absolute income distribution although their relative income distribution is different.
D) There is insufficient information to answer the question.
Unlock Deck
Unlock for access to all 69 flashcards in this deck.
Unlock Deck
k this deck
15
Figure 21.2 : The above figure shows the Lorenz curves for Urbania and Ruratania.
-Refer to Figure 21.2. If area A = 2,000, area B = 400, and area C = 2,600, what is the Gini coefficient for Urbania (rounded to two decimal places)?
A) 0.40
B) 0.43
C) 0.67
D) 0.77
The above figure shows the Lorenz curves for Urbania and Ruratania.-Refer to Figure 21.2. If area A = 2,000, area B = 400, and area C = 2,600, what is the Gini coefficient for Urbania (rounded to two decimal places)?
A) 0.40
B) 0.43
C) 0.67
D) 0.77
Unlock Deck
Unlock for access to all 69 flashcards in this deck.
Unlock Deck
k this deck
16
Figure 21.2 : The above figure shows the Lorenz curves for Urbania and Ruratania.
-Refer to Figure 21.2. If area A = 2,000, area B = 400, and area C = 2,600, what is the Gini coefficient for Ruratania (rounded to two decimal places)?
A) 0.08
B) 0.15
C) 0.48
D) 0.92
The above figure shows the Lorenz curves for Urbania and Ruratania.-Refer to Figure 21.2. If area A = 2,000, area B = 400, and area C = 2,600, what is the Gini coefficient for Ruratania (rounded to two decimal places)?
A) 0.08
B) 0.15
C) 0.48
D) 0.92
Unlock Deck
Unlock for access to all 69 flashcards in this deck.
Unlock Deck
k this deck
17
In describing the progress of the typical person in an economy, measuring the median income always does a better job than measuring the mean income.
Unlock Deck
Unlock for access to all 69 flashcards in this deck.
Unlock Deck
k this deck
18
If income distribution in an economy is perfectly equal, the lowest quintile will earn 20% of total income.
Unlock Deck
Unlock for access to all 69 flashcards in this deck.
Unlock Deck
k this deck
19
The more top-heavy income distribution is, the closer the Lorenz curve will be to the line of perfect equality.
Unlock Deck
Unlock for access to all 69 flashcards in this deck.
Unlock Deck
k this deck
20
A Gini coefficient is a number that measures a society's income inequality.
Unlock Deck
Unlock for access to all 69 flashcards in this deck.
Unlock Deck
k this deck
21
The more equal the income distribution in a society, the smaller the Gini coefficient.
Unlock Deck
Unlock for access to all 69 flashcards in this deck.
Unlock Deck
k this deck
22
The share of income received by different groups is called ________.
Unlock Deck
Unlock for access to all 69 flashcards in this deck.
Unlock Deck
k this deck
23
Table 21.3 : The above table lists the incomes for the 7 people who live in the tiny nation of Marklar.
-Refer to Table 21.3. What are the median income and the mean income for Marklar. Are they the same?
The above table lists the incomes for the 7 people who live in the tiny nation of Marklar.-Refer to Table 21.3. What are the median income and the mean income for Marklar. Are they the same?
Unlock Deck
Unlock for access to all 69 flashcards in this deck.
Unlock Deck
k this deck
24
In 2012, the top one-fifth of U.S. households earned ________ of the nations total income.
A) about 22%
B) just under 35%
C) just over half
D) almost 90%
A) about 22%
B) just under 35%
C) just over half
D) almost 90%
Unlock Deck
Unlock for access to all 69 flashcards in this deck.
Unlock Deck
k this deck
25
In 2012, the bottom one-fifth of U.S. households earned ________ of the nations total income.
A) just over 3%
B) just under 9%
C) approximately 25%
D) just under 50%
A) just over 3%
B) just under 9%
C) approximately 25%
D) just under 50%
Unlock Deck
Unlock for access to all 69 flashcards in this deck.
Unlock Deck
k this deck
26
When we compare shares of income earned by U.S. households over the past 40 years, which of the following statements about the distribution of income is true?
A) The percentage of total income represented by each quintile has increased.
B) The percentage of total income represented by each quintile has decreased.
C) The largest gain in income percentage is in the top 5% of households.
D) Lower-income households gained at the expense of higher-income households.
Unlock Deck
Unlock for access to all 69 flashcards in this deck.
Unlock Deck
k this deck
27
From 1970 to 2012, the Gini coefficient in the United States has
A) steadily increased.
B) remained relatively unchanged.
C) dramatically decreased.
D) more than doubled.
A) steadily increased.
B) remained relatively unchanged.
C) dramatically decreased.
D) more than doubled.
Unlock Deck
Unlock for access to all 69 flashcards in this deck.
Unlock Deck
k this deck
28
Among developed countries, the United States has
A) one of the lower Gini coefficients.
B) one of the higher Gini coefficients.
C) the most unequal distribution of income.
D) an income distribution right about at the median of those countries.
A) one of the lower Gini coefficients.
B) one of the higher Gini coefficients.
C) the most unequal distribution of income.
D) an income distribution right about at the median of those countries.
Unlock Deck
Unlock for access to all 69 flashcards in this deck.
Unlock Deck
k this deck
29
In the United States, the Gini coefficient for the entire nation
A) is considerably higher than the coefficients for each of the 50 states.
B) is considerably lower than the coefficients for each of the 50 states.
C) is in roughly the same range as the Gini Coefficients for each of the 50 states.
D) must be exactly equal to the coefficients for each of the 50 states.
Unlock Deck
Unlock for access to all 69 flashcards in this deck.
Unlock Deck
k this deck
30
Generally speaking, income inequality is
A) higher in Europe than in the United States.
B) higher in the United States than in most of the developing world.
C) extremely high and does not vary much between nations in the developing world.
D) higher in the developing world than in the developed world.
A) higher in Europe than in the United States.
B) higher in the United States than in most of the developing world.
C) extremely high and does not vary much between nations in the developing world.
D) higher in the developing world than in the developed world.
Unlock Deck
Unlock for access to all 69 flashcards in this deck.
Unlock Deck
k this deck
31
From 1993 to 2012, average real income for the bottom quintile of U.S. households
A) decreased by more than 10%.
B) remained virtually unchanged.
C) increased by about 5%.
D) almost doubled.
A) decreased by more than 10%.
B) remained virtually unchanged.
C) increased by about 5%.
D) almost doubled.
Unlock Deck
Unlock for access to all 69 flashcards in this deck.
Unlock Deck
k this deck
32
From 1970 to 2006, average real income for the top 5% of U.S. households
A) decreased by more than 10%.
B) remained virtually unchanged.
C) increased by about 5%.
D) almost doubled.
A) decreased by more than 10%.
B) remained virtually unchanged.
C) increased by about 5%.
D) almost doubled.
Unlock Deck
Unlock for access to all 69 flashcards in this deck.
Unlock Deck
k this deck
33
From 1970 to 2006, the largest percentage increase in average real income for households in the United States occurred in which quintile?
A) the bottom quintile
B) the second quintile
C) the middle quintile
D) the top quintile
A) the bottom quintile
B) the second quintile
C) the middle quintile
D) the top quintile
Unlock Deck
Unlock for access to all 69 flashcards in this deck.
Unlock Deck
k this deck
34
From 1970 to 2006, data representing average real income for U.S. households indicates that the rich have ________ and the poor have ________.
A) gotten richer; gotten poorer
B) gotten richer; also gotten richer
C) gotten richer; gotten neither richer nor poorer
D) gotten poorer; also gotten poorer
A) gotten richer; gotten poorer
B) gotten richer; also gotten richer
C) gotten richer; gotten neither richer nor poorer
D) gotten poorer; also gotten poorer
Unlock Deck
Unlock for access to all 69 flashcards in this deck.
Unlock Deck
k this deck
35
Income distribution in the United States over the past 40 years has become more equal.
Unlock Deck
Unlock for access to all 69 flashcards in this deck.
Unlock Deck
k this deck
36
The most unequal distribution of income in the United States is in Washington, D.C.
Unlock Deck
Unlock for access to all 69 flashcards in this deck.
Unlock Deck
k this deck
37
The technology boom that began in the 1990s has helped increase the average real incomes of households in all five U.S. quintiles.
Unlock Deck
Unlock for access to all 69 flashcards in this deck.
Unlock Deck
k this deck
38
________ is the ability to move to a different part of the income distribution.
Unlock Deck
Unlock for access to all 69 flashcards in this deck.
Unlock Deck
k this deck
39
The study of economic mobility discussed in the text pinpoints five factors that are correlated with economic mobility. What are those five factors and how do they affect economic mobility?
Unlock Deck
Unlock for access to all 69 flashcards in this deck.
Unlock Deck
k this deck
40
Income inequality in the United States has increased in part due to differences in productivity. A more productive worker is likely to be paid ________ than a less productive worker doing the same job, and the worker who adds more value to the product being produced is likely to be paid ________ than the worker who does not add as much value to production.
A) more; more
B) more; less
C) less; more
D) less; less
A) more; more
B) more; less
C) less; more
D) less; less
Unlock Deck
Unlock for access to all 69 flashcards in this deck.
Unlock Deck
k this deck
41
Two factors that have contributed to an increase in income inequality are
A) outsourcing of jobs and tax increases.
B) economic growth and low inflation.
C) technological change and globalization.
D) low interest rates and a strong U.S. dollar.
A) outsourcing of jobs and tax increases.
B) economic growth and low inflation.
C) technological change and globalization.
D) low interest rates and a strong U.S. dollar.
Unlock Deck
Unlock for access to all 69 flashcards in this deck.
Unlock Deck
k this deck
42
Income inequality in the United States has increased in part due to technological change. How does technological change contribute to income inequality?
A) It reduces the cost of producing goods and therefore lowers the value of labor services.
B) It is responsible for a majority of new products on the market, and these products are only affordable to higher-income households.
C) It allows manufacturers to produce products with less labor, and this reduction in the demand for labor lowers wages at all skill levels.
D) It has created many higher-income jobs for skilled and trained workers, leaving the income of less-skilled workers relatively unchanged by comparison.
Unlock Deck
Unlock for access to all 69 flashcards in this deck.
Unlock Deck
k this deck
43
Technology has played a key role in changing the structure of the economy, which has increased the rewards for additional education and training. Greater access to education and training programs for all workers should therefore
A) play an important role in reducing income inequality.
B) have a net effect of increasing income inequality.
C) eliminate all income inequality.
D) have little effect on the overall state of income inequality.
A) play an important role in reducing income inequality.
B) have a net effect of increasing income inequality.
C) eliminate all income inequality.
D) have little effect on the overall state of income inequality.
Unlock Deck
Unlock for access to all 69 flashcards in this deck.
Unlock Deck
k this deck
44
Income inequality in the United States has increased in part due to globalization. How does globalization contribute to income inequality?
A) It reduces the cost of producing goods and therefore lowers the value of labor services.
B) It allows domestic firms to hire low-skilled workers anywhere in the world, putting U.S. workers in competition with foreign workers. This has caused the wages of low-skilled workers to fall relative to the wages of other workers.
C) It increases the demand for a wide variety of products which in turn increases prices beyond the reach of average-income households.
D) It allows producers to exploit workers and reduce the wages they are willing to pay those workers.
Unlock Deck
Unlock for access to all 69 flashcards in this deck.
Unlock Deck
k this deck
45
Globalization and growing technology have produced
A) more opportunities for low-skilled labor than for high-skilled labor.
B) equal opportunities for low-skilled and high-skilled labor.
C) outsized, exponential rewards for superstar talent.
D) rewards for labor that have reduced income inequality.
A) more opportunities for low-skilled labor than for high-skilled labor.
B) equal opportunities for low-skilled and high-skilled labor.
C) outsized, exponential rewards for superstar talent.
D) rewards for labor that have reduced income inequality.
Unlock Deck
Unlock for access to all 69 flashcards in this deck.
Unlock Deck
k this deck
46
Rachel, a large pineapple producer in Hawaii, lobbies Congress to limit imports of pineapples in order to be able to sell her pineapples at a higher price and greatly increase her income. This possible source of income inequality is due to
A) globalization.
B) technology changes.
C) productivity differences.
D) rent seeking.
A) globalization.
B) technology changes.
C) productivity differences.
D) rent seeking.
Unlock Deck
Unlock for access to all 69 flashcards in this deck.
Unlock Deck
k this deck
47
If growing income inequality results from changes in technology that, as a whole, make society better off, this will
A) increase the size of the economic pie.
B) decrease the size of the economic pie because of the income inequality.
C) not change the size of the economic pie because the positive technology changes will be offset by the increases in income inequality.
D) result in complete income inequality as technology continues to change in the future.
Unlock Deck
Unlock for access to all 69 flashcards in this deck.
Unlock Deck
k this deck
48
If growing income inequality results from or encourages more rent seeking that, as a whole, make society worse off, this will
A) increase the size of the economic pie despite the income inequality.
B) decrease the size of the economic pie.
C) not change the size of the economic pie because the rent-seeking behavior will benefit enough parties to completely offset the effects of the increases in income inequality.
D) result in complete income inequality as rent seeking continues to occur in the future.
Unlock Deck
Unlock for access to all 69 flashcards in this deck.
Unlock Deck
k this deck
49
Using a Website created by the Sacramento Bee in 2008 that published the salaries of all California state employees, economists conducted research and found that
A) job satisfaction depends only on a person's salary.
B) employees with above-median earnings were, surprisingly, the least satisfied with their jobs.
C) knowing their co-workers' salaries affected employees' job satisfaction.
D) no employees seemed to be unsatisfied with their jobs or the salaries they were earning.
Unlock Deck
Unlock for access to all 69 flashcards in this deck.
Unlock Deck
k this deck
50
Growing technology has provided increased opportunities for higher-skilled workers.
Unlock Deck
Unlock for access to all 69 flashcards in this deck.
Unlock Deck
k this deck
51
Differences in productivity can actually benefit society even when this results in increases in income inequality.
Unlock Deck
Unlock for access to all 69 flashcards in this deck.
Unlock Deck
k this deck
52
List five major sources of income inequality.
Unlock Deck
Unlock for access to all 69 flashcards in this deck.
Unlock Deck
k this deck
53
Explain how globalization has benefitted consumers but has also widened the gap between rich and poor in the United States.
Unlock Deck
Unlock for access to all 69 flashcards in this deck.
Unlock Deck
k this deck
54
Philosophical arguments in favor of income redistribution programs include
A) utilitarianism.
B) the Rawlsian social contract.
C) the benefits-received principle.
D) all of the above
A) utilitarianism.
B) the Rawlsian social contract.
C) the benefits-received principle.
D) all of the above
Unlock Deck
Unlock for access to all 69 flashcards in this deck.
Unlock Deck
k this deck
55
The belief that having more of something makes you happier but in successively smaller increments is called
A) utilitarianism.
B) diminishing marginal utility.
C) the benefits-received principle.
D) transcendentalism.
A) utilitarianism.
B) diminishing marginal utility.
C) the benefits-received principle.
D) transcendentalism.
Unlock Deck
Unlock for access to all 69 flashcards in this deck.
Unlock Deck
k this deck
56
The first Taco Bell 7-layer burrito you ate was extraordinary. The second one was good. The third one was pretty good. The fourth one was just kind of okay. This illustrates
A) utilitarianism.
B) diminishing marginal utility.
C) the benefits-received principle.
D) transcendentalism.
A) utilitarianism.
B) diminishing marginal utility.
C) the benefits-received principle.
D) transcendentalism.
Unlock Deck
Unlock for access to all 69 flashcards in this deck.
Unlock Deck
k this deck
57
The utilitarianism, Rawlsian, and benefits-received arguments all favor a ________ tax system.
A) regressive
B) progressive
C) proportional
D) value-added
A) regressive
B) progressive
C) proportional
D) value-added
Unlock Deck
Unlock for access to all 69 flashcards in this deck.
Unlock Deck
k this deck
58
The results of a survey conducted by Dan Ariely and Michael Norton found that Americans
A) have a preference for much greater equality in wealth distribution than currently exists.
B) have a preference for much less equality in wealth distribution than currently exists.
C) have a preference for roughly the amount equality in wealth distribution that currently exists.
D) show absolutely no preference for the amount of equality in wealth distribution in the nation.
Unlock Deck
Unlock for access to all 69 flashcards in this deck.
Unlock Deck
k this deck
59
In the United States, the highest quintile of income earners face an average federal tax rate of ________, and the lowest quintile of income earners face an average federal tax rate of ________.
A) 20%; 20%
B) 68.8%; 0.4%
C) 24%; 1.5%
D) 29.4%; 11.5%
A) 20%; 20%
B) 68.8%; 0.4%
C) 24%; 1.5%
D) 29.4%; 11.5%
Unlock Deck
Unlock for access to all 69 flashcards in this deck.
Unlock Deck
k this deck
60
In the United States, the highest quintile of income earners contribute ________ of all federal tax dollars received, and the lowest quintile of income earners contribute ________ of all federal tax dollars received
A) 20%; 20%
B) 68.8%; 0.4%
C) 24%; 1.5%
D) 29.4%; 11.5%
A) 20%; 20%
B) 68.8%; 0.4%
C) 24%; 1.5%
D) 29.4%; 11.5%
Unlock Deck
Unlock for access to all 69 flashcards in this deck.
Unlock Deck
k this deck
61
In the United States, the top 1% of income earners face an average federal tax rate of ________ and contribute ________ of all federal tax dollars received.
A) 73%; 49.5%
B) 20%; 5%
C) 24%; 9.1%
D) 29.4%; 24.2%
A) 73%; 49.5%
B) 20%; 5%
C) 24%; 9.1%
D) 29.4%; 24.2%
Unlock Deck
Unlock for access to all 69 flashcards in this deck.
Unlock Deck
k this deck
62
The question "Is the U.S tax system disproportionate enough?"is a ________ question, and the question "How would higher taxes make the rich behave?"is a ________ question.
A) normative; normative
B) normative; positive
C) positive; normative
D) positive; positive
A) normative; normative
B) normative; positive
C) positive; normative
D) positive; positive
Unlock Deck
Unlock for access to all 69 flashcards in this deck.
Unlock Deck
k this deck
63
Utilitarianism is the belief in a completely equal distribution of income for all people.
Unlock Deck
Unlock for access to all 69 flashcards in this deck.
Unlock Deck
k this deck
64
The benefits-received principle is based on the idea that higher taxes on the rich are justified because the rich can afford to pay higher taxes.
Unlock Deck
Unlock for access to all 69 flashcards in this deck.
Unlock Deck
k this deck
65
An argument against the benefits-received principle is the benefits the rich receive from government programs are available to everyone.
Unlock Deck
Unlock for access to all 69 flashcards in this deck.
Unlock Deck
k this deck
66
In the United States, the rich pay a disproportionate share of the cost of government.
Unlock Deck
Unlock for access to all 69 flashcards in this deck.
Unlock Deck
k this deck
67
If government raised taxes on the rich and this resulted in a decrease in productivity, the increase in taxes will still definitely make society better off.
Unlock Deck
Unlock for access to all 69 flashcards in this deck.
Unlock Deck
k this deck
68
What is the benefits-received principle? What are two arguments against this principle?
Unlock Deck
Unlock for access to all 69 flashcards in this deck.
Unlock Deck
k this deck
69
What are two ways that raising taxes on the rich can harm society?
Unlock Deck
Unlock for access to all 69 flashcards in this deck.
Unlock Deck
k this deck
Unlock Deck
Unlock for access to all 69 flashcards in this deck.


