Deck 5: Perfect Competition and the Invisible Hand, Economic Growth
Full screen (f)
Question
Question
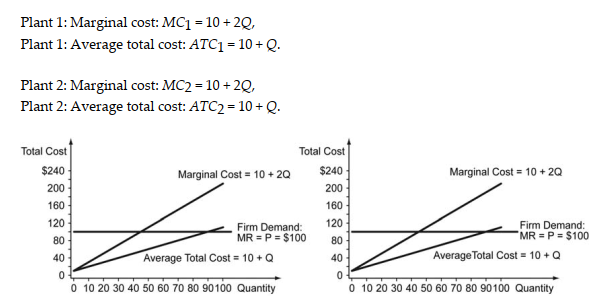
A small firm manufactures maple baseball bats in two small production facilities, with the following marginal cost and average total cost equations:
-Refer to the scenario above. Now suppose the plant is sold to a new owner with an undergraduate degree in economics and an MBA in finance. The new owner plans to follow the profit-maximizing rule (produce the level of output at which Marginal Cost = Price) rather than equalize production across both plants. Under this new guidance, production levels at each firm are ________. Explain your answer.
A) Produce 45 units of output at Plant 1 and shut down Plant 2
B) Produce 45 units of output at Plant 1 and produce 40 units of output at Plant 2
C) Produce 45 units of output at Plant 1 and produce 45 units of output at Plant 2
D) Produce 40 units of output at Plant 1 and 40 units of output at Plant 2
Question
A manufacturing firm operates three plants with the marginal cost curves shown in the figure and the average total costs summarized in the table below.
-Refer to the scenario above. If the market price of the firm's product is $80 per 100 kg, what is the firm's profit?
A) $31,000
B) $28,000
C) $23,000
D) $20,000
-Refer to the scenario above. If the market price of the firm's product is $80 per 100 kg, what is the firm's profit?
A) $31,000
B) $28,000
C) $23,000
D) $20,000
Question
Question
Question
Question
Question
Question
Question
The following table shows the GDP per capita of various countries for the years 1960 and 2010 in PPP-adjusted 2005 dollars. The table also contains the implied growth rates, which show how much on average each country needed to grow each year to reach the 2010 level of GDP per capita starting from the 1960 level of GDP per capita. Use the table to answer the following questions.
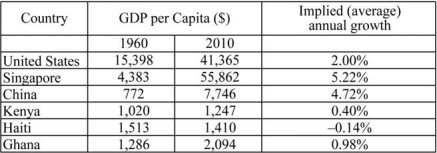 a) During 1960-2010, which countries were able to reduce the gap between their GDP per capita and the U.S. GDP per capita?
b) During 1960-2010, which countries failed to reduce the gap between their GDP per capita and the U.S. GDP per capita?
c) Why have some countries reduced the gap between their incomes and that of the United States and other countries failed to do so?
a) During 1960-2010, which countries were able to reduce the gap between their GDP per capita and the U.S. GDP per capita?b) During 1960-2010, which countries failed to reduce the gap between their GDP per capita and the U.S. GDP per capita?
c) Why have some countries reduced the gap between their incomes and that of the United States and other countries failed to do so?
Question
Question
Question
Question
Question
The following figure shows the production function and the relationship between investment and physical capital stock for a given saving rate.
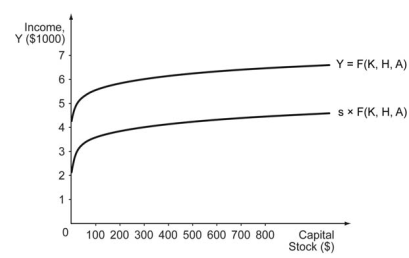
-Refer to the figure above. If the physical capital stock is fixed at $300, the GDP in this economy is________.
A) $4,000
B) $5,000
C) $6,000
D) $7,000
-Refer to the figure above. If the physical capital stock is fixed at $300, the GDP in this economy is________.
A) $4,000
B) $5,000
C) $6,000
D) $7,000
Question
The following figure shows the production function and the relationship between investment and physical capital stock for a given saving rate.
-Refer to the figure above. If the physical capital stock is fixed at $300, the aggregate investment in this economy will equal ________.
A) $4,000
B) $5,000
C) $6,000
D) $7,000
-Refer to the figure above. If the physical capital stock is fixed at $300, the aggregate investment in this economy will equal ________.
A) $4,000
B) $5,000
C) $6,000
D) $7,000
Question
The following figure shows the production function and the relationship between investment and physical capital stock for a given saving rate.
-Refer to the figure above. If the physical capital stock is fixed at $300, the total consumption in this economy will equal ________.
A) $2,000
B) $3,000
C) $4,000
D) $5,000
-Refer to the figure above. If the physical capital stock is fixed at $300, the total consumption in this economy will equal ________.
A) $2,000
B) $3,000
C) $4,000
D) $5,000
Question
Question
Question

Unlock Deck
Sign up to unlock the cards in this deck!
Unlock Deck
Unlock Deck
1/20
Play
Full screen (f)
Deck 5: Perfect Competition and the Invisible Hand, Economic Growth
1
Take a deck of playing cards and remove the aces, jacks, queens, and kings. Imagine that any remaining card in the deck is a single individual, either a seller or a consumer, and all are gathered at a single perfectly competitive market. Red cards are sellers, and black cards are consumers. The number on a card indicates the individual's reservation price. Each seller owns a single unit of an indivisible good. Each consumer can buy at most one unit of the good from a seller. The invisible hand predicts that the market outcome will be ________.
A) equilibrium price = 6, and units sold = 5
B) equilibrium price = 6, and units sold = 10
C) equilibrium price = 3, and units sold = 5
D) equilibrium price = 5, and units sold = 6
A) equilibrium price = 6, and units sold = 5
B) equilibrium price = 6, and units sold = 10
C) equilibrium price = 3, and units sold = 5
D) equilibrium price = 5, and units sold = 6
equilibrium price = 6, and units sold = 10
2
A small firm manufactures maple baseball bats in two small production facilities, with the following marginal cost and average total cost equations:
-Refer to the scenario above. Now suppose the plant is sold to a new owner with an undergraduate degree in economics and an MBA in finance. The new owner plans to follow the profit-maximizing rule (produce the level of output at which Marginal Cost = Price) rather than equalize production across both plants. Under this new guidance, production levels at each firm are ________. Explain your answer.
A) Produce 45 units of output at Plant 1 and shut down Plant 2
B) Produce 45 units of output at Plant 1 and produce 40 units of output at Plant 2
C) Produce 45 units of output at Plant 1 and produce 45 units of output at Plant 2
D) Produce 40 units of output at Plant 1 and 40 units of output at Plant 2
-Refer to the scenario above. Now suppose the plant is sold to a new owner with an undergraduate degree in economics and an MBA in finance. The new owner plans to follow the profit-maximizing rule (produce the level of output at which Marginal Cost = Price) rather than equalize production across both plants. Under this new guidance, production levels at each firm are ________. Explain your answer.
A) Produce 45 units of output at Plant 1 and shut down Plant 2
B) Produce 45 units of output at Plant 1 and produce 40 units of output at Plant 2
C) Produce 45 units of output at Plant 1 and produce 45 units of output at Plant 2
D) Produce 40 units of output at Plant 1 and 40 units of output at Plant 2
Produce 45 units of output at Plant 1 and produce 45 units of output at Plant 2
3
A manufacturing firm operates three plants with the marginal cost curves shown in the figure and the average total costs summarized in the table below.
-Refer to the scenario above. If the market price of the firm's product is $80 per 100 kg, what is the firm's profit?
A) $31,000
B) $28,000
C) $23,000
D) $20,000
-Refer to the scenario above. If the market price of the firm's product is $80 per 100 kg, what is the firm's profit?
A) $31,000
B) $28,000
C) $23,000
D) $20,000
$31,000
4
Which of the following statements is true?
A) Production in a perfectly competitive market is efficient because resources in the market leave those sectors in which price cannot cover their costs of production and enter those sectors in which price can cover their costs of production.
B) Production in a perfectly competitive market is suboptimal because the absence of free entry and exit of firms allows firms to specialize in only one particular industry.
C) Production in a perfectly competitive market is Pareto inefficient because the government or a central planner carefully analyzes the needs and requirements of society and instructs firms on what to produce and in what quantity.
D) Production in a perfectly competitive market is Pareto efficient because the government or a central planner carefully analyzes the needs and requirements of society and instructs firms on what to produce and in what quantity.
Unlock Deck
Unlock for access to all 20 flashcards in this deck.
Unlock Deck
k this deck
5
Which of the following statements differentiates between a shortage and a surplus?
A) A shortage occurs when price is held at the equilibrium price, but a surplus occurs when price is held above the equilibrium price.
B) A shortage occurs when price is held below the equilibrium price, but a surplus occurs when price is held at the equilibrium price.
C) A shortage occurs when quantity supplied exceeds quantity demanded, whereas a surplus occurs when quantity demanded exceeds quantity supplied.
D) A shortage occurs when quantity demanded exceeds quantity supplied, whereas a surplus occurs when quantity supplied exceeds quantity demanded.
Unlock Deck
Unlock for access to all 20 flashcards in this deck.
Unlock Deck
k this deck
6
Under Soviet collective farming after World War II, workers on collective farms were allowed to work small plots (no more than 1 hectare or about 2.5 acres) on which they could grow their own food and sell any surplus. Economist D. Gale Johnson found that while these small plots amounted to only 3.5 percent of agricultural land under cultivation in the Soviet Union, they produced more than one-third of the nation?s agricultural output. Johnson?s findings illustrate which of the following as it relates to central planning of agricultural production on large collective farms?
A) Central planning on the collective farms was successful in increasing output.
B) Central planning on the collective farms failed to increase demand.
C) Central planning on the collective farms resulted in large sunk costs.
D) Central planning on the collective farms failed to solve the incentive problem of aligning the interests of the landowner (the government) with the interest of the workers.
Unlock Deck
Unlock for access to all 20 flashcards in this deck.
Unlock Deck
k this deck
7
Suppose that a central planner in a country determines how much a physician is paid based on the value of inputs to his or her service. So, a specialist such as an oncologist would be paid more than a primary care physician. Which of the following best describes an incentive problem created by this method of payment determination?
A) It is difficult for a central planner to know the value of inputs.
B) It is difficult to coordinate the care provided by a specialist and a primary care doctor.
C) All else being equal, patients would rather see specialists even for minor problems.
D) All else being equal, oncologists would adopt a new treatment if it is more expensive.
Unlock Deck
Unlock for access to all 20 flashcards in this deck.
Unlock Deck
k this deck
8
GDP per capita in Australia is $50,000. If Australian GDP per capita grows 6 percent per year for 2 years, which formula shows its GDP per capita after 2 years?
A) $50,000 × 1.06
B) $50,000 × 1.12
C) $50,000 × 1.06 × 1.06
D) $50,000 × 1.06 × 1.12
A) $50,000 × 1.06
B) $50,000 × 1.12
C) $50,000 × 1.06 × 1.06
D) $50,000 × 1.06 × 1.12
Unlock Deck
Unlock for access to all 20 flashcards in this deck.
Unlock Deck
k this deck
9
In 2000, the GDP per capita in Ohio is $35,000. Ohio?s GDP per capita is predicted to increase 3 percent per year for the next 5 years.
-Refer to the scenario above. If the prediction in the scenario is correct, what will Ohio's GDP per capita be in 2005 (to the nearest thousand)?
A) $39,000
B) $40,000
C) $41,000
D) $42,000
-Refer to the scenario above. If the prediction in the scenario is correct, what will Ohio's GDP per capita be in 2005 (to the nearest thousand)?
A) $39,000
B) $40,000
C) $41,000
D) $42,000
Unlock Deck
Unlock for access to all 20 flashcards in this deck.
Unlock Deck
k this deck
10
The following table shows the GDP per capita of various countries for the years 1960 and 2010 in PPP-adjusted 2005 dollars. The table also contains the implied growth rates, which show how much on average each country needed to grow each year to reach the 2010 level of GDP per capita starting from the 1960 level of GDP per capita. Use the table to answer the following questions.
a) During 1960-2010, which countries were able to reduce the gap between their GDP per capita and the U.S. GDP per capita?
b) During 1960-2010, which countries failed to reduce the gap between their GDP per capita and the U.S. GDP per capita?
c) Why have some countries reduced the gap between their incomes and that of the United States and other countries failed to do so?
a) During 1960-2010, which countries were able to reduce the gap between their GDP per capita and the U.S. GDP per capita?b) During 1960-2010, which countries failed to reduce the gap between their GDP per capita and the U.S. GDP per capita?
c) Why have some countries reduced the gap between their incomes and that of the United States and other countries failed to do so?
Unlock Deck
Unlock for access to all 20 flashcards in this deck.
Unlock Deck
k this deck
11
In a closed economy without a government, the consumption expenditure equals $5,000 and the investment expenditure equals $2,000.
-Refer to the scenario above. What is the national income of the economy?
A) $2,000
B) $5,000
C) $7,000
D) $10,000
-Refer to the scenario above. What is the national income of the economy?
A) $2,000
B) $5,000
C) $7,000
D) $10,000
Unlock Deck
Unlock for access to all 20 flashcards in this deck.
Unlock Deck
k this deck
12
Consider a closed economy without a government. If the saving rate in the economy is 20 percent and the aggregate saving is $10,000, the aggregate consumption in the economy is ________.
A) $10,000
B) $37,000
C) $50,000
D) $45,000
A) $10,000
B) $37,000
C) $50,000
D) $45,000
Unlock Deck
Unlock for access to all 20 flashcards in this deck.
Unlock Deck
k this deck
13
Which of the following correctly identifies a Malthusian cycle?
A) An increase in GDP will increase GDP per capita above subsistence, which will cause a decrease in the size of the population, which will reduce pressure on resources and further increase GDP per capita.
B) An increase in GDP will increase GDP per capita above subsistence, which will cause an increase in the size of the population, which will increase pressure on resources and that will further increase GDP per capita.
C) An increase in GDP will increase GDP per capita above subsistence, which will cause an increase in the size of the population, which will increase pressure on resources and eventually reduce GDP per capita.
D) A decrease in GDP will decrease GDP per capita below subsistence, which will cause an increase in the size of the population, which will increase pressure on resources and eventually reduce GDP per capita.
Unlock Deck
Unlock for access to all 20 flashcards in this deck.
Unlock Deck
k this deck
14
If the saving rate in an economy is 30 percent and the level of investment in the economy is $400, the GDP of the economy must be ________.
A) $1,111.22
B) $1,333.33
C) $1,750.50
D) $1,900.25
A) $1,111.22
B) $1,333.33
C) $1,750.50
D) $1,900.25
Unlock Deck
Unlock for access to all 20 flashcards in this deck.
Unlock Deck
k this deck
15
The following figure shows the production function and the relationship between investment and physical capital stock for a given saving rate.
-Refer to the figure above. If the physical capital stock is fixed at $300, the GDP in this economy is________.
A) $4,000
B) $5,000
C) $6,000
D) $7,000
-Refer to the figure above. If the physical capital stock is fixed at $300, the GDP in this economy is________.
A) $4,000
B) $5,000
C) $6,000
D) $7,000
Unlock Deck
Unlock for access to all 20 flashcards in this deck.
Unlock Deck
k this deck
16
The following figure shows the production function and the relationship between investment and physical capital stock for a given saving rate.
-Refer to the figure above. If the physical capital stock is fixed at $300, the aggregate investment in this economy will equal ________.
A) $4,000
B) $5,000
C) $6,000
D) $7,000
-Refer to the figure above. If the physical capital stock is fixed at $300, the aggregate investment in this economy will equal ________.
A) $4,000
B) $5,000
C) $6,000
D) $7,000
Unlock Deck
Unlock for access to all 20 flashcards in this deck.
Unlock Deck
k this deck
17
The following figure shows the production function and the relationship between investment and physical capital stock for a given saving rate.
-Refer to the figure above. If the physical capital stock is fixed at $300, the total consumption in this economy will equal ________.
A) $2,000
B) $3,000
C) $4,000
D) $5,000
-Refer to the figure above. If the physical capital stock is fixed at $300, the total consumption in this economy will equal ________.
A) $2,000
B) $3,000
C) $4,000
D) $5,000
Unlock Deck
Unlock for access to all 20 flashcards in this deck.
Unlock Deck
k this deck
18
World War II resulted in the destruction of much of the United Kingdom?s physical capital stock. Assuming the country was in steady-state equilibrium before the war and nothing else changed, what does the Solow Model predict about the years following World War II in the United Kingdom?
A) A new steady-state equilibrium would emerge, with the current level of physical capital.
B) A new steady-state equilibrium would emerge, with a level of physical capital between the current level and the pre-war level.
C) The economy would never again reach a steady-state equilibrium.
D) The economy would eventually return to the old steady-state equilibrium, with the original level of physical capital.
Unlock Deck
Unlock for access to all 20 flashcards in this deck.
Unlock Deck
k this deck
19
GDP per capita in New Zealand grew from $15,000 to $25,000 over 10 years. What formula should you use to find New Zealand's average growth rate (g) over these 10 years?
A) g = (25,000 - 15,000)/10
B) 15,000 × (1 + g)10= 25,000
C) 25,000 × (1 + g)10 = 15,000
D) g10 = (25,000 - 15,000)
A) g = (25,000 - 15,000)/10
B) 15,000 × (1 + g)10= 25,000
C) 25,000 × (1 + g)10 = 15,000
D) g10 = (25,000 - 15,000)
Unlock Deck
Unlock for access to all 20 flashcards in this deck.
Unlock Deck
k this deck
20
In 2000, world GDP per capita was $5,500. In 2010, world GDP per capita was $9,500.
-Refer to the scenario above. What formula would you use to calculate the world average annual growth rate g?
A) g = (9,500 - 5,500)/10
B) g10 = (9,500 - 5,500)
C) 5,500 × (1 + g)10 = 9,500
D) 9,500 × (1 + g)10 = 5,500
-Refer to the scenario above. What formula would you use to calculate the world average annual growth rate g?
A) g = (9,500 - 5,500)/10
B) g10 = (9,500 - 5,500)
C) 5,500 × (1 + g)10 = 9,500
D) 9,500 × (1 + g)10 = 5,500
Unlock Deck
Unlock for access to all 20 flashcards in this deck.
Unlock Deck
k this deck
Unlock Deck
Unlock for access to all 20 flashcards in this deck.


