Deck 12: Hypothesis Testing With More Than Two Means: One-Way Analysis of Variance
Full screen (f)
Question
Question
Question
Question
How is the null hypothesis for the ANOVA test generally stated?
A) dfb = dfw
B)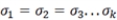
C) SST = SSB = SSW
D)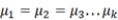
A) dfb = dfw
B)
C) SST = SSB = SSW
D)
Question
Question
Question
Question
Question
How is the test statistic for ANOVA calculated?
A) by dividing mean squares between by mean squares within (MSB/MSW)
B) by summing mean squares between and mean squares within, and dividing by total degrees of freedom ((MSB + MSW)/dft)
C) by looking up the value in an F distribution table with the appropriate degrees of freedom within (dfw) and degrees of freedom between (dfb)
D) by summing all the deviations from the overall mean score
Question
Question
Question
Question
Question
Question
Question
Question
Question
Question
Question
Question
Question
Question
Question
Environmental scientists gather a sample of 2016 chemical spill data from cities in six countries. This table shows information from each sample.
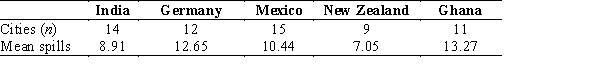
-What would be the degrees of freedom (between) for an ANOVA test?
A) 4
B) 5
C) 56
D) 61
-What would be the degrees of freedom (between) for an ANOVA test?
A) 4
B) 5
C) 56
D) 61
Question
Environmental scientists gather a sample of 2016 chemical spill data from cities in six countries. This table shows information from each sample.
-What would be the degrees of freedom (within) for an ANOVA test?
A) 4
B) 5
C) 56
D) 61
-What would be the degrees of freedom (within) for an ANOVA test?
A) 4
B) 5
C) 56
D) 61
Question
Environmental scientists gather a sample of 2016 chemical spill data from cities in six countries. This table shows information from each sample.
-In order to properly conduct an ANOVA test, which of the following should be equal across the five countries?
A) number of cities in each population
B) population average in chemical spills
C) sample average in chemical spills
D) population variance in chemical spills
-In order to properly conduct an ANOVA test, which of the following should be equal across the five countries?
A) number of cities in each population
B) population average in chemical spills
C) sample average in chemical spills
D) population variance in chemical spills
Question
Question
Question
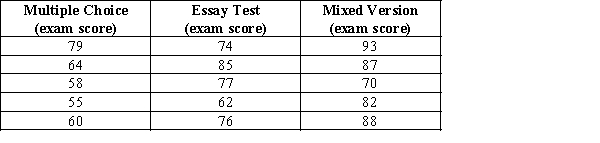
A professor wants to know whether students in his large art history class differ on their exam score depending on which version of the test he gives them, a multiple-choice exam, an essay exam, or a mixed version. A random sample of 5 students is drawn from each exam type.
Is there any statistically significant difference in the final exam scores? Use the five-step model and an alpha level of 0.05, and write a sentence or two of interpretation for your results.
Is there any statistically significant difference in the final exam scores? Use the five-step model and an alpha level of 0.05, and write a sentence or two of interpretation for your results.
Question
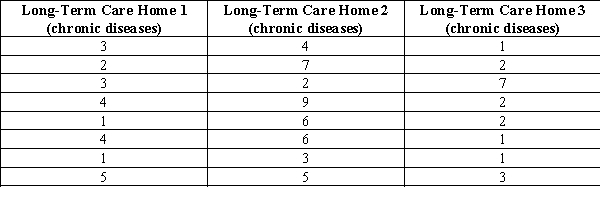
Suppose we want to compare the average number of chronic diseases across three long-term care homes. Below are data from random samples of residents from each long-term care home.
Is there a statistically significant mean number across the three groups? Use the five-step model and an alpha of 0.01, and a write a sentence or two to interpret your results.
Is there a statistically significant mean number across the three groups? Use the five-step model and an alpha of 0.01, and a write a sentence or two to interpret your results.

Unlock Deck
Sign up to unlock the cards in this deck!
Unlock Deck
Unlock Deck
1/30
Play
Full screen (f)
Deck 12: Hypothesis Testing With More Than Two Means: One-Way Analysis of Variance
1
What is the main difference between the t test and the ANOVA test?
A) The t test is for interval-ratio-dependent variables; ANOVA accommodates dependent variables from all types of measurements.
B) The t test assumes equal population variances across categories; ANOVA makes no such assumption.
C) The t test is for comparing means across two categories; ANOVA accommodates three or more categories.
D) The t test distinguishes between the independent and the dependent variable; ANOVA makes no such distinction.
The t test is for comparing means across two categories; ANOVA accommodates three or more categories.
2
An organization's scientist wants to know whether mean output per hour differs between workers of 10 large tech companies. He gathers randomly sampled data from workers in each firm. What is the appropriate statistical test for him to use?
A) t test for differences in means
B) t test for matched samples
C) ANOVA
D) Kendall's tau-b
A) t test for differences in means
B) t test for matched samples
C) ANOVA
D) Kendall's tau-b
ANOVA
3
Suppose we have randomly sampled data from five provinces on work days missed due to illness in the past year. If the null hypothesis is true, what would be true about the data?
A) Mean value of days missed should be roughly equal across the five provinces.
B) Each province should have a markedly different score.
C) The sample standard deviation values from each province would be identical.
D) Each province sample would be exactly the same size.
A) Mean value of days missed should be roughly equal across the five provinces.
B) Each province should have a markedly different score.
C) The sample standard deviation values from each province would be identical.
D) Each province sample would be exactly the same size.
Mean value of days missed should be roughly equal across the five provinces.
4
How is the null hypothesis for the ANOVA test generally stated?
A) dfb = dfw
B)
C) SST = SSB = SSW
D)
A) dfb = dfw
B)
C) SST = SSB = SSW
D)
Unlock Deck
Unlock for access to all 30 flashcards in this deck.
Unlock Deck
k this deck
5
Which of these conclusions emerges if a researcher rejects the null hypothesis in a test using analysis of variance?
A) The variables are independent.
B) The populations from which the samples originate are different.
C) The sample means are significantly different.
D) The population variances are the same.
A) The variables are independent.
B) The populations from which the samples originate are different.
C) The sample means are significantly different.
D) The population variances are the same.
Unlock Deck
Unlock for access to all 30 flashcards in this deck.
Unlock Deck
k this deck
6
What scenario most likely leads to rejecting the null hypothesis in an ANOVA test?
A) high variance within categories, and low variance between categories
B) high variance between categories, and low variance within categories
C) high variance within and between categories
D) low variance within and between categories
A) high variance within categories, and low variance between categories
B) high variance between categories, and low variance within categories
C) high variance within and between categories
D) low variance within and between categories
Unlock Deck
Unlock for access to all 30 flashcards in this deck.
Unlock Deck
k this deck
7
If the sum of squares total (SST) is 13.5 and the sum of squares within (SSW) is 6.5, what is the sum of squares between (SSB)?
A) 7
B) 20
C) 26.5
D) 87.75
A) 7
B) 20
C) 26.5
D) 87.75
Unlock Deck
Unlock for access to all 30 flashcards in this deck.
Unlock Deck
k this deck
8
What does SSB quantify?
A) the average difference between any two of the groups selected
B) the amount of total variation explained by group membership
C) the amount of variation in the population
D) the amount of variation between the groups selected
A) the average difference between any two of the groups selected
B) the amount of total variation explained by group membership
C) the amount of variation in the population
D) the amount of variation between the groups selected
Unlock Deck
Unlock for access to all 30 flashcards in this deck.
Unlock Deck
k this deck
9
How is the test statistic for ANOVA calculated?
A) by dividing mean squares between by mean squares within (MSB/MSW)
B) by summing mean squares between and mean squares within, and dividing by total degrees of freedom ((MSB + MSW)/dft)
C) by looking up the value in an F distribution table with the appropriate degrees of freedom within (dfw) and degrees of freedom between (dfb)
D) by summing all the deviations from the overall mean score
A) by dividing mean squares between by mean squares within (MSB/MSW)
B) by summing mean squares between and mean squares within, and dividing by total degrees of freedom ((MSB + MSW)/dft)
C) by looking up the value in an F distribution table with the appropriate degrees of freedom within (dfw) and degrees of freedom between (dfb)
D) by summing all the deviations from the overall mean score
Unlock Deck
Unlock for access to all 30 flashcards in this deck.
Unlock Deck
k this deck
10
Which of the following is equal to the F ratio?
A) the amount of variation between categories to the amount of variation within categories
B) the amount of total variation to the amount of variation within categories
C) the amount of total variation to the amount of variation between categories
D) the amount of variation within categories to the amount of variation between categories
Unlock Deck
Unlock for access to all 30 flashcards in this deck.
Unlock Deck
k this deck
11
A film studies researcher calculated the number of film appearances from randomly sampled Hollywood actors, Bollywood actors, and Chinese industry actors. She calculated an F score of 1.22 after comparing the three samples. What should the researcher do about the null hypothesis?
A) fail to reject it because the differences are not statistically significant
B) reject it because the differences are statistically significant but the effect size is small
C) fail to reject it because the means are significantly different from one another
D) reject it because the differences are no larger than what we would expect by chance
Unlock Deck
Unlock for access to all 30 flashcards in this deck.
Unlock Deck
k this deck
12
Which of these F (observed) values would most likely be used to reject the null hypothesis in an ANOVA test using reasonably large samples and an alpha value of 0.05?
A) -74
B) -1.3
C) 1.1
D) 3.9
A) -74
B) -1.3
C) 1.1
D) 3.9
Unlock Deck
Unlock for access to all 30 flashcards in this deck.
Unlock Deck
k this deck
13
A study tracking school violence shows that rural schools had an average of 4 documented violent episodes in the past school year, suburban schools had an average of 17 such episodes, and urban schools averaged 23 violent episodes. If in an ANOVA test the F (observed) statistic exceeded the F (critical) value, which of the following would we conclude about the relationship of regional context to school violence?
A) Urban schools report more violent episodes than suburban schools, and suburban schools report more violent episodes than rural schools.
B) Suburban schools report more violent episodes than rural schools, but the difference between suburban schools and urban schools is non-significant.
C) Urban, suburban, and rural schools do not report identical numbers of violent episodes.
D) There is no significant difference in violent episodes reported by urban, suburban, and rural schools.
Unlock Deck
Unlock for access to all 30 flashcards in this deck.
Unlock Deck
k this deck
14
Which of the following is an assumption that must be made in step 1 of the ANOVA test?
A) The random samples are theoretical.
B) The samples are non-random.
C) The random samples are independent.
D) The random samples are dependent.
A) The random samples are theoretical.
B) The samples are non-random.
C) The random samples are independent.
D) The random samples are dependent.
Unlock Deck
Unlock for access to all 30 flashcards in this deck.
Unlock Deck
k this deck
15
For which dependent variables are the ANOVA test most appropriate?
A) continuous and nominal
B) discrete and continuous
C) continuous and interval-ratio
D) discrete and ordinal
A) continuous and nominal
B) discrete and continuous
C) continuous and interval-ratio
D) discrete and ordinal
Unlock Deck
Unlock for access to all 30 flashcards in this deck.
Unlock Deck
k this deck
16
What is the research hypothesis for the ANOVA test?
A) All population means are different.
B) At least one sample mean is different.
C) All sample means are different.
D) At least one population mean is different.
A) All population means are different.
B) At least one sample mean is different.
C) All sample means are different.
D) At least one population mean is different.
Unlock Deck
Unlock for access to all 30 flashcards in this deck.
Unlock Deck
k this deck
17
A researcher wishes to use ANOVA to assess whether Vancouver men and women differ in whether they voted in the city's most recent municipal selection. He gathers large, equally sized EPSEM samples for each gender to conduct the analysis. What is the clearest problem with his intent to use ANOVA?
A) The independent variable should be interval-ratio.
B) The dependent variable should be interval-ratio.
C) ANOVA is more reliable for small samples than it is for large samples.
D) The data for this example do not come from random samples.
A) The independent variable should be interval-ratio.
B) The dependent variable should be interval-ratio.
C) ANOVA is more reliable for small samples than it is for large samples.
D) The data for this example do not come from random samples.
Unlock Deck
Unlock for access to all 30 flashcards in this deck.
Unlock Deck
k this deck
18
Which of the following would be an appropriate scenario for using the ANOVA procedure?
A) testing whether people who own homes have more wealth than non-homeowners
B) testing whether people from five countries differ in whether they own a home or not
C) testing whether taller people tend to make more money
D) testing whether people from four countries differed in their average height
A) testing whether people who own homes have more wealth than non-homeowners
B) testing whether people from five countries differ in whether they own a home or not
C) testing whether taller people tend to make more money
D) testing whether people from four countries differed in their average height
Unlock Deck
Unlock for access to all 30 flashcards in this deck.
Unlock Deck
k this deck
19
An ANOVA test indicates that there are statistically significant differences for the means of five distinct groups. What do the results of this test fail to tell us?
A) that the differences reveal something meaningful about real-world processes
B) that the differences observed are not likely due to chance fluctuation
C) that the populations representing these groups differ from one another on their mean scores
D) that the F (observed) value exceeds the F (critical) value
Unlock Deck
Unlock for access to all 30 flashcards in this deck.
Unlock Deck
k this deck
20
In what sense does eta-squared tell us the "effect size" of an association?
A) It describes whether the association is statistically significant.
B) It tells us the strength of the association.
C) It tells us how likely we are to observe the association by chance alone.
D) It tells us the appropriate alpha value that should be used to detect an association.
A) It describes whether the association is statistically significant.
B) It tells us the strength of the association.
C) It tells us how likely we are to observe the association by chance alone.
D) It tells us the appropriate alpha value that should be used to detect an association.
Unlock Deck
Unlock for access to all 30 flashcards in this deck.
Unlock Deck
k this deck
21
A researcher conducts an ANOVA test and calculates SSW = 840 and SSB = 312. How is the description of the strength of the association for these data best qualified?
A) as weak
B) as moderate
C) as strong
D) It is impossible to tell from this information.
A) as weak
B) as moderate
C) as strong
D) It is impossible to tell from this information.
Unlock Deck
Unlock for access to all 30 flashcards in this deck.
Unlock Deck
k this deck
22
Suppose we are analyzing the income levels of four ethnic groups and we want to determine how much variance in income can be attributed to ethnic background. What is the statistic that will provide us the answer?
A) eta-squared
B) post hoc test
C) F ratio
D) mean square estimate
A) eta-squared
B) post hoc test
C) F ratio
D) mean square estimate
Unlock Deck
Unlock for access to all 30 flashcards in this deck.
Unlock Deck
k this deck
23
A researcher calculates eta-squared as being 0.45. Which of the following is the best interpretation of this statistic?
A) We have a 45% chance of rejecting the null hypothesis.
B) The group with the lowest mean value is 45% as large as the group with the highest mean value.
C) Means this different between groups will occur by chance alone 45% of the time.
D) Knowing which group a case belongs to helps reduce errors in prediction by 45%.
Unlock Deck
Unlock for access to all 30 flashcards in this deck.
Unlock Deck
k this deck
24
Environmental scientists gather a sample of 2016 chemical spill data from cities in six countries. This table shows information from each sample.
-What would be the degrees of freedom (between) for an ANOVA test?
A) 4
B) 5
C) 56
D) 61
-What would be the degrees of freedom (between) for an ANOVA test?
A) 4
B) 5
C) 56
D) 61
Unlock Deck
Unlock for access to all 30 flashcards in this deck.
Unlock Deck
k this deck
25
Environmental scientists gather a sample of 2016 chemical spill data from cities in six countries. This table shows information from each sample.
-What would be the degrees of freedom (within) for an ANOVA test?
A) 4
B) 5
C) 56
D) 61
-What would be the degrees of freedom (within) for an ANOVA test?
A) 4
B) 5
C) 56
D) 61
Unlock Deck
Unlock for access to all 30 flashcards in this deck.
Unlock Deck
k this deck
26
Environmental scientists gather a sample of 2016 chemical spill data from cities in six countries. This table shows information from each sample.
-In order to properly conduct an ANOVA test, which of the following should be equal across the five countries?
A) number of cities in each population
B) population average in chemical spills
C) sample average in chemical spills
D) population variance in chemical spills
-In order to properly conduct an ANOVA test, which of the following should be equal across the five countries?
A) number of cities in each population
B) population average in chemical spills
C) sample average in chemical spills
D) population variance in chemical spills
Unlock Deck
Unlock for access to all 30 flashcards in this deck.
Unlock Deck
k this deck
27
Explain why the F test is always effectively a one-tailed test.
Unlock Deck
Unlock for access to all 30 flashcards in this deck.
Unlock Deck
k this deck
28
One of the challenges of the ANOVA procedure is that we do not know which pairs of sample means are significantly different from one another. Briefly explain how researchers can assess differences between particular sample means.
Unlock Deck
Unlock for access to all 30 flashcards in this deck.
Unlock Deck
k this deck
29
A professor wants to know whether students in his large art history class differ on their exam score depending on which version of the test he gives them, a multiple-choice exam, an essay exam, or a mixed version. A random sample of 5 students is drawn from each exam type.
Is there any statistically significant difference in the final exam scores? Use the five-step model and an alpha level of 0.05, and write a sentence or two of interpretation for your results.
Is there any statistically significant difference in the final exam scores? Use the five-step model and an alpha level of 0.05, and write a sentence or two of interpretation for your results.
Unlock Deck
Unlock for access to all 30 flashcards in this deck.
Unlock Deck
k this deck
30
Suppose we want to compare the average number of chronic diseases across three long-term care homes. Below are data from random samples of residents from each long-term care home.
Is there a statistically significant mean number across the three groups? Use the five-step model and an alpha of 0.01, and a write a sentence or two to interpret your results.
Is there a statistically significant mean number across the three groups? Use the five-step model and an alpha of 0.01, and a write a sentence or two to interpret your results.
Unlock Deck
Unlock for access to all 30 flashcards in this deck.
Unlock Deck
k this deck
Unlock Deck
Unlock for access to all 30 flashcards in this deck.


