Deck 11: Hypothesis Testing With Means and Proportions: The Two-Sample Case
Full screen (f)
Question
Question
Question
Question
Question
Question
Why must we typically use the formula 
instead of using ó1 and ó2 when conducting a two-sample hypothesis test?
A) because the standard deviations from the relevant populations (ó1 and ó2) are seldom known
B) because ó1 and ó2 are based on the sampling distribution, which is biased
C) because ó1 and ó2 can be used only for nominal level variables
D) because ó1 and ó2 increase the risk of Type I error
Question
Question
Question
Question
Question
Question
Question
Question
When testing for the significance of the difference between sample means when  (sigma) is unknown, which of the following is the proper sampling distribution?
A) the Z distribution
B) the beta distribution
C) the t distribution
D) the alpha distribution
(sigma) is unknown, which of the following is the proper sampling distribution?A) the Z distribution
B) the beta distribution
C) the t distribution
D) the alpha distribution
Question
Question
Question
Question
Question
Question
Question
Question
Question
Question
Question
Question
Question
Question
Question
Question
Question
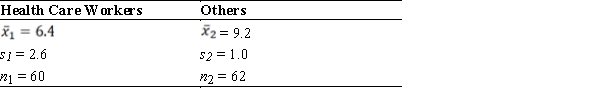
A scale measuring approval of Canada's health score system was administered to a sample. Does a statistically significant difference exist between health care workers and those who do not work in the health care field? Higher scores indicate greater confidence. Use the five-step model and an alpha level of 0.05 and write a sentence or two interpreting your results.

Unlock Deck
Sign up to unlock the cards in this deck!
Unlock Deck
Unlock Deck
1/31
Play
Full screen (f)
Deck 11: Hypothesis Testing With Means and Proportions: The Two-Sample Case
1
An economist wishes to compare retirement savings of public sector workers to private sector workers. What type of hypothesis test should she employ?
A) a one-sample, one-tailed hypothesis test
B) a one-sample, two-tailed hypothesis test
C) a contingency table analysis
D) a two-sample hypothesis test
A) a one-sample, one-tailed hypothesis test
B) a one-sample, two-tailed hypothesis test
C) a contingency table analysis
D) a two-sample hypothesis test
a two-sample hypothesis test
2
When testing for the significance of the difference between two samples, what is the proper assumption for step 1?
A) The samples are random only.
B) The samples are dependent and random.
C) The samples are independent only.
D) The samples are independent and random.
A) The samples are random only.
B) The samples are dependent and random.
C) The samples are independent only.
D) The samples are independent and random.
The samples are independent and random.
3
A sample is gathered from one country, and a second sample is gathered from another country. If the sampling conducted from country 1 had no bearing on the sampling conducted in country 2, what would we call this?
A) independent random sampling
B) dependent random sampling
C) pooled hypothesis sampling
D) alpha random sampling
A) independent random sampling
B) dependent random sampling
C) pooled hypothesis sampling
D) alpha random sampling
independent random sampling
4
Educational researchers wish to compare students from two school districts (Brownsville School District and Midlands School District) on their levels of scientific literacy. They provide all students with the same test and calculate average scores for each sample. What would be an appropriate null hypothesis?
A) The sample of Midlands students are no different from the sample of Brownsville students.
B) Mean levels of scientific literacy are equal across both school districts.
C) Mean levels of scientific literacy are equal across both samples.
D) The population variance for scientific literacy is equal across both school districts.
Unlock Deck
Unlock for access to all 31 flashcards in this deck.
Unlock Deck
k this deck
5
What pieces of information from two samples does the "pooled estimate" combine?
A) Z (obtained) scores for each sample
B) means of both sampling distributions
C) the difference in means between the two samples
D) sample standard deviations, divided by the size of each sample (n)
A) Z (obtained) scores for each sample
B) means of both sampling distributions
C) the difference in means between the two samples
D) sample standard deviations, divided by the size of each sample (n)
Unlock Deck
Unlock for access to all 31 flashcards in this deck.
Unlock Deck
k this deck
6
Why must we typically use the formula
instead of using ó1 and ó2 when conducting a two-sample hypothesis test?
A) because the standard deviations from the relevant populations (ó1 and ó2) are seldom known
B) because ó1 and ó2 are based on the sampling distribution, which is biased
C) because ó1 and ó2 can be used only for nominal level variables
D) because ó1 and ó2 increase the risk of Type I error
Unlock Deck
Unlock for access to all 31 flashcards in this deck.
Unlock Deck
k this deck
7
When testing for the significance of the difference between two sample means, which of the following must be estimated before computing the test statistic?
A) the critical region
B) the standard deviation of the sampling distribution
C) the standard deviations of the samples
D) the population means
A) the critical region
B) the standard deviation of the sampling distribution
C) the standard deviations of the samples
D) the population means
Unlock Deck
Unlock for access to all 31 flashcards in this deck.
Unlock Deck
k this deck
8
When testing for the significance of the difference between two sample means, which of the following is used to estimate the standard deviation of the sampling distribution?
A) sample standard deviations corrected for bias
B) the standard error of the means
C) population standard deviations
D) degrees of freedom
A) sample standard deviations corrected for bias
B) the standard error of the means
C) population standard deviations
D) degrees of freedom
Unlock Deck
Unlock for access to all 31 flashcards in this deck.
Unlock Deck
k this deck
9
Random samples of persons living in urban and suburban areas have been given a scale that measures their support for gun control. Persons residing in urban areas average 10.2 with a standard deviation of 5.3. Persons residing in suburban areas also average 10.2, but the standard deviation is 1.8. What is the appropriate way to deal with these results?
A) Do not conduct any tests: because the sample means are the same value, these results cannot be significant.
B) Test the difference in the sample means for statistical significance.
C) Use a test of significance with a very high alpha level (á > 0.10).
D) Use a one-tailed test of significance.
A) Do not conduct any tests: because the sample means are the same value, these results cannot be significant.
B) Test the difference in the sample means for statistical significance.
C) Use a test of significance with a very high alpha level (á > 0.10).
D) Use a one-tailed test of significance.
Unlock Deck
Unlock for access to all 31 flashcards in this deck.
Unlock Deck
k this deck
10
The mean of group 1 (n = 50) is 100, and the mean of group 2 (n = 60) is 90. Both samples have a standard deviation of 20. What is the appropriate value for the test statistic?
A) alpha
B) 50 + 60 = 110
C) 100 - 90 = 10
D) 20 - 20 = 0
A) alpha
B) 50 + 60 = 110
C) 100 - 90 = 10
D) 20 - 20 = 0
Unlock Deck
Unlock for access to all 31 flashcards in this deck.
Unlock Deck
k this deck
11
Which of these variables would be appropriate for testing the difference between two sample means?
A) gender
B) height, in inches
C) social class (lower, middle, upper)
D) make and model of car
A) gender
B) height, in inches
C) social class (lower, middle, upper)
D) make and model of car
Unlock Deck
Unlock for access to all 31 flashcards in this deck.
Unlock Deck
k this deck
12
A random sample of Toronto car commuters is compared to a random sample of Toronto bike commuters. After analyzing post-commute stress levels, researchers fail to reject the null hypothesis. Which of the following could they conclude?
A) Car commuters and bike commuters differ significantly in their levels of post-commute stress.
B) Car commuters are more stressed after their commutes than are bike commuters.
C) The difference between the groups is significant, but it is impossible to determine which group is more stressed.
D) Any difference in stress between car commuters and bike commuters is no greater than could have occurred by chance alone.
Unlock Deck
Unlock for access to all 31 flashcards in this deck.
Unlock Deck
k this deck
13
Demographers test whether immigrants or native-born Canadians have higher fertility rates. They obtain sample statistics from both populations and obtain a Z (obtained) score of 2.02 in the comparison of means. Under what conditions could they reject the null hypothesis, assuming a two-tailed test?
A) only if alpha was set at 0.05: Z (critical) = ±1.96
B) only if alpha was set at 0.01: Z (critical) = ±2.33
C) only if alpha was set at 0.001: Z (critical) = ±2.58
D) The null hypothesis would be rejected at any alpha value.
A) only if alpha was set at 0.05: Z (critical) = ±1.96
B) only if alpha was set at 0.01: Z (critical) = ±2.33
C) only if alpha was set at 0.001: Z (critical) = ±2.58
D) The null hypothesis would be rejected at any alpha value.
Unlock Deck
Unlock for access to all 31 flashcards in this deck.
Unlock Deck
k this deck
14
When testing for the significance of the difference between sample means when (sigma) is unknown, which of the following is the proper sampling distribution?
A) the Z distribution
B) the beta distribution
C) the t distribution
D) the alpha distribution
(sigma) is unknown, which of the following is the proper sampling distribution?A) the Z distribution
B) the beta distribution
C) the t distribution
D) the alpha distribution
Unlock Deck
Unlock for access to all 31 flashcards in this deck.
Unlock Deck
k this deck
15
Which population parameter is assumed to be approximately equal for a two-sample hypothesis test using the t distribution?
A) population means
B) population variances
C) sampling distributions
D) population sizes
A) population means
B) population variances
C) sampling distributions
D) population sizes
Unlock Deck
Unlock for access to all 31 flashcards in this deck.
Unlock Deck
k this deck
16
Researchers conduct a test of mean differences using the t distribution with sample sizes of 30 and 35. The researchers specify a two-tailed test and set alpha at 0.05. What is the degrees of freedom they need to obtain the critical value for their test?
A) 29
B) 34
C) 63
D) 65
A) 29
B) 34
C) 63
D) 65
Unlock Deck
Unlock for access to all 31 flashcards in this deck.
Unlock Deck
k this deck
17
Which of these sets of samples would qualify as meeting the assumption of sample size equality for calculating a "pooled estimate" in a two-sample hypothesis test?
A) sample 1: n = 200; sample 2: n = 45
B) sample 1: n = 500; sample 2: n = 300
C) sample 1: n = 800; sample 2: n = 350
D) sample 1: n = 1500; sample 2: n = 650
A) sample 1: n = 200; sample 2: n = 45
B) sample 1: n = 500; sample 2: n = 300
C) sample 1: n = 800; sample 2: n = 350
D) sample 1: n = 1500; sample 2: n = 650
Unlock Deck
Unlock for access to all 31 flashcards in this deck.
Unlock Deck
k this deck
18
Under which of these circumstances is the assumption of equal population variance safe to assume in a two-sample hypothesis test?
A) when both samples are greater than n = 100
B) when both samples are approximately equal in size
C) when the difference in means between the two samples is statistically significant
D) when the ratio of the sample standard deviation is smaller than 2
A) when both samples are greater than n = 100
B) when both samples are approximately equal in size
C) when the difference in means between the two samples is statistically significant
D) when the ratio of the sample standard deviation is smaller than 2
Unlock Deck
Unlock for access to all 31 flashcards in this deck.
Unlock Deck
k this deck
19
Which of these examples of the two-sample hypothesis test will have the greatest degrees of freedom?
A) sample 1: mean = 1600, standard deviation = 500, n = 45; sample 2: mean = 1200, standard deviation = 200, n = 85
B) sample 1: mean = 3.2, standard deviation = 0.7, n = 155; sample 2: mean = 4.6, standard deviation = 0.9, n = 25
C) sample 1: mean = 44, standard deviation = 8, n = 1400; sample 2: mean = 42, standard deviation = 10, n = 500
D) sample 1: mean = 122, standard deviation = 46, n = 900; sample 2: mean = 153, standard deviation = 38, n = 1300
Unlock Deck
Unlock for access to all 31 flashcards in this deck.
Unlock Deck
k this deck
20
From the population of a university, random samples of 45 graduate students and 37 undergraduate students were given a scale that measures sexual experiences. The undergraduate students report an average of 1.6 sexual partners over their lifetimes, while the graduate students report an average of 2.5 partners. The t (obtained) for this difference was -3.56, and the t (critical) was ±2.34. Which of the following can be concluded from these observations?
A) that sexual mores are deteriorating
B) that undergraduate students are more sexually active
C) that graduate students and undergraduate students are significantly different in their sexual experiences
D) that no significant difference exists between graduate students and undergraduate students
A) that sexual mores are deteriorating
B) that undergraduate students are more sexually active
C) that graduate students and undergraduate students are significantly different in their sexual experiences
D) that no significant difference exists between graduate students and undergraduate students
Unlock Deck
Unlock for access to all 31 flashcards in this deck.
Unlock Deck
k this deck
21
When conducting a two-sample test of proportion differences, what must be calculated first in order to obtain a value for the standard deviation of the sampling distribution?
A) Pu: an estimate of the overall population proportion
B) Z (obtained): the test statistic used to evaluate the null hypothesis
C) Z (critical): the area on the x-axis of the curve demarcating the critical region
D) alpha: the threshold of error deemed appropriate for the test
A) Pu: an estimate of the overall population proportion
B) Z (obtained): the test statistic used to evaluate the null hypothesis
C) Z (critical): the area on the x-axis of the curve demarcating the critical region
D) alpha: the threshold of error deemed appropriate for the test
Unlock Deck
Unlock for access to all 31 flashcards in this deck.
Unlock Deck
k this deck
22
A sociologist thinks that politically liberal Canadians are more likely to support late-term abortions than are politically conservative Canadians. If this idea was to be formally tested as a one-tailed hypothesis test, what would be the null hypothesis?
A) A higher proportion of liberals than conservatives support late-term abortions.
B) A higher proportion of conservatives than liberals support late-term abortions.
C) A lower proportion of conservatives than liberals support late-term abortions.
D) The proportions of liberals and conservatives supporting late-term abortions are equal.
Unlock Deck
Unlock for access to all 31 flashcards in this deck.
Unlock Deck
k this deck
23
How would a researcher estimate the value of the population proportion for tests of significance involving two sample proportions?
A) from the sample standard deviations
B) from the value of the sample means
C) from the sample proportions
D) from the value of Z (obtained)
A) from the sample standard deviations
B) from the value of the sample means
C) from the sample proportions
D) from the value of Z (obtained)
Unlock Deck
Unlock for access to all 31 flashcards in this deck.
Unlock Deck
k this deck
24
Random samples of 145 men and 237 women from a university were asked if they had ever cheated in one of their courses. Eight percent of the men and 6% of the women said that they had cheated. Which is the appropriate test for assessing the significance of this difference?
A) small samples: a test for the significance of the difference between two sample proportions
B) large samples: a test for the significance of the difference between two sample means
C) matched samples: a test for the significance of the difference between two sample proportions
D) large samples: a test for the significance of the difference between two sample proportions
Unlock Deck
Unlock for access to all 31 flashcards in this deck.
Unlock Deck
k this deck
25
Two sets of 95% confidence intervals correspond to a random sample of two groups: group A: c.i. = 6.5 ± 0.5; group B: c.i. = 7.4 ± 0.2. Which of the following could we conclude about the mean differences of the groups with these confidence intervals?
A) There is a significant difference between the two populations' means (alpha = 0.05).
B) There is no significant difference between the two populations' means (alpha = 0.05).
C) The confidence intervals overlap, so there is likely a significant difference between the two populations' means.
D) We cannot conclude anything; the confidence intervals overlap, but the separate confidence intervals do not correctly pool the variance and sample size of the two groups.
Unlock Deck
Unlock for access to all 31 flashcards in this deck.
Unlock Deck
k this deck
26
Two sets of 95% confidence intervals correspond to proportions calculated from a random sample of two groups: group A: c.i. = 0.64 ± 0.06; group B: c.i. = 0.61 ± 0.05. Which of the following could we conclude about the proportion differences of the groups with these confidence intervals?
A) There is definitely no significant difference between the groups at alpha = 0.05.
B) There is likely no significant difference between the groups at alpha = 0.05, but a formal hypothesis test should still be conducted to make sure.
C) There is definitely a significant difference between the groups at alpha = 0.05.
D) An error has been made; confidence intervals cannot be calculated for proportions.
Unlock Deck
Unlock for access to all 31 flashcards in this deck.
Unlock Deck
k this deck
27
Which of the following describes the situation when confidence intervals and the formal hypothesis testing procedure always lead to the same conclusion?
A) when confidence intervals between two groups do not overlap
B) when confidence intervals between two groups overlap
C) when both samples are bigger than n = 100
D) when both samples have equal variances
A) when confidence intervals between two groups do not overlap
B) when confidence intervals between two groups overlap
C) when both samples are bigger than n = 100
D) when both samples have equal variances
Unlock Deck
Unlock for access to all 31 flashcards in this deck.
Unlock Deck
k this deck
28
A test was conducted for the significance of the difference in average education for random samples of males and females in Canada. Males received an average of 13.67 years of schooling and females received an average of 14.05 years. The obtained Z score for this difference was -59.9. Based on these results, which of the following is a reasonable conclusion?
A) The difference is important but not statistically significant.
B) The difference is statistically significant.
C) There is no gender gap in education in Canada.
D) The difference is not statistically significant and was probably caused by random chance.
A) The difference is important but not statistically significant.
B) The difference is statistically significant.
C) There is no gender gap in education in Canada.
D) The difference is not statistically significant and was probably caused by random chance.
Unlock Deck
Unlock for access to all 31 flashcards in this deck.
Unlock Deck
k this deck
29
Explain the meaning of the "null hypothesis" for a two-sample test of means or proportions.
Unlock Deck
Unlock for access to all 31 flashcards in this deck.
Unlock Deck
k this deck
30
Describe two ways that researchers can meet the requirement of "independent random sampling."
Unlock Deck
Unlock for access to all 31 flashcards in this deck.
Unlock Deck
k this deck
31
A scale measuring approval of Canada's health score system was administered to a sample. Does a statistically significant difference exist between health care workers and those who do not work in the health care field? Higher scores indicate greater confidence. Use the five-step model and an alpha level of 0.05 and write a sentence or two interpreting your results.
Unlock Deck
Unlock for access to all 31 flashcards in this deck.
Unlock Deck
k this deck
Unlock Deck
Unlock for access to all 31 flashcards in this deck.


