Deck 2: Production Possibilities and Opportunity Costs
Full screen (f)
Question
Question
Question
Question
Question
Question
Question
Question
Question
Question
Question
Question
Question
Question
Question
Question
Question
Question
Question
Question
Question
Question
Question
Question
Question
Question
Question
Question
Exhibit B-1 below shows the quantity of thing-a-ma-jigs or truffala fruit that can be produced by each country, if all of its resources are devoted to that product.
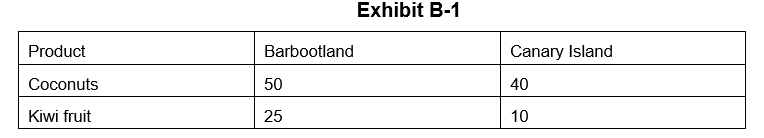
-In Exhibit B-1 Barbootland has an absolute advantage in the production of kiwi fruit.
-In Exhibit B-1 Barbootland has an absolute advantage in the production of kiwi fruit.
Question
Exhibit B-1 below shows the quantity of thing-a-ma-jigs or truffala fruit that can be produced by each country, if all of its resources are devoted to that product.
-Referring to Exhibit B-1, Barbootland has a comparative advantage in the production of coconuts.
-Referring to Exhibit B-1, Barbootland has a comparative advantage in the production of coconuts.
Question
Exhibit B-1 below shows the quantity of thing-a-ma-jigs or truffala fruit that can be produced by each country, if all of its resources are devoted to that product.
-In Exhibit B-1 Canary Island has a comparative advantage in the production of coconuts.
-In Exhibit B-1 Canary Island has a comparative advantage in the production of coconuts.
Question
Exhibit B-1 below shows the quantity of thing-a-ma-jigs or truffala fruit that can be produced by each country, if all of its resources are devoted to that product.
-Referring to Exhibit B-1, Canary Island has an absolute advantage in the production of both coconuts and kiwi fruit.
-Referring to Exhibit B-1, Canary Island has an absolute advantage in the production of both coconuts and kiwi fruit.
Question
Exhibit B-1 below shows the quantity of thing-a-ma-jigs or truffala fruit that can be produced by each country, if all of its resources are devoted to that product.
-Canary Island, in Exhibit B-1, does not have a comparative advantage in the production of either product.
-Canary Island, in Exhibit B-1, does not have a comparative advantage in the production of either product.
Question
Exhibit B-1 below shows the quantity of thing-a-ma-jigs or truffala fruit that can be produced by each country, if all of its resources are devoted to that product.
-Trade is possible because Canary Island's opportunity cost of coconuts is less than Barbootland's.
-Trade is possible because Canary Island's opportunity cost of coconuts is less than Barbootland's.
Question
Exhibit B-1 below shows the quantity of thing-a-ma-jigs or truffala fruit that can be produced by each country, if all of its resources are devoted to that product.
-Trade is not possible because Barbootland has an absolute advantage in the production of both goods.
-Trade is not possible because Barbootland has an absolute advantage in the production of both goods.
Question
Exhibit B-1 below shows the quantity of thing-a-ma-jigs or truffala fruit that can be produced by each country, if all of its resources are devoted to that product.
-Referring to the information in Exhibit B-1, the opportunity cost of one kiwi fruit is
A) 50 coconuts
B) ½ coconuts
C) 2 coconuts
D) 25 coconuts
E) 2.5
-Referring to the information in Exhibit B-1, the opportunity cost of one kiwi fruit is
A) 50 coconuts
B) ½ coconuts
C) 2 coconuts
D) 25 coconuts
E) 2.5
Question
Exhibit B-1 below shows the quantity of thing-a-ma-jigs or truffala fruit that can be produced by each country, if all of its resources are devoted to that product.
-Canary Island's opportunity cost (examine Exhibit B-1) of coconuts is equal to
A) 10 kiwi fruit
B) 40 coconuts
C) 4 kiwi fruit
D) ¼ kiwi fruit
E) 4/5 kiwi fruit
-Canary Island's opportunity cost (examine Exhibit B-1) of coconuts is equal to
A) 10 kiwi fruit
B) 40 coconuts
C) 4 kiwi fruit
D) ¼ kiwi fruit
E) 4/5 kiwi fruit
Question
Exhibit B-1 below shows the quantity of thing-a-ma-jigs or truffala fruit that can be produced by each country, if all of its resources are devoted to that product.
-Given the data in Exhibit B-1
A) Canary Island should produce coconuts and trade with Barbootland for kiwi fruit.
B) Canary Island should produce kiwi fruit and trade with Barbootland for coconuts.
C) Barbootland should produce coconuts and trade with Canary Island for kiwi fruit.
D) trade is not possible because Barbootland does not have a comparative advantage in producing either good.
E) trade is not possible because Barbootland has an absolute advantage in production of both goods.
Question
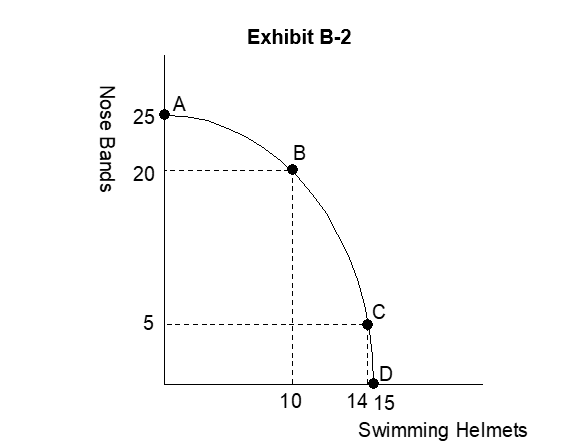
-Starting from point B in Exhibit B-2 (on the next page), the opportunity cost of 4 more swimming helmets is
A) 20 nose bands
B) 5 nose bands
C) 15 nose bands
D) 3.75 nose bands
E) indeterminate
Question
-As we move from point A to B, to C, and finally to D in Exhibit B-2, the Law of Increasing Cost is reflected by the fact that the opportunity cost of swimming helmets
A) increases
B) decreases
C) remains constant
D) changes sporadically
E) is indeterminate
Question
-Moving from point A to point B in Exhibit B-2 the opportunity cost of 1 swimming helmet is
A) 1 nose band
B) 2 nose bands
C) 4 nose bands
D) 5 nose bands
E) 8 nose bands
Question
Question
Question
Question
Question
Question
Question
Question
Question
Question
Question
Question
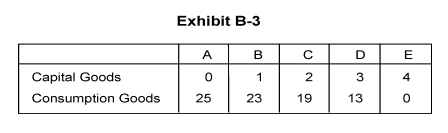
-Exhibit B-3 shows an economy's production possibilities table. If it chooses the combination of goods at point A,
A) not all the available resources are being used
B) all resources are used in the production of capital goods
C) no consumption goods are being produced
D) every resource in the economy is being used in the production of consumption goods
E) no capital goods are being used as factors of production
Question
-Exhibit B-3 shows an economy's production possibilities table. As additional units of capital goods are produced, the quantity of consumption goods produced _________,because _____________.
A) increases; the production possibilities table shows only the maximum efficiency points
B) increases; of the law of increasing costs
C) decreases; of the law of increasing costs
D) decreases; there is a limited supply of resources
E) increases; capital goods are used to produce consumption goods
Question
-Exhibit B-3 shows an economy's production possibilities table. As additional units of capital goods are produced, the opportunity cost in terms of sacrificed units ofconsumption goods ________ because of __________.
A) decreases; greater efficiency in production
B) increases; decreasing opportunity cost
C) increases; the law of increasing costs
D) increases; greater efficiency in production
E) decreases; the law of increasing costs
Question
Question
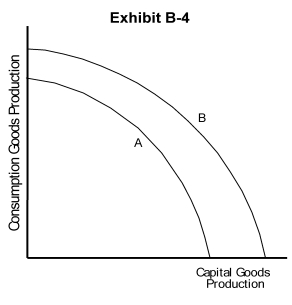
-In Exhibit B-4, which of the following could have caused the production possibilities curve to shift from curve A to curve B?
A) a major natural disaster
B) an increase in consumption goods production this year
C) the use of newer and more productive technology
D) a decrease in unemployment
E) a decrease in consumption goods production this year
Question
-In Exhibit B-4, which of the following could have caused the production possibilities curve to shift from curve B to curve A?
A) a major natural disaster
B) an increase in resources
C) the use of newer and more productive technology
D) a decrease in unemployment
E) an improvement in literacy
Question
Question
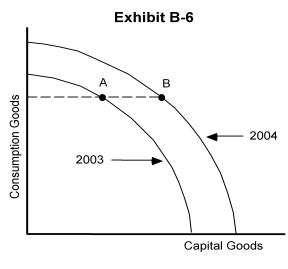
-In year 2003 the country of Exhibit B-6 was located at point A on its year 2003 production possibilities curve. In 2004 this country was located at point B on its 2004 production possibilities curve. Which of the following could have caused this shift in its production possibilities curve?
A) more efficient production in 2003
B) greater use of resources in 2003
C) a natural disaster in 2003 which led to a destruction of resources
D) higher unemployment in 2003
E) the production of capital goods in 2003 increased its resource base for 2004
Question
-In year 2003- the country of Exhibit B-6 was located at point A on its year 2003 production possibilities curve. In 2004 this country was located at point B on its 2004 production possibilities curve. This country
A) is producing the same quantity of capital goods in both years
B) is producing the same quantity of consumption goods in both years
C) had no economic growth between 2003 and 2004
D) had higher unemployment in 2003 than in 2004
E) had higher unemployment in 2004 than in 2003
Question
-In year 2003 the country of Exhibit B-6 was located at point A on its year 2003 production possibilities curve. In 2004 this country was located at point B on its 2004 production possibilities curve. This economy
A) produces less of both goods in 2004 than in 2003
B) produces less of capital goods in 2004 than in 2003
C) is more efficient in 2004 than in 2003
D) experienced economic growth since 2003
E) had higher unemployment in 2004 than in 2003
Question
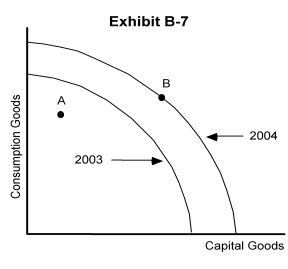
-Exhibit B-7 shows the production possibilities curves for a country for the years 2003and 2004. Suppose the country was located at point A in 2003 and point B in 2004. This economy
A) experienced a loss of resources in 2004
B) had lower unemployment in 2004 than in 2003
C) achieved full employment in 2003 and in 2004
D) is less efficient in 2004 than in 2003
E) produced fewer goods in 2004 than in 2003
Question
-Exhibit B-7 shows the production possibilities curves for a country for the years 2003 and 2004. Which of the following could have caused this shift in the production possibility curves?
A) a decrease in unemployment
B) a decline in technology
C) an increase in the quantity of capital goods used as a resource
D) a natural disaster
E) more efficient production
Question
Question
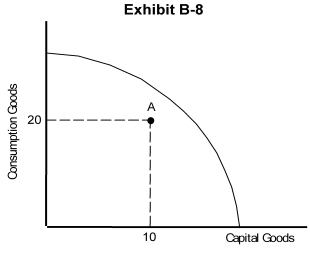
-Exhibit B-8 (on the previous page) shows an economy located at point A, within its production possibilities curve. Which of the following statements is false?
A) This economy could produce more of both capital and consumption goods.
B) This economy is experiencing full employment.
C) This economy could produce more capital goods without decreasing the quantity of consumption goods produced.
D) This economy could produce more consumption goods without decreasing the quantity of capital goods produced.
E) Not every resource in this economy is being utilized.
Question
Question
Question
Question
Question
Question
Question

-In Exhibit B-9, if the economy decides to locate at point E,
A) this is its best choice because it is producing maximum capital goods
B) this is its best choice because it is producing maximum consumption goods
C) it has not achieved full employment
D) it could not sustain itself in the long run because its people will have no consumption goods (presumably, this includes food)
E) the economy has not achieved maximum efficiency
Question
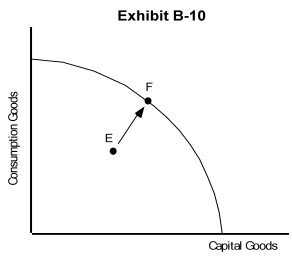
-If the economy of Exhibit B-10 was located at point E but has moved to point F, we would know that
A) it was impossible because it hasn't sufficient resources to make that move
B) the rate of unemployment increased
C) consumption goods production increased, but capital goods production decreased
D) its unemployment decreased, but at the expense of either capital or consumption goods production
E) it has achieved full employment
Question
-If the economy of Exhibit B-10 was located at point E but has moved to point F, which of the following could have caused this movement?
A) an advance in technology
B) an increase in the quantity of resources
C) an increase in human capital, e.g., higher levels of education
D) the productive use of previously unemployed resources
E) an increase in unemployment
Question
Question
Question
Question
Question
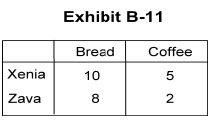
-Suppose Xenia and Zava produce only bread and coffee with their production possibilities schedule shown in Exhibit B-11. Which statement is true?
A) Zava has an absolute advantage in the production of both bread and coffee.
B) Zava has an absolute advantage only in the production of bread.
C) Xenia has an absolute advantage only in the production of bread.
D) Xenia has an absolute advantage only in the production of coffee.
E) Xenia has an absolute advantage in the production of both products.
Question
-Given the production possibilities schedule in Exhibit B-11 for Xenia, one coffee costs _________.
A) 1.5 bread
B) 3.0 bread
C) 0.5 bread
D) 2.0 bread
E) 2.5 bread

Unlock Deck
Sign up to unlock the cards in this deck!
Unlock Deck
Unlock Deck
1/166
Play
Full screen (f)
Deck 2: Production Possibilities and Opportunity Costs
1
A tractor used in the fields by a farmer is an example of capital.
True
2
Using robots on an assembly line is an example of an investment in human capital.
False
3
Land is a resource category that includes timber growing on the land.
True
4
If we move along a production possibilities curve and choose more of one type of good, the opportunity cost is measured in terms of the amount of the other good that is given up.
Unlock Deck
Unlock for access to all 166 flashcards in this deck.
Unlock Deck
k this deck
5
All resources are assumed to be of equal quality when we draw a production possibilities curve that is bowed out.
Unlock Deck
Unlock for access to all 166 flashcards in this deck.
Unlock Deck
k this deck
6
A wealthy economy is likely to choose to produce all consumption goods and no capital goods.
Unlock Deck
Unlock for access to all 166 flashcards in this deck.
Unlock Deck
k this deck
7
If an economy is operating at a point inside its production possibilities curve, this reflects inefficient resource use.
Unlock Deck
Unlock for access to all 166 flashcards in this deck.
Unlock Deck
k this deck
8
If all countries specialize in producing goods for which they have a comparative advantage, then total world output will be lower.
Unlock Deck
Unlock for access to all 166 flashcards in this deck.
Unlock Deck
k this deck
9
The production of more capital goods this year means we must sacrifice the production of consumption goods in the future.
Unlock Deck
Unlock for access to all 166 flashcards in this deck.
Unlock Deck
k this deck
10
To move along a production possibilities curve from one point to another requires additional resources.
Unlock Deck
Unlock for access to all 166 flashcards in this deck.
Unlock Deck
k this deck
11
Unemployment or underemployment is shown by a point located inside the production possibilities curve.
Unlock Deck
Unlock for access to all 166 flashcards in this deck.
Unlock Deck
k this deck
12
When resources are destroyed the production possibilities curve inward to the left.
Unlock Deck
Unlock for access to all 166 flashcards in this deck.
Unlock Deck
k this deck
13
A country should always specialize in the production of any product for which it holds an absolute advantage.
Unlock Deck
Unlock for access to all 166 flashcards in this deck.
Unlock Deck
k this deck
14
Innovation is the application of new technology to a production process.
Unlock Deck
Unlock for access to all 166 flashcards in this deck.
Unlock Deck
k this deck
15
Food in the pantry of a household is a resource.
Unlock Deck
Unlock for access to all 166 flashcards in this deck.
Unlock Deck
k this deck
16
The law of increasing costs causes the production possibilities curve to be bowed outward from the origin.
Unlock Deck
Unlock for access to all 166 flashcards in this deck.
Unlock Deck
k this deck
17
An increase in unemployment will cause this year's production possibilities curve to shift inward toward the origin.
Unlock Deck
Unlock for access to all 166 flashcards in this deck.
Unlock Deck
k this deck
18
Factors of production are resources used in the consumption of goods and services.
Unlock Deck
Unlock for access to all 166 flashcards in this deck.
Unlock Deck
k this deck
19
Capital is a good used in the production of goods that households consume.
Unlock Deck
Unlock for access to all 166 flashcards in this deck.
Unlock Deck
k this deck
20
The production possibilities curve shows the different combinations of goods that can be produced with a set of given resources.
Unlock Deck
Unlock for access to all 166 flashcards in this deck.
Unlock Deck
k this deck
21
The law of increasing costs states that the opportunity cost of producing a good increases as more of the good is produced.
Unlock Deck
Unlock for access to all 166 flashcards in this deck.
Unlock Deck
k this deck
22
The production possibilities curve shifts to the left when resources in the economy increase.
Unlock Deck
Unlock for access to all 166 flashcards in this deck.
Unlock Deck
k this deck
23
Any point inside a production possibilities curve indicates that the economy is using all its available resources and technology.
Unlock Deck
Unlock for access to all 166 flashcards in this deck.
Unlock Deck
k this deck
24
If resources are underemployed, then the economy is producing as much as possible.
Unlock Deck
Unlock for access to all 166 flashcards in this deck.
Unlock Deck
k this deck
25
An economy is producing efficiently when all factors of production are used in their most productive capacity.
Unlock Deck
Unlock for access to all 166 flashcards in this deck.
Unlock Deck
k this deck
26
If Belgium has a comparative advantage over France in the production of beer, then it can produce beer at a lower opportunity cost than France.
Unlock Deck
Unlock for access to all 166 flashcards in this deck.
Unlock Deck
k this deck
27
The United States has an absolute advantage over Mexico in the production of corn when it can produce corn using fewer resources than Mexico.
Unlock Deck
Unlock for access to all 166 flashcards in this deck.
Unlock Deck
k this deck
28
Exhibit B-1 below shows the quantity of thing-a-ma-jigs or truffala fruit that can be produced by each country, if all of its resources are devoted to that product.
-In Exhibit B-1 Barbootland has an absolute advantage in the production of kiwi fruit.
-In Exhibit B-1 Barbootland has an absolute advantage in the production of kiwi fruit.
Unlock Deck
Unlock for access to all 166 flashcards in this deck.
Unlock Deck
k this deck
29
Exhibit B-1 below shows the quantity of thing-a-ma-jigs or truffala fruit that can be produced by each country, if all of its resources are devoted to that product.
-Referring to Exhibit B-1, Barbootland has a comparative advantage in the production of coconuts.
-Referring to Exhibit B-1, Barbootland has a comparative advantage in the production of coconuts.
Unlock Deck
Unlock for access to all 166 flashcards in this deck.
Unlock Deck
k this deck
30
Exhibit B-1 below shows the quantity of thing-a-ma-jigs or truffala fruit that can be produced by each country, if all of its resources are devoted to that product.
-In Exhibit B-1 Canary Island has a comparative advantage in the production of coconuts.
-In Exhibit B-1 Canary Island has a comparative advantage in the production of coconuts.
Unlock Deck
Unlock for access to all 166 flashcards in this deck.
Unlock Deck
k this deck
31
Exhibit B-1 below shows the quantity of thing-a-ma-jigs or truffala fruit that can be produced by each country, if all of its resources are devoted to that product.
-Referring to Exhibit B-1, Canary Island has an absolute advantage in the production of both coconuts and kiwi fruit.
-Referring to Exhibit B-1, Canary Island has an absolute advantage in the production of both coconuts and kiwi fruit.
Unlock Deck
Unlock for access to all 166 flashcards in this deck.
Unlock Deck
k this deck
32
Exhibit B-1 below shows the quantity of thing-a-ma-jigs or truffala fruit that can be produced by each country, if all of its resources are devoted to that product.
-Canary Island, in Exhibit B-1, does not have a comparative advantage in the production of either product.
-Canary Island, in Exhibit B-1, does not have a comparative advantage in the production of either product.
Unlock Deck
Unlock for access to all 166 flashcards in this deck.
Unlock Deck
k this deck
33
Exhibit B-1 below shows the quantity of thing-a-ma-jigs or truffala fruit that can be produced by each country, if all of its resources are devoted to that product.
-Trade is possible because Canary Island's opportunity cost of coconuts is less than Barbootland's.
-Trade is possible because Canary Island's opportunity cost of coconuts is less than Barbootland's.
Unlock Deck
Unlock for access to all 166 flashcards in this deck.
Unlock Deck
k this deck
34
Exhibit B-1 below shows the quantity of thing-a-ma-jigs or truffala fruit that can be produced by each country, if all of its resources are devoted to that product.
-Trade is not possible because Barbootland has an absolute advantage in the production of both goods.
-Trade is not possible because Barbootland has an absolute advantage in the production of both goods.
Unlock Deck
Unlock for access to all 166 flashcards in this deck.
Unlock Deck
k this deck
35
Exhibit B-1 below shows the quantity of thing-a-ma-jigs or truffala fruit that can be produced by each country, if all of its resources are devoted to that product.
-Referring to the information in Exhibit B-1, the opportunity cost of one kiwi fruit is
A) 50 coconuts
B) ½ coconuts
C) 2 coconuts
D) 25 coconuts
E) 2.5
-Referring to the information in Exhibit B-1, the opportunity cost of one kiwi fruit is
A) 50 coconuts
B) ½ coconuts
C) 2 coconuts
D) 25 coconuts
E) 2.5
Unlock Deck
Unlock for access to all 166 flashcards in this deck.
Unlock Deck
k this deck
36
Exhibit B-1 below shows the quantity of thing-a-ma-jigs or truffala fruit that can be produced by each country, if all of its resources are devoted to that product.
-Canary Island's opportunity cost (examine Exhibit B-1) of coconuts is equal to
A) 10 kiwi fruit
B) 40 coconuts
C) 4 kiwi fruit
D) ¼ kiwi fruit
E) 4/5 kiwi fruit
-Canary Island's opportunity cost (examine Exhibit B-1) of coconuts is equal to
A) 10 kiwi fruit
B) 40 coconuts
C) 4 kiwi fruit
D) ¼ kiwi fruit
E) 4/5 kiwi fruit
Unlock Deck
Unlock for access to all 166 flashcards in this deck.
Unlock Deck
k this deck
37
Exhibit B-1 below shows the quantity of thing-a-ma-jigs or truffala fruit that can be produced by each country, if all of its resources are devoted to that product.
-Given the data in Exhibit B-1
A) Canary Island should produce coconuts and trade with Barbootland for kiwi fruit.
B) Canary Island should produce kiwi fruit and trade with Barbootland for coconuts.
C) Barbootland should produce coconuts and trade with Canary Island for kiwi fruit.
D) trade is not possible because Barbootland does not have a comparative advantage in producing either good.
E) trade is not possible because Barbootland has an absolute advantage in production of both goods.
Unlock Deck
Unlock for access to all 166 flashcards in this deck.
Unlock Deck
k this deck
38
-Starting from point B in Exhibit B-2 (on the next page), the opportunity cost of 4 more swimming helmets is
A) 20 nose bands
B) 5 nose bands
C) 15 nose bands
D) 3.75 nose bands
E) indeterminate
Unlock Deck
Unlock for access to all 166 flashcards in this deck.
Unlock Deck
k this deck
39
-As we move from point A to B, to C, and finally to D in Exhibit B-2, the Law of Increasing Cost is reflected by the fact that the opportunity cost of swimming helmets
A) increases
B) decreases
C) remains constant
D) changes sporadically
E) is indeterminate
Unlock Deck
Unlock for access to all 166 flashcards in this deck.
Unlock Deck
k this deck
40
-Moving from point A to point B in Exhibit B-2 the opportunity cost of 1 swimming helmet is
A) 1 nose band
B) 2 nose bands
C) 4 nose bands
D) 5 nose bands
E) 8 nose bands
Unlock Deck
Unlock for access to all 166 flashcards in this deck.
Unlock Deck
k this deck
41
In addition to the items one must give up in order to afford the cost of cigarettes, the opportunity cost of smoking includes
A) your enjoyment from smoking
B) the health effects one places upon others
C) your expected health effects and shortened life span
D) harassment from nonsmokers
E) smoking cessation advertising on television
A) your enjoyment from smoking
B) the health effects one places upon others
C) your expected health effects and shortened life span
D) harassment from nonsmokers
E) smoking cessation advertising on television
Unlock Deck
Unlock for access to all 166 flashcards in this deck.
Unlock Deck
k this deck
42
Susan Sneed gave up her $55,000 job at ACC, Inc. to return to college to change careers. She reduced her wardrobe to cheaper jeans and t-shirts, paid $5,000 in tuition, continued to make her family's $1,200 per month home mortgage payments, and bore the burden of a variety of inane comments about the stupidity of older students giving up good paying jobs to return to school. Which of the above items is not needed to determine the opportunity cost of her return to college?
A) her $55,000 ACC, Inc. salary
B) the altered wardrobe costs
C) the $5,000 tuition expense
D) her family's $1,200 per month mortgage expense
E) psychological stress from inane comments
A) her $55,000 ACC, Inc. salary
B) the altered wardrobe costs
C) the $5,000 tuition expense
D) her family's $1,200 per month mortgage expense
E) psychological stress from inane comments
Unlock Deck
Unlock for access to all 166 flashcards in this deck.
Unlock Deck
k this deck
43
Factors of production is another name for
A) the goods produced in a production possibilities table
B) the goods not produced in a production possibilities table
C) the goods produced in international trade
D) resources
E) money
A) the goods produced in a production possibilities table
B) the goods not produced in a production possibilities table
C) the goods produced in international trade
D) resources
E) money
Unlock Deck
Unlock for access to all 166 flashcards in this deck.
Unlock Deck
k this deck
44
Labor resources include
A) only physical exertion
B) only the resources used in the production of other resources
C) only skilled labor
D) both physical and mental exertion
E) the expenditure of people's effort in producing goods, but not services
A) only physical exertion
B) only the resources used in the production of other resources
C) only skilled labor
D) both physical and mental exertion
E) the expenditure of people's effort in producing goods, but not services
Unlock Deck
Unlock for access to all 166 flashcards in this deck.
Unlock Deck
k this deck
45
The two human factors of production are
A) labor and mental exertion
B) labor and entrepreneurship
C) entrepreneurship and physical exertion
D) labor and physical exertion
E) entrepreneurship and mental exertion
A) labor and mental exertion
B) labor and entrepreneurship
C) entrepreneurship and physical exertion
D) labor and physical exertion
E) entrepreneurship and mental exertion
Unlock Deck
Unlock for access to all 166 flashcards in this deck.
Unlock Deck
k this deck
46
Which of the following is a capital resource?
A) a new car bought by the Jones family
B) a truck used in transporting school children to a soccer practice
C) a truck used in transporting steel to an automobile factory
D) hamburger meat used to produce a juicy hamburger on a home grill
E) a sapling used to create a forest in a new national park
A) a new car bought by the Jones family
B) a truck used in transporting school children to a soccer practice
C) a truck used in transporting steel to an automobile factory
D) hamburger meat used to produce a juicy hamburger on a home grill
E) a sapling used to create a forest in a new national park
Unlock Deck
Unlock for access to all 166 flashcards in this deck.
Unlock Deck
k this deck
47
Which of the following is associated with the creation of human capital?
A) a farmer buys more land
B) a robot replaces a worker
C) a worker replaces a robot
D) a worker spends less time on the job
E) a worker attends training classes
A) a farmer buys more land
B) a robot replaces a worker
C) a worker replaces a robot
D) a worker spends less time on the job
E) a worker attends training classes
Unlock Deck
Unlock for access to all 166 flashcards in this deck.
Unlock Deck
k this deck
48
Factors of production do not include
A) land
B) labor
C) money
D) capital
E) entrepreneurship
A) land
B) labor
C) money
D) capital
E) entrepreneurship
Unlock Deck
Unlock for access to all 166 flashcards in this deck.
Unlock Deck
k this deck
49
A good example of land resources is
A) a steel billboard on an interstate highway
B) water
C) wood-based furniture
D) machinery made from iron ore
E) buildings located on prime real estate
A) a steel billboard on an interstate highway
B) water
C) wood-based furniture
D) machinery made from iron ore
E) buildings located on prime real estate
Unlock Deck
Unlock for access to all 166 flashcards in this deck.
Unlock Deck
k this deck
50
The entrepreneur
A) serves as a liaison between management and labor
B) owns all of the factors of production
C) allocates the risk and uncertainties of enterprise to others
D) assumes the risk and uncertainties of enterprise
E) earns more than labor
A) serves as a liaison between management and labor
B) owns all of the factors of production
C) allocates the risk and uncertainties of enterprise to others
D) assumes the risk and uncertainties of enterprise
E) earns more than labor
Unlock Deck
Unlock for access to all 166 flashcards in this deck.
Unlock Deck
k this deck
51
The activity involved in managing a firm is considered by economists to be
A) land activity
B) labor activity
C) human capital activity
D) entrepreneurial activity
E) nonproductive activity
A) land activity
B) labor activity
C) human capital activity
D) entrepreneurial activity
E) nonproductive activity
Unlock Deck
Unlock for access to all 166 flashcards in this deck.
Unlock Deck
k this deck
52
-Exhibit B-3 shows an economy's production possibilities table. If it chooses the combination of goods at point A,
A) not all the available resources are being used
B) all resources are used in the production of capital goods
C) no consumption goods are being produced
D) every resource in the economy is being used in the production of consumption goods
E) no capital goods are being used as factors of production
Unlock Deck
Unlock for access to all 166 flashcards in this deck.
Unlock Deck
k this deck
53
-Exhibit B-3 shows an economy's production possibilities table. As additional units of capital goods are produced, the quantity of consumption goods produced _________,because _____________.
A) increases; the production possibilities table shows only the maximum efficiency points
B) increases; of the law of increasing costs
C) decreases; of the law of increasing costs
D) decreases; there is a limited supply of resources
E) increases; capital goods are used to produce consumption goods
Unlock Deck
Unlock for access to all 166 flashcards in this deck.
Unlock Deck
k this deck
54
-Exhibit B-3 shows an economy's production possibilities table. As additional units of capital goods are produced, the opportunity cost in terms of sacrificed units ofconsumption goods ________ because of __________.
A) decreases; greater efficiency in production
B) increases; decreasing opportunity cost
C) increases; the law of increasing costs
D) increases; greater efficiency in production
E) decreases; the law of increasing costs
Unlock Deck
Unlock for access to all 166 flashcards in this deck.
Unlock Deck
k this deck
55
The opportunity cost of going to a movie is
A) the price of the movie
B) number of hours you spend watching the movie
C) expected gains you experience by watching the movie
D) the next best alternative that must be sacrificed in order to go to the movie
E) expected gains minus the expected cost of the movie
A) the price of the movie
B) number of hours you spend watching the movie
C) expected gains you experience by watching the movie
D) the next best alternative that must be sacrificed in order to go to the movie
E) expected gains minus the expected cost of the movie
Unlock Deck
Unlock for access to all 166 flashcards in this deck.
Unlock Deck
k this deck
56
-In Exhibit B-4, which of the following could have caused the production possibilities curve to shift from curve A to curve B?
A) a major natural disaster
B) an increase in consumption goods production this year
C) the use of newer and more productive technology
D) a decrease in unemployment
E) a decrease in consumption goods production this year
Unlock Deck
Unlock for access to all 166 flashcards in this deck.
Unlock Deck
k this deck
57
-In Exhibit B-4, which of the following could have caused the production possibilities curve to shift from curve B to curve A?
A) a major natural disaster
B) an increase in resources
C) the use of newer and more productive technology
D) a decrease in unemployment
E) an improvement in literacy
Unlock Deck
Unlock for access to all 166 flashcards in this deck.
Unlock Deck
k this deck
58
Which of the following describes the vicious circle of poverty?
A) Because resources are limited, all economies eventually become poor.
B) In the long run, economies cycle between being rich and being poor.
C) For an economy to grow requires more consumption goods, which requires less capital goods, which means it will eventually become poor.
D) Due to excessive consumption, rich economies will destroy their resource base and eventually become poor.
E) Poor economies are poor because they do not produce sufficient capital goods, and without the production of sufficient capital goods, they remain poor.
Unlock Deck
Unlock for access to all 166 flashcards in this deck.
Unlock Deck
k this deck
59
-In year 2003 the country of Exhibit B-6 was located at point A on its year 2003 production possibilities curve. In 2004 this country was located at point B on its 2004 production possibilities curve. Which of the following could have caused this shift in its production possibilities curve?
A) more efficient production in 2003
B) greater use of resources in 2003
C) a natural disaster in 2003 which led to a destruction of resources
D) higher unemployment in 2003
E) the production of capital goods in 2003 increased its resource base for 2004
Unlock Deck
Unlock for access to all 166 flashcards in this deck.
Unlock Deck
k this deck
60
-In year 2003- the country of Exhibit B-6 was located at point A on its year 2003 production possibilities curve. In 2004 this country was located at point B on its 2004 production possibilities curve. This country
A) is producing the same quantity of capital goods in both years
B) is producing the same quantity of consumption goods in both years
C) had no economic growth between 2003 and 2004
D) had higher unemployment in 2003 than in 2004
E) had higher unemployment in 2004 than in 2003
Unlock Deck
Unlock for access to all 166 flashcards in this deck.
Unlock Deck
k this deck
61
-In year 2003 the country of Exhibit B-6 was located at point A on its year 2003 production possibilities curve. In 2004 this country was located at point B on its 2004 production possibilities curve. This economy
A) produces less of both goods in 2004 than in 2003
B) produces less of capital goods in 2004 than in 2003
C) is more efficient in 2004 than in 2003
D) experienced economic growth since 2003
E) had higher unemployment in 2004 than in 2003
Unlock Deck
Unlock for access to all 166 flashcards in this deck.
Unlock Deck
k this deck
62
-Exhibit B-7 shows the production possibilities curves for a country for the years 2003and 2004. Suppose the country was located at point A in 2003 and point B in 2004. This economy
A) experienced a loss of resources in 2004
B) had lower unemployment in 2004 than in 2003
C) achieved full employment in 2003 and in 2004
D) is less efficient in 2004 than in 2003
E) produced fewer goods in 2004 than in 2003
Unlock Deck
Unlock for access to all 166 flashcards in this deck.
Unlock Deck
k this deck
63
-Exhibit B-7 shows the production possibilities curves for a country for the years 2003 and 2004. Which of the following could have caused this shift in the production possibility curves?
A) a decrease in unemployment
B) a decline in technology
C) an increase in the quantity of capital goods used as a resource
D) a natural disaster
E) more efficient production
Unlock Deck
Unlock for access to all 166 flashcards in this deck.
Unlock Deck
k this deck
64
Which of the following could have caused this shift in the production possibilitycurves?
A) a decrease in unemployment
B) a decline in technology
C) an increase in the quantity of capital goods used as a resource
D) a natural disaster
E) more efficient production
A) a decrease in unemployment
B) a decline in technology
C) an increase in the quantity of capital goods used as a resource
D) a natural disaster
E) more efficient production
Unlock Deck
Unlock for access to all 166 flashcards in this deck.
Unlock Deck
k this deck
65
-Exhibit B-8 (on the previous page) shows an economy located at point A, within its production possibilities curve. Which of the following statements is false?
A) This economy could produce more of both capital and consumption goods.
B) This economy is experiencing full employment.
C) This economy could produce more capital goods without decreasing the quantity of consumption goods produced.
D) This economy could produce more consumption goods without decreasing the quantity of capital goods produced.
E) Not every resource in this economy is being utilized.
Unlock Deck
Unlock for access to all 166 flashcards in this deck.
Unlock Deck
k this deck
66
Which of the following changes would not lead to a shift in Canada's production possibilities curve?
A) the introduction and use in Canada of more advanced technology
B) a substantial emigration of Canadian workers to the U.S.
C) a prolonged summer drought in Canada's Prairie Provinces that destroys 18% ofCanada's wheat harvest
D) a sharp increase in the number of Canadians earning advanced degrees in education, e.g., BA's, BS's, MD's and PhD's
E) a change in the composition of Canada's output
Unlock Deck
Unlock for access to all 166 flashcards in this deck.
Unlock Deck
k this deck
67
If a resource is underemployed, it
A) is being used in production, but not in its most productive use
B) is essentially unemployed
C) is not considered a productive resource
D) cannot be used as a factor of production
E) must be a labor resource
A) is being used in production, but not in its most productive use
B) is essentially unemployed
C) is not considered a productive resource
D) cannot be used as a factor of production
E) must be a labor resource
Unlock Deck
Unlock for access to all 166 flashcards in this deck.
Unlock Deck
k this deck
68
An example of an underemployed resource is a(n)
A) farmer in Illinois who plants corn instead of wheat
B) auto mechanic who is laid off from his job
C) welfare recipient who doesn't work
D) retired senior citizen who doesn't work
E) person with a Ph.D. in chemistry who drives a taxi as a full-time job
A) farmer in Illinois who plants corn instead of wheat
B) auto mechanic who is laid off from his job
C) welfare recipient who doesn't work
D) retired senior citizen who doesn't work
E) person with a Ph.D. in chemistry who drives a taxi as a full-time job
Unlock Deck
Unlock for access to all 166 flashcards in this deck.
Unlock Deck
k this deck
69
If a resource is unemployed, it
A) is also underemployed
B) is utilized, but not in its most productive employment
C) is not utilized
D) is not counted as a resource for the economy
E) must be a labor resource
A) is also underemployed
B) is utilized, but not in its most productive employment
C) is not utilized
D) is not counted as a resource for the economy
E) must be a labor resource
Unlock Deck
Unlock for access to all 166 flashcards in this deck.
Unlock Deck
k this deck
70
Which of the following would be an example of an unemployed resource?
A) John has been laid off from his job as an auto mechanic.
B) Betty, a computer specialist, takes a job as a hotel maid.
C) Mary, a senior citizen, receives a social security check.
D) Sam, 10 years old, is in the fifth grade.
E) a 10-year-old computer is now only used as a word processor.
A) John has been laid off from his job as an auto mechanic.
B) Betty, a computer specialist, takes a job as a hotel maid.
C) Mary, a senior citizen, receives a social security check.
D) Sam, 10 years old, is in the fifth grade.
E) a 10-year-old computer is now only used as a word processor.
Unlock Deck
Unlock for access to all 166 flashcards in this deck.
Unlock Deck
k this deck
71
Consider a two-goods (capital and consumption) production possibilities curve for the year 2004. Which of the following pairs are assumed fixed in this scenario?
A) unemployment and capital goods production in the year 2004
B) number of resources and consumption goods production in the year 2004
C) composition of the economy's output and number of resources in the year 2004
D) capital and consumption goods production in the year 2004
E) technology and number of resources in the year 2004
Unlock Deck
Unlock for access to all 166 flashcards in this deck.
Unlock Deck
k this deck
72
-In Exhibit B-9, if the economy decides to locate at point E,
A) this is its best choice because it is producing maximum capital goods
B) this is its best choice because it is producing maximum consumption goods
C) it has not achieved full employment
D) it could not sustain itself in the long run because its people will have no consumption goods (presumably, this includes food)
E) the economy has not achieved maximum efficiency
Unlock Deck
Unlock for access to all 166 flashcards in this deck.
Unlock Deck
k this deck
73
-If the economy of Exhibit B-10 was located at point E but has moved to point F, we would know that
A) it was impossible because it hasn't sufficient resources to make that move
B) the rate of unemployment increased
C) consumption goods production increased, but capital goods production decreased
D) its unemployment decreased, but at the expense of either capital or consumption goods production
E) it has achieved full employment
Unlock Deck
Unlock for access to all 166 flashcards in this deck.
Unlock Deck
k this deck
74
-If the economy of Exhibit B-10 was located at point E but has moved to point F, which of the following could have caused this movement?
A) an advance in technology
B) an increase in the quantity of resources
C) an increase in human capital, e.g., higher levels of education
D) the productive use of previously unemployed resources
E) an increase in unemployment
Unlock Deck
Unlock for access to all 166 flashcards in this deck.
Unlock Deck
k this deck
75
Economic efficiency is defined in the text as
A) the maximum production of consumption goods
B) the maximum production of capital goods
C) a balanced production of consumption and capital goods
D) a maximum set of resources
E) the absence of underemployment or unemployment
A) the maximum production of consumption goods
B) the maximum production of capital goods
C) a balanced production of consumption and capital goods
D) a maximum set of resources
E) the absence of underemployment or unemployment
Unlock Deck
Unlock for access to all 166 flashcards in this deck.
Unlock Deck
k this deck
76
Specialization refers to
A) one person performing a wide variety of tasks
B) labor replacing capital in production
C) capital replacing labor in production
D) limiting the number of tasks a resource performs
E) performing all tasks with only one resource
A) one person performing a wide variety of tasks
B) labor replacing capital in production
C) capital replacing labor in production
D) limiting the number of tasks a resource performs
E) performing all tasks with only one resource
Unlock Deck
Unlock for access to all 166 flashcards in this deck.
Unlock Deck
k this deck
77
Specialization leads to
A) increases in production because labor uses more advanced technology
B) decreases in production because each resource becomes less productive
C) increases in production because more resources are being used
D) increases in production because each resource becomes more productive
E) increases in production because capital is more productive than labor
Unlock Deck
Unlock for access to all 166 flashcards in this deck.
Unlock Deck
k this deck
78
Specialization of labor refers to the
A) use of more skilled versus unskilled labor
B) division of labor
C) opportunity costs of using labor
D) law of increasing costs associated with labor
E) comparative advantage of labor-using economies
A) use of more skilled versus unskilled labor
B) division of labor
C) opportunity costs of using labor
D) law of increasing costs associated with labor
E) comparative advantage of labor-using economies
Unlock Deck
Unlock for access to all 166 flashcards in this deck.
Unlock Deck
k this deck
79
-Suppose Xenia and Zava produce only bread and coffee with their production possibilities schedule shown in Exhibit B-11. Which statement is true?
A) Zava has an absolute advantage in the production of both bread and coffee.
B) Zava has an absolute advantage only in the production of bread.
C) Xenia has an absolute advantage only in the production of bread.
D) Xenia has an absolute advantage only in the production of coffee.
E) Xenia has an absolute advantage in the production of both products.
Unlock Deck
Unlock for access to all 166 flashcards in this deck.
Unlock Deck
k this deck
80
-Given the production possibilities schedule in Exhibit B-11 for Xenia, one coffee costs _________.
A) 1.5 bread
B) 3.0 bread
C) 0.5 bread
D) 2.0 bread
E) 2.5 bread
Unlock Deck
Unlock for access to all 166 flashcards in this deck.
Unlock Deck
k this deck
Unlock Deck
Unlock for access to all 166 flashcards in this deck.


