Deck 7: Correlation
Full screen (f)
Question
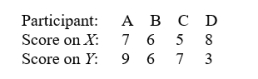
Four participants obtained the following scores on two measures. Compute r.
Question
-Calculate Spearman's

for the data in Problem 1.
Question
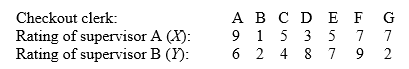
Two supervisors independently rate the performance of the same seven checkout clerks in a supermarket. Compute r.
Question
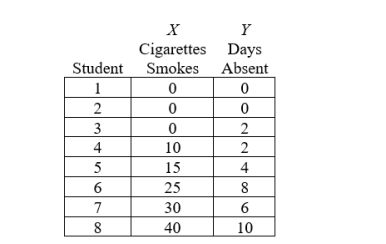
Dr. Jones wants to determine if there is any relationship between cigarette smoking and number of lectures missed due to illness in her graduate statistics course. She determines the number of cigarettes smoked per day and the number of classes missed for eight graduate students. The results are as follows: Calculate Pearson's r and construct a scatter diagram.
Question
Question
To study the phenomenon of creativity, a number of outstandingly creative persons are assembled and tested. It is found that rating on creativity and IQ correlate to the extent of

among this group. Does this necessarily indicate that creativity and intelligence have little to do with each other? Explain.
among this group. Does this necessarily indicate that creativity and intelligence have little to do with each other? Explain.
Question
Question
Question
Question
Question
Question
Question
Question
Question
Question
Question
To learn how well we can predict Y from knowledge of X, we calculate r and find  From this, we know that
A) high values of X are predictive of low values of Y
B) high values of X are predictive of high values of Y
C) the mean of X is higher than the mean of Y
D) we have made a mistake in calculation
From this, we know thatA) high values of X are predictive of low values of Y
B) high values of X are predictive of high values of Y
C) the mean of X is higher than the mean of Y
D) we have made a mistake in calculation
Question
Question
In the formula / nSXSY, the quantity that determines whether r will be negative or positive is
A) n
B)
C)
D) the combination of all these values
A) n
B)
C)
D) the combination of all these values
Question
Question
Question
Question
Question
Question
Question
Question
One hundred subjects are classified according to their standing in X and Y. The classification looks like this: 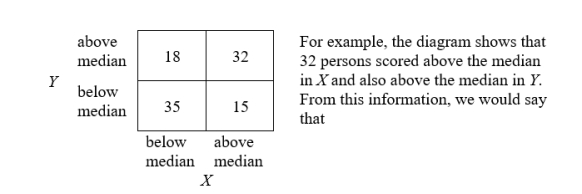
A) r is large and positive
B) r is moderate and positive
C) r is zero
D) r is negative
A) r is large and positive
B) r is moderate and positive
C) r is zero
D) r is negative
Question
Question
Question
Random sampling variation among values of r is greatest when
A) the units of measurement are large
B)
are large
C) n is small
D) the relationship is nonlinear
A) the units of measurement are large
B)
are large
C) n is small
D) the relationship is nonlinear
Question
Question
Question
Question
Question
Question
Question
Question

Unlock Deck
Sign up to unlock the cards in this deck!
Unlock Deck
Unlock Deck
1/38
Play
Full screen (f)
Deck 7: Correlation
1
Four participants obtained the following scores on two measures. Compute r.

2
-Calculate Spearman's
for the data in Problem 1.
-.50 (the difference is due to rounding).
3
Two supervisors independently rate the performance of the same seven checkout clerks in a supermarket. Compute r.

4
Dr. Jones wants to determine if there is any relationship between cigarette smoking and number of lectures missed due to illness in her graduate statistics course. She determines the number of cigarettes smoked per day and the number of classes missed for eight graduate students. The results are as follows: Calculate Pearson's r and construct a scatter diagram.
Unlock Deck
Unlock for access to all 38 flashcards in this deck.
Unlock Deck
k this deck
5
Does a low r between two variables necessarily indicate there is very little association? Explain.
Unlock Deck
Unlock for access to all 38 flashcards in this deck.
Unlock Deck
k this deck
6
To study the phenomenon of creativity, a number of outstandingly creative persons are assembled and tested. It is found that rating on creativity and IQ correlate to the extent of
among this group. Does this necessarily indicate that creativity and intelligence have little to do with each other? Explain.
among this group. Does this necessarily indicate that creativity and intelligence have little to do with each other? Explain.
Unlock Deck
Unlock for access to all 38 flashcards in this deck.
Unlock Deck
k this deck
7
It is common to find that the correlation between airplane pilot aptitude test score and pilot proficiency is higher among aviation cadets than among experienced pilots. What could account for this?
Unlock Deck
Unlock for access to all 38 flashcards in this deck.
Unlock Deck
k this deck
8
The human resources director for Company A often has lunch with the human resources director for Company B. This noon, she mentions that they are having trouble selecting good assembly workers. Her friend replies that they have had great luck with Aptitude Test X, and that the correlation, established on 400 of their assembly workers is +.60 between test score and job performance. Have you any caution to offer Company A's director before she rushes out to adopt the test as a selective device?
Unlock Deck
Unlock for access to all 38 flashcards in this deck.
Unlock Deck
k this deck
9
In a scatter diagram, if the cluster of data points slopes from lower left to upper right, this indicates
A) a positive correlation
B) a negative correlation
C) zero correlation
D) a curvilinear relationship
A) a positive correlation
B) a negative correlation
C) zero correlation
D) a curvilinear relationship
Unlock Deck
Unlock for access to all 38 flashcards in this deck.
Unlock Deck
k this deck
10
In a scatter diagram, if one of the points does not fall on the straight line of best fit to all the points, r cannot be
A) 0
B) -1
C) positive
D) negative
A) 0
B) -1
C) positive
D) negative
Unlock Deck
Unlock for access to all 38 flashcards in this deck.
Unlock Deck
k this deck
11
In the "world of real data," we are least likely to find values of r that are
A) negative
B) very close to zero
C) very close to 1.00
D) either very close to zero or very close to 1.00
A) negative
B) very close to zero
C) very close to 1.00
D) either very close to zero or very close to 1.00
Unlock Deck
Unlock for access to all 38 flashcards in this deck.
Unlock Deck
k this deck
12
Which of the following would be most likely to show a negative correlation?
A) reaction time and skill as a driver
B) height and shoe size
C) hours studied and exam grade
D) weight of automobile and gas used per mile
A) reaction time and skill as a driver
B) height and shoe size
C) hours studied and exam grade
D) weight of automobile and gas used per mile
Unlock Deck
Unlock for access to all 38 flashcards in this deck.
Unlock Deck
k this deck
13
Which value of r indicates the strongest degree of relationship?
A) .87
B) .62
C) -.79
D) -.91
A) .87
B) .62
C) -.79
D) -.91
Unlock Deck
Unlock for access to all 38 flashcards in this deck.
Unlock Deck
k this deck
14
Which value of r indicates the least amount of relationship?
A) .08
B) -.12
C) -.85
D) -.98
A) .08
B) -.12
C) -.85
D) -.98
Unlock Deck
Unlock for access to all 38 flashcards in this deck.
Unlock Deck
k this deck
15
Fifty students have taken a 100-item true-false test. For each student, let X be the number of questions answered correctly and Y be the number not answered correctly. We would expect r to be
A) +1.00
B) zero
C) -1.00
D) between zero and -1.00
A) +1.00
B) zero
C) -1.00
D) between zero and -1.00
Unlock Deck
Unlock for access to all 38 flashcards in this deck.
Unlock Deck
k this deck
16
It is possible to compute a correlation coefficient if we have
A) a pair of scores for one individual
B) a set of scores for a group of individuals
C) two sets of scores for the same group of individuals
D) all of the above
A) a pair of scores for one individual
B) a set of scores for a group of individuals
C) two sets of scores for the same group of individuals
D) all of the above
Unlock Deck
Unlock for access to all 38 flashcards in this deck.
Unlock Deck
k this deck
17
To learn how well we can predict Y from knowledge of X, we calculate r and find From this, we know that
A) high values of X are predictive of low values of Y
B) high values of X are predictive of high values of Y
C) the mean of X is higher than the mean of Y
D) we have made a mistake in calculation
From this, we know thatA) high values of X are predictive of low values of Y
B) high values of X are predictive of high values of Y
C) the mean of X is higher than the mean of Y
D) we have made a mistake in calculation
Unlock Deck
Unlock for access to all 38 flashcards in this deck.
Unlock Deck
k this deck
18
To begin calculating r
A) the X scores should be put in order of magnitude
B) the X and Y scores should be put in order of magnitude
C) the pairs of X and Y scores may be in any order as long as the proper pairing is retained
D) any of the above procedures will be satisfactory
A) the X scores should be put in order of magnitude
B) the X and Y scores should be put in order of magnitude
C) the pairs of X and Y scores may be in any order as long as the proper pairing is retained
D) any of the above procedures will be satisfactory
Unlock Deck
Unlock for access to all 38 flashcards in this deck.
Unlock Deck
k this deck
19
In the formula / nSXSY, the quantity that determines whether r will be negative or positive is
A) n
B)
C)
D) the combination of all these values
A) n
B)
C)
D) the combination of all these values
Unlock Deck
Unlock for access to all 38 flashcards in this deck.
Unlock Deck
k this deck
20
The z score and deviation score formulas for r are useful for
A) computing r when scores are not grouped
B) computing r when n is large
C) understanding the nature of r
D) all of the above
A) computing r when scores are not grouped
B) computing r when n is large
C) understanding the nature of r
D) all of the above
Unlock Deck
Unlock for access to all 38 flashcards in this deck.
Unlock Deck
k this deck
21
A causal relationship between X and Y can be inferred
A) only on grounds that go beyond the simple showing of a degree of relationship
B) any time r is other than zero
C) only for positive values of r
D) only for values of r that are near 1.00
A) only on grounds that go beyond the simple showing of a degree of relationship
B) any time r is other than zero
C) only for positive values of r
D) only for values of r that are near 1.00
Unlock Deck
Unlock for access to all 38 flashcards in this deck.
Unlock Deck
k this deck
22
Fundamentally,
A) a degree of association between two variables signifies a causal relationship between them.
B) a causal relationship between two variables results in a degree of association between them.
C) both (a) and (b) are true
D) neither (a) nor (b) are true
A) a degree of association between two variables signifies a causal relationship between them.
B) a causal relationship between two variables results in a degree of association between them.
C) both (a) and (b) are true
D) neither (a) nor (b) are true
Unlock Deck
Unlock for access to all 38 flashcards in this deck.
Unlock Deck
k this deck
23
Which of the following explains why poor grades and poor attendance often go together?
A) poor grades might in part result in poor attendance
B) poor attendance might result in poor grades
C) a third factor may be responsible
D) all of the above might be true
A) poor grades might in part result in poor attendance
B) poor attendance might result in poor grades
C) a third factor may be responsible
D) all of the above might be true
Unlock Deck
Unlock for access to all 38 flashcards in this deck.
Unlock Deck
k this deck
24
Among a group of children, the correlation between test score in a science course and test score in an English course is +.45. It is learned that each test score is 5 points too high, so each raw score is corrected and r recomputed. We expect that its value will be
A) greater than +.45
B) less than +.45
C) changed in an unpredictable way
D) unchanged
A) greater than +.45
B) less than +.45
C) changed in an unpredictable way
D) unchanged
Unlock Deck
Unlock for access to all 38 flashcards in this deck.
Unlock Deck
k this deck
25
In a given group, the correlation between height measured in feet and weight measured in pounds is +.68. Which of the following would alter the value of r?
A) height is expressed in centimeters
B) weight is expressed in kilograms
C) neither of the above changes will affect r
D) both of the above changes will affect r
A) height is expressed in centimeters
B) weight is expressed in kilograms
C) neither of the above changes will affect r
D) both of the above changes will affect r
Unlock Deck
Unlock for access to all 38 flashcards in this deck.
Unlock Deck
k this deck
26
The value of r is computed from raw scores. Which is likely to change the value of r?
A) each X score is multiplied by -1
B) each X score is converted to its corresponding percentile rank
C) each X score is expressed as the number of incorrect answers rather than the number of correct answers
D) all of the above are likely to change the value of r
A) each X score is multiplied by -1
B) each X score is converted to its corresponding percentile rank
C) each X score is expressed as the number of incorrect answers rather than the number of correct answers
D) all of the above are likely to change the value of r
Unlock Deck
Unlock for access to all 38 flashcards in this deck.
Unlock Deck
k this deck
27
One hundred subjects are classified according to their standing in X and Y. The classification looks like this:
A) r is large and positive
B) r is moderate and positive
C) r is zero
D) r is negative
A) r is large and positive
B) r is moderate and positive
C) r is zero
D) r is negative
Unlock Deck
Unlock for access to all 38 flashcards in this deck.
Unlock Deck
k this deck
28
The name of Spearman is associated with a coefficient of correlation obtained when scores are
A) normally distributed
B) discrete variables
C) expressed as ranks
D) categorical
A) normally distributed
B) discrete variables
C) expressed as ranks
D) categorical
Unlock Deck
Unlock for access to all 38 flashcards in this deck.
Unlock Deck
k this deck
29
If Pearson r is calculated for data that are curvilinearly related, it will
A) properly reflect the degree of association
B) overestimate the degree of association
C) underestimate the degree of association
D) overestimate or underestimate the degree of association, depending on the circumstances
A) properly reflect the degree of association
B) overestimate the degree of association
C) underestimate the degree of association
D) overestimate or underestimate the degree of association, depending on the circumstances
Unlock Deck
Unlock for access to all 38 flashcards in this deck.
Unlock Deck
k this deck
30
Random sampling variation among values of r is greatest when
A) the units of measurement are large
B)
are large
C) n is small
D) the relationship is nonlinear
A) the units of measurement are large
B)
are large
C) n is small
D) the relationship is nonlinear
Unlock Deck
Unlock for access to all 38 flashcards in this deck.
Unlock Deck
k this deck
31
The Spearman rank-order correlation coefficient
A) is identical with Pearson r under all circumstances
B) is identical with Pearson r when both variables are in rank form and there are no ties in ranks
C) is identical with Pearson r when n is greater than 10
D) is never identical to Pearson r
A) is identical with Pearson r under all circumstances
B) is identical with Pearson r when both variables are in rank form and there are no ties in ranks
C) is identical with Pearson r when n is greater than 10
D) is never identical to Pearson r
Unlock Deck
Unlock for access to all 38 flashcards in this deck.
Unlock Deck
k this deck
32
The problem of range of talent suggests that when reporting a correlation coefficient, it is also important to report
A) the two means for the group studied
B) the two standard deviations for the group studied
C) a description of the subjects sampled
D) all of the above
A) the two means for the group studied
B) the two standard deviations for the group studied
C) a description of the subjects sampled
D) all of the above
Unlock Deck
Unlock for access to all 38 flashcards in this deck.
Unlock Deck
k this deck
33
Other things being equal, when the range of talent is reduced, r will
A) increase
B) decrease
C) remain the same
D) change in an unpredictable manner
A) increase
B) decrease
C) remain the same
D) change in an unpredictable manner
Unlock Deck
Unlock for access to all 38 flashcards in this deck.
Unlock Deck
k this deck
34
The correlation coefficient is obtained between academic aptitude test score and academic achievement (1) among students in general, and (2) among honor students. Other things being equal, we expect
A) the two coefficients to be about the same
B) the first to be higher
C) the second to be higher
D) one to be negative, the other positive
A) the two coefficients to be about the same
B) the first to be higher
C) the second to be higher
D) one to be negative, the other positive
Unlock Deck
Unlock for access to all 38 flashcards in this deck.
Unlock Deck
k this deck
35
A group of highly creative men and women are studied to determine the degree of relationship between creative ratings and IQ scores. For this group, we would expect the correlation to be
A) low
B) moderate
C) high
D) negative
A) low
B) moderate
C) high
D) negative
Unlock Deck
Unlock for access to all 38 flashcards in this deck.
Unlock Deck
k this deck
36
The r between job aptitude scores and job success ratings is computed to be +.29. Which of the following is the best guess as to the value for r had all, rather than just the best qualified applicants been hired?
A) +.29
B) +.41
C) +.17
D) there is insufficient information upon which to base an educated guess
A) +.29
B) +.41
C) +.17
D) there is insufficient information upon which to base an educated guess
Unlock Deck
Unlock for access to all 38 flashcards in this deck.
Unlock Deck
k this deck
37
The correlation between score on a test of job aptitude and a measure of job proficiency is +.50 among 100 employed workers. The 25 workers who scored lowest in job proficiency and the 25 who scored highest are separated from the remainder, combined in one group, and the correlation between the same two variables is recomputed. We should expect it to be
A) about the same as the first coefficient
B) higher than the first coefficient
C) lower than the first coefficient
D) different from the first coefficient, but we cannot predict whether higher or lower
A) about the same as the first coefficient
B) higher than the first coefficient
C) lower than the first coefficient
D) different from the first coefficient, but we cannot predict whether higher or lower
Unlock Deck
Unlock for access to all 38 flashcards in this deck.
Unlock Deck
k this deck
38
One teacher has a class composed entirely of girls; she finds that r between score on an English test and IQ is +.40 for her students. Another teacher has a class composed entirely of boys; she finds that r between score on an English test and IQ is +.55. Which of the following could not reasonably account for the discrepancy?
A) the relationship is different among boys and girls
B) one teacher calculated r by the raw score method and the other by the deviation score method
C) the tests of English were different tests
D) variation is expected among samples
A) the relationship is different among boys and girls
B) one teacher calculated r by the raw score method and the other by the deviation score method
C) the tests of English were different tests
D) variation is expected among samples
Unlock Deck
Unlock for access to all 38 flashcards in this deck.
Unlock Deck
k this deck
Unlock Deck
Unlock for access to all 38 flashcards in this deck.


