Deck 6: Inference for Means and Proportions
Full screen (f)
Question
Question
Question
Question
Question
Question
Question
Question
Question
Question
Question
Question
Question
Question
Question
Question
Question
Question
Question
Question
Question
Question
Question
Question
Question
Question
Question
Question
Question
Question
Question
Question
Question
Question
Question
Use the following
An Internet provider contacts a random sample of 300 customers and asks how many hours per week the customers use the Internet. The responses are summarized in the provided dotplot. The average amount of time spent on the Internet per week was 7.2 hours, with a standard deviation of 7.9 hours.
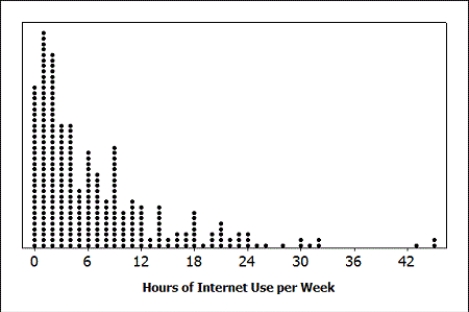
-Is it reasonable to use the t-distribution to construct a confidence interval for the average amount of time customers of this Internet provider spend on the Internet each week? Explain briefly.
An Internet provider contacts a random sample of 300 customers and asks how many hours per week the customers use the Internet. The responses are summarized in the provided dotplot. The average amount of time spent on the Internet per week was 7.2 hours, with a standard deviation of 7.9 hours.
-Is it reasonable to use the t-distribution to construct a confidence interval for the average amount of time customers of this Internet provider spend on the Internet each week? Explain briefly.
Question
Use the following
An Internet provider contacts a random sample of 300 customers and asks how many hours per week the customers use the Internet. The responses are summarized in the provided dotplot. The average amount of time spent on the Internet per week was 7.2 hours, with a standard deviation of 7.9 hours.
-Construct a 95% confidence interval for the average amount of time customers of this Internet provider spend on the Internet each week. Round the margin of error to one decimal place.
Question
Use the following
An Internet provider contacts a random sample of 300 customers and asks how many hours per week the customers use the Internet. The responses are summarized in the provided dotplot. The average amount of time spent on the Internet per week was 7.2 hours, with a standard deviation of 7.9 hours.
-Provide an interpretation of your interval in the context of this data situation.
Question
Use the following
An Internet provider contacts a random sample of 300 customers and asks how many hours per week the customers use the Internet. The responses are summarized in the provided dotplot. The average amount of time spent on the Internet per week was 7.2 hours, with a standard deviation of 7.9 hours.
-If we want a margin of error of 0.5 hours, how large of a sample would we need?
Question
Question
Question
Question
Question
Question
Question
Question
Question
Question
Question
Question
Question
Question
Question
Use the following
A dotplot and the summary statistics for a sample are provided. In each case, indicate whether or not it is appropriate to use the t-distribution.
-n = 12; = 4.75; s = 1.603
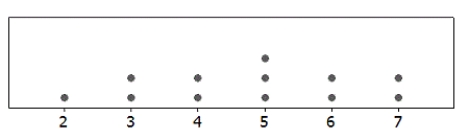
A) Appropriate
B) Not Appropriate
A dotplot and the summary statistics for a sample are provided. In each case, indicate whether or not it is appropriate to use the t-distribution.
-n = 12;
= 4.75; s = 1.603A) Appropriate
B) Not Appropriate
Question
Use the following
A dotplot and the summary statistics for a sample are provided. In each case, indicate whether or not it is appropriate to use the t-distribution.
-n = 10; = 7.80; s = 9.28
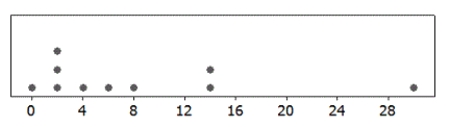
A) Appropriate
B) Not Appropriate
A dotplot and the summary statistics for a sample are provided. In each case, indicate whether or not it is appropriate to use the t-distribution.
-n = 10;
= 7.80; s = 9.28A) Appropriate
B) Not Appropriate
Question
Use the following
A dotplot and the summary statistics for a sample are provided. In each case, indicate whether or not it is appropriate to use the t-distribution.
-n = 100; = 9.93; s = 9.247
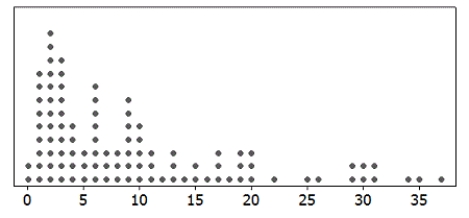
A) Appropriate
B) Not Appropriate
A dotplot and the summary statistics for a sample are provided. In each case, indicate whether or not it is appropriate to use the t-distribution.
-n = 100;
= 9.93; s = 9.247A) Appropriate
B) Not Appropriate
Question
Use the following
A dotplot and the summary statistics for a sample are provided. In each case, indicate whether or not it is appropriate to use the t-distribution.
-n = 15; = 44; s = 7.32
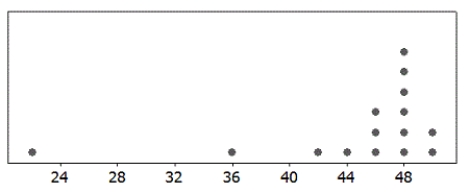
A) Appropriate
B) Not Appropriate
A dotplot and the summary statistics for a sample are provided. In each case, indicate whether or not it is appropriate to use the t-distribution.
-n = 15;
= 44; s = 7.32 A) Appropriate
B) Not Appropriate
Question
Use the following
November 6, 2012 was election day. Many of the major television networks aired coverage of the incoming election results during the primetime hours. The provided boxplot displays the amount of time (in minutes) spent watching election coverage for a random sample of 25 U.S. adults. In this sample, the average time spent watching election coverage was 80.44 minutes with standard deviation of 43.99 minutes.
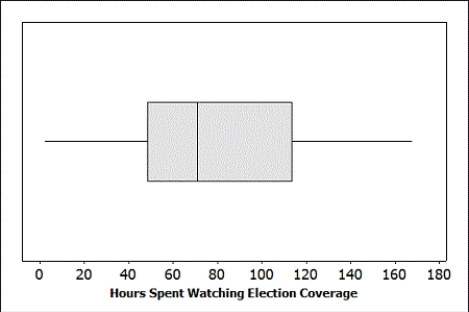
-Is it reasonable to use the t-distribution to construct a confidence interval for the average amount of time spent watching election coverage by U.S. adults? Explain briefly.
November 6, 2012 was election day. Many of the major television networks aired coverage of the incoming election results during the primetime hours. The provided boxplot displays the amount of time (in minutes) spent watching election coverage for a random sample of 25 U.S. adults. In this sample, the average time spent watching election coverage was 80.44 minutes with standard deviation of 43.99 minutes.
-Is it reasonable to use the t-distribution to construct a confidence interval for the average amount of time spent watching election coverage by U.S. adults? Explain briefly.
Question
Use the following
November 6, 2012 was election day. Many of the major television networks aired coverage of the incoming election results during the primetime hours. The provided boxplot displays the amount of time (in minutes) spent watching election coverage for a random sample of 25 U.S. adults. In this sample, the average time spent watching election coverage was 80.44 minutes with standard deviation of 43.99 minutes.
-Construct a 90% confidence interval for the average amount of time U.S. adults spent watching election coverage. Use two decimal places in your margin of error.
Question
Use the following
November 6, 2012 was election day. Many of the major television networks aired coverage of the incoming election results during the primetime hours. The provided boxplot displays the amount of time (in minutes) spent watching election coverage for a random sample of 25 U.S. adults. In this sample, the average time spent watching election coverage was 80.44 minutes with standard deviation of 43.99 minutes.
-Provide an interpretation of your interval in the context of this data situation.
Question
Use the following
November 6, 2012 was election day. Many of the major television networks aired coverage of the incoming election results during the primetime hours. The provided boxplot displays the amount of time (in minutes) spent watching election coverage for a random sample of 25 U.S. adults. In this sample, the average time spent watching election coverage was 80.44 minutes with standard deviation of 43.99 minutes.
-What sample size would we need to estimate the average amount of time U.S. adults watching election coverage with 99% confidence and a margin of error of 5 hours?
November 6, 2012 was election day. Many of the major television networks aired coverage of the incoming election results during the primetime hours. The provided boxplot displays the amount of time (in minutes) spent watching election coverage for a random sample of 25 U.S. adults. In this sample, the average time spent watching election coverage was 80.44 minutes with standard deviation of 43.99 minutes.
-What sample size would we need to estimate the average amount of time U.S. adults watching election coverage with 99% confidence and a margin of error of
5 hours? Question
Use the following
Turkey is a staple at most traditional Thanksgiving dinners. A random sample of 12 grocery store customers were asked about the size of the turkey they were purchasing for Thanksgiving. The average weight was 13.9 pounds with a standard deviation of 2.2 pounds. The boxplot displays the distribution of the sample turkey weights.
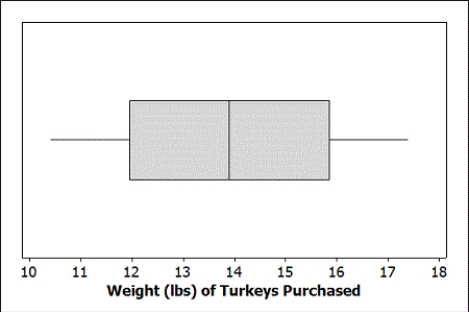
-Is is reasonable to use the t-distribution to construct a confidence interval for the average weight of turkeys purchased at this store? Explain briefly.
Turkey is a staple at most traditional Thanksgiving dinners. A random sample of 12 grocery store customers were asked about the size of the turkey they were purchasing for Thanksgiving. The average weight was 13.9 pounds with a standard deviation of 2.2 pounds. The boxplot displays the distribution of the sample turkey weights.
-Is is reasonable to use the t-distribution to construct a confidence interval for the average weight of turkeys purchased at this store? Explain briefly.
Question
Use the following
Turkey is a staple at most traditional Thanksgiving dinners. A random sample of 12 grocery store customers were asked about the size of the turkey they were purchasing for Thanksgiving. The average weight was 13.9 pounds with a standard deviation of 2.2 pounds. The boxplot displays the distribution of the sample turkey weights.
-Construct a 99% confidence interval for the average weight of turkeys purchased at this store. Round your margin of error to two decimal places.
Question
Use the following
Turkey is a staple at most traditional Thanksgiving dinners. A random sample of 12 grocery store customers were asked about the size of the turkey they were purchasing for Thanksgiving. The average weight was 13.9 pounds with a standard deviation of 2.2 pounds. The boxplot displays the distribution of the sample turkey weights.
-Provide an interpretation of your interval in the context of this data situation.
Question
Use the following
Turkey is a staple at most traditional Thanksgiving dinners. A random sample of 12 grocery store customers were asked about the size of the turkey they were purchasing for Thanksgiving. The average weight was 13.9 pounds with a standard deviation of 2.2 pounds. The boxplot displays the distribution of the sample turkey weights.
-What sample size would we need to reduce the margin of error to 1 pound?
Turkey is a staple at most traditional Thanksgiving dinners. A random sample of 12 grocery store customers were asked about the size of the turkey they were purchasing for Thanksgiving. The average weight was 13.9 pounds with a standard deviation of 2.2 pounds. The boxplot displays the distribution of the sample turkey weights.
-What sample size would we need to reduce the margin of error to
1 pound? Question
Use the following
Turkey is a staple at most traditional Thanksgiving dinners. A random sample of 12 grocery store customers were asked about the size of the turkey they were purchasing for Thanksgiving. The average weight was 13.9 pounds with a standard deviation of 2.2 pounds. The boxplot displays the distribution of the sample turkey weights.
-According to the Minnesota Turkey Growers Association's website, the average weight of turkeys purchased for Thanksgiving dinner is 15 pounds. Test, at the 5% level, if this sample provides evidence that the average weight of turkeys purchased at this store differs from 15 pounds. Include all of the details of the test.
Question
Question
Question
Question
Use the following
Every year since the 1957-58 academic year, the National Science Foundation (NSF) conducts its Survey of Earned Doctorates (SED) of all individuals receiving research doctoral degrees from accredited U.S. institutions. The results from the 2010 survey published on the NSF website indicate that 78.2% of individuals earning their doctorate in the physical sciences have no graduate debt while 48.3% of those earning their doctorate in the social sciences have no graduate debt. Of the 48,069 research doctorates granted in 2010, 93% completed the SED, thus the information collected by the NSF can be good approximations of the population parameters.
-Suppose we take random samples of 100 individuals who earned a doctorate in the physical sciences (in 2010) and 100 individuals who earned a doctorate in the social sciences (in 2010). Find the mean and standard error (using four decimal places) of the distribution of differences in sample proportions ( ), and indicate if the sample sizes are large enough to use the Central Limit Theorem.
Every year since the 1957-58 academic year, the National Science Foundation (NSF) conducts its Survey of Earned Doctorates (SED) of all individuals receiving research doctoral degrees from accredited U.S. institutions. The results from the 2010 survey published on the NSF website indicate that 78.2% of individuals earning their doctorate in the physical sciences have no graduate debt while 48.3% of those earning their doctorate in the social sciences have no graduate debt. Of the 48,069 research doctorates granted in 2010, 93% completed the SED, thus the information collected by the NSF can be good approximations of the population parameters.
-Suppose we take random samples of 100 individuals who earned a doctorate in the physical sciences (in 2010) and 100 individuals who earned a doctorate in the social sciences (in 2010). Find the mean and standard error (using four decimal places) of the distribution of differences in sample proportions (
), and indicate if the sample sizes are large enough to use the Central Limit Theorem. Question
Use the following
Every year since the 1957-58 academic year, the National Science Foundation (NSF) conducts its Survey of Earned Doctorates (SED) of all individuals receiving research doctoral degrees from accredited U.S. institutions. The results from the 2010 survey published on the NSF website indicate that 78.2% of individuals earning their doctorate in the physical sciences have no graduate debt while 48.3% of those earning their doctorate in the social sciences have no graduate debt. Of the 48,069 research doctorates granted in 2010, 93% completed the SED, thus the information collected by the NSF can be good approximations of the population parameters.
-Suppose we take random samples of 25 individuals who earned a doctorate in the physical sciences (in 2010) and 50 individuals who earned a doctorate in the social sciences (in 2010). Find the mean and standard error (using four decimal places) of the distribution of differences in sample proportions ( ), and indicate if the sample sizes are large enough to use the Central Limit Theorem.
Every year since the 1957-58 academic year, the National Science Foundation (NSF) conducts its Survey of Earned Doctorates (SED) of all individuals receiving research doctoral degrees from accredited U.S. institutions. The results from the 2010 survey published on the NSF website indicate that 78.2% of individuals earning their doctorate in the physical sciences have no graduate debt while 48.3% of those earning their doctorate in the social sciences have no graduate debt. Of the 48,069 research doctorates granted in 2010, 93% completed the SED, thus the information collected by the NSF can be good approximations of the population parameters.
-Suppose we take random samples of 25 individuals who earned a doctorate in the physical sciences (in 2010) and 50 individuals who earned a doctorate in the social sciences (in 2010). Find the mean and standard error (using four decimal places) of the distribution of differences in sample proportions (
), and indicate if the sample sizes are large enough to use the Central Limit Theorem. Question
Use the following
Every year since the 1957-58 academic year, the National Science Foundation (NSF) conducts its Survey of Earned Doctorates (SED) of all individuals receiving research doctoral degrees from accredited U.S. institutions. The results from the 2010 survey published on the NSF website indicate that 78.2% of individuals earning their doctorate in the physical sciences have no graduate debt while 48.3% of those earning their doctorate in the social sciences have no graduate debt. Of the 48,069 research doctorates granted in 2010, 93% completed the SED, thus the information collected by the NSF can be good approximations of the population parameters.
-Suppose we take random samples of 50 individuals who earned a doctorate in the physical sciences (in 2010) and 25 individuals who earned a doctorate in the social sciences (in 2010). Find the mean and standard error (using four decimal places) of the distribution of differences in sample proportions ( ), and indicate if the sample sizes are large enough to use the Central Limit Theorem.
Every year since the 1957-58 academic year, the National Science Foundation (NSF) conducts its Survey of Earned Doctorates (SED) of all individuals receiving research doctoral degrees from accredited U.S. institutions. The results from the 2010 survey published on the NSF website indicate that 78.2% of individuals earning their doctorate in the physical sciences have no graduate debt while 48.3% of those earning their doctorate in the social sciences have no graduate debt. Of the 48,069 research doctorates granted in 2010, 93% completed the SED, thus the information collected by the NSF can be good approximations of the population parameters.
-Suppose we take random samples of 50 individuals who earned a doctorate in the physical sciences (in 2010) and 25 individuals who earned a doctorate in the social sciences (in 2010). Find the mean and standard error (using four decimal places) of the distribution of differences in sample proportions (
), and indicate if the sample sizes are large enough to use the Central Limit Theorem. Question
Question
Question
Question
Question
Use the following
Students in a small statistics class were asked to count the number of scars both on their "dominant"
hand (the one they use most often) and on their "off"
hand. The summary statistics are provided. It is of interest to compare the average number of scars on the dominant and off hands.

-Why is it appropriate to use paired data in this analysis? Explain briefly.
Students in a small statistics class were asked to count the number of scars both on their "dominant"
hand (the one they use most often) and on their "off"
hand. The summary statistics are provided. It is of interest to compare the average number of scars on the dominant and off hands.
-Why is it appropriate to use paired data in this analysis? Explain briefly.
Question
Use the following
Students in a small statistics class were asked to count the number of scars both on their "dominant"
hand (the one they use most often) and on their "off"
hand. The summary statistics are provided. It is of interest to compare the average number of scars on the dominant and off hands.
-Boxplots of the raw data are provided. Would it be appropriate to use a t-distribution to construct a confidence interval for, or perform a test about, the difference in the mean number of scars on dominant and off hands? Specifically mention which boxplot(s) you are using to justify your answer.
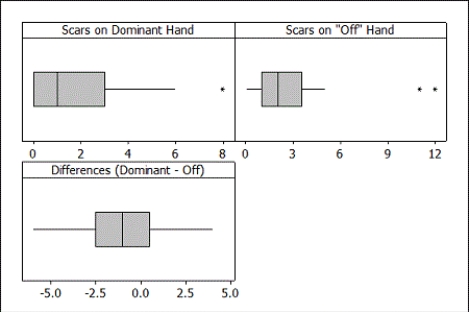
Question
Use the following
Students in a small statistics class were asked to count the number of scars both on their "dominant"
hand (the one they use most often) and on their "off"
hand. The summary statistics are provided. It is of interest to compare the average number of scars on the dominant and off hands.
-Construct a 90% confidence interval for the difference in mean number of scars on dominant and off hands. Round your margin of error to two decimal places.
Question
Use the following
Students in a small statistics class were asked to count the number of scars both on their "dominant"
hand (the one they use most often) and on their "off"
hand. The summary statistics are provided. It is of interest to compare the average number of scars on the dominant and off hands.
-Test to see if the mean number of scars on dominant hands is significantly different from the mean number of scars on off hands. Use a 10% significance level. Include all of the details of the test.
Question

Unlock Deck
Sign up to unlock the cards in this deck!
Unlock Deck
Unlock Deck
1/166
Play
Full screen (f)
Deck 6: Inference for Means and Proportions
1
Use the following
Consider taking samples of size 100 from a population with proportion 0.33.
-Find the mean of the distribution of sample proportions.
A) 0.0033
B) 0.033
C) 0.33
D) 33
Consider taking samples of size 100 from a population with proportion 0.33.
-Find the mean of the distribution of sample proportions.
A) 0.0033
B) 0.033
C) 0.33
D) 33
0.33
2
Use the following
Consider taking samples of size 100 from a population with proportion 0.33.
-Find the standard error of the distribution of sample proportions.
A) 0.002211
B) 0.0033
C) 0.047
D) 0.33
Consider taking samples of size 100 from a population with proportion 0.33.
-Find the standard error of the distribution of sample proportions.
A) 0.002211
B) 0.0033
C) 0.047
D) 0.33
0.047
3
Use the following
Consider taking samples of size 100 from a population with proportion 0.33.
-Is the sample size large enough for the Central Limit Theorem to apply so that the sample proportions follow a normal distribution?
Consider taking samples of size 100 from a population with proportion 0.33.
-Is the sample size large enough for the Central Limit Theorem to apply so that the sample proportions follow a normal distribution?
True
4
Use the following
Consider taking samples of size 25 from a population with proportion 0.65.
-Find the mean of the distribution of sample proportions.
A) 0.026
B) 0.65
C) 0.13
D) 16.25
Consider taking samples of size 25 from a population with proportion 0.65.
-Find the mean of the distribution of sample proportions.
A) 0.026
B) 0.65
C) 0.13
D) 16.25
Unlock Deck
Unlock for access to all 166 flashcards in this deck.
Unlock Deck
k this deck
5
Use the following
Consider taking samples of size 25 from a population with proportion 0.65.
-Find the standard error of the distribution of sample proportions.
A) 0.0954
B) 0.0091
C) 0.0455
D) 0.0191
Consider taking samples of size 25 from a population with proportion 0.65.
-Find the standard error of the distribution of sample proportions.
A) 0.0954
B) 0.0091
C) 0.0455
D) 0.0191
Unlock Deck
Unlock for access to all 166 flashcards in this deck.
Unlock Deck
k this deck
6
Use the following
Consider taking samples of size 25 from a population with proportion 0.65.
-Is the sample size large enough for the Central Limit Theorem to apply so that the sample proportions follow a normal distribution?
Consider taking samples of size 25 from a population with proportion 0.65.
-Is the sample size large enough for the Central Limit Theorem to apply so that the sample proportions follow a normal distribution?
Unlock Deck
Unlock for access to all 166 flashcards in this deck.
Unlock Deck
k this deck
7
Use the following
Suppose that the makers of M&M's claim that 24% of their Milk Chocolate M&M's are blue.
-Assume that Fun-Size bags of Milk Chocolate M&M's hold 20 candies. Find the mean and standard error of the distribution of sample proportions of blue candies for Fun-Size bags (i.e., samples of size 20). Use four decimal places when reporting the standard error.
Unlock Deck
Unlock for access to all 166 flashcards in this deck.
Unlock Deck
k this deck
8
Use the following
Suppose that the makers of M&M's claim that 24% of their Milk Chocolate M&M's are blue.
-Assume that the bags of Milk Chocolate M&M's sold in vending machines have 55 candies. Find the mean and standard error of the distribution of sample proportions of blue candies for vending machine bags (i.e., samples of size 55). Use four decimal places when reporting the standard error.
Unlock Deck
Unlock for access to all 166 flashcards in this deck.
Unlock Deck
k this deck
9
Use the following
Suppose that the makers of M&M's claim that 24% of their Milk Chocolate M&M's are blue.
-Assume that bags of Milk Chocolate M&M's labeled as "Medium"
size contain 415 candies. Find the mean and standard error of the distribution of sample proportions of blue candies for Medium bags (i.e., samples of size 415). Use four decimal places when reporting the standard error.
Unlock Deck
Unlock for access to all 166 flashcards in this deck.
Unlock Deck
k this deck
10
Use the following
Suppose that the makers of M&M's claim that 24% of their Milk Chocolate M&M's are blue.
-Would you expect using bags of Milk Chocolate M&M's labeled as "Large" size, which contain more candies than the "Medium"
Size bags, to result in a larger or smaller standard error?
A) Larger
B) Smaller
Suppose that the makers of M&M's claim that 24% of their Milk Chocolate M&M's are blue.
-Would you expect using bags of Milk Chocolate M&M's labeled as "Large" size, which contain more candies than the "Medium"
Size bags, to result in a larger or smaller standard error?
A) Larger
B) Smaller
Unlock Deck
Unlock for access to all 166 flashcards in this deck.
Unlock Deck
k this deck
11
Use the following
Suppose that the makers of M&M's claim that 24% of their Milk Chocolate M&M's are blue.
-For which sample sizes (Fun-Size with 20, Vending Machine with 55, or Medium with 415) would the Central Limit Theorem apply?
Suppose that the makers of M&M's claim that 24% of their Milk Chocolate M&M's are blue.
-For which sample sizes (Fun-Size with 20, Vending Machine with 55, or Medium with 415) would the Central Limit Theorem apply?
Unlock Deck
Unlock for access to all 166 flashcards in this deck.
Unlock Deck
k this deck
12
Use the following
Suppose that the makers of M&M's claim that 24% of their Milk Chocolate M&M's are blue.
-Suppose you purchase a bag of Milk Chocolate M&M's from a vending machine and only 8 of your 55 candies are blue. Assuming that the sample proportions are normally distributed, what percent of vending machine bags (i.e., samples of size 55) will have a sample proportion smaller than 0.145? Use two decimal places when reporting your answer.
Unlock Deck
Unlock for access to all 166 flashcards in this deck.
Unlock Deck
k this deck
13
Use the following
Admissions records at a small university indicates that 6.7% of the students enrolled are international students.
-Find the mean and standard error of the sample proportion of international students in random samples of size 50. Use four decimal places when reporting the standard error.
Admissions records at a small university indicates that 6.7% of the students enrolled are international students.
-Find the mean and standard error of the sample proportion of international students in random samples of size 50. Use four decimal places when reporting the standard error.
Unlock Deck
Unlock for access to all 166 flashcards in this deck.
Unlock Deck
k this deck
14
Use the following
Admissions records at a small university indicates that 6.7% of the students enrolled are international students.
-Find the mean and standard error of the sample proportion of international students in random samples of size 100. Use four decimal places when reporting the standard error.
Admissions records at a small university indicates that 6.7% of the students enrolled are international students.
-Find the mean and standard error of the sample proportion of international students in random samples of size 100. Use four decimal places when reporting the standard error.
Unlock Deck
Unlock for access to all 166 flashcards in this deck.
Unlock Deck
k this deck
15
Use the following
Admissions records at a small university indicates that 6.7% of the students enrolled are international students.
-Find the mean and standard error of the sample proportion of international students in random samples of size 200. Use four decimal places when reporting the standard error.
Admissions records at a small university indicates that 6.7% of the students enrolled are international students.
-Find the mean and standard error of the sample proportion of international students in random samples of size 200. Use four decimal places when reporting the standard error.
Unlock Deck
Unlock for access to all 166 flashcards in this deck.
Unlock Deck
k this deck
16
Use the following
Admissions records at a small university indicates that 6.7% of the students enrolled are international students.
-For which sample sizes (n = 50, n = 100, and n = 200) would the Central Limit Theorem apply?
Admissions records at a small university indicates that 6.7% of the students enrolled are international students.
-For which sample sizes (n = 50, n = 100, and n = 200) would the Central Limit Theorem apply?
Unlock Deck
Unlock for access to all 166 flashcards in this deck.
Unlock Deck
k this deck
17
Use the following
Admissions records at a small university indicates that 6.7% of the students enrolled are international students.
-What proportion of samples of 200 randomly selected students will have at least 8% international students? Use three decimal places when reporting your answer.
Admissions records at a small university indicates that 6.7% of the students enrolled are international students.
-What proportion of samples of 200 randomly selected students will have at least 8% international students? Use three decimal places when reporting your answer.
Unlock Deck
Unlock for access to all 166 flashcards in this deck.
Unlock Deck
k this deck
18
Use the following
A 2009 study to investigate the dominant paws in cats was described in Animal Behaviour (Volume 78, Issue 2). The researchers used a random sample of 42 domestic cats. In this study, each cat was shown a treat (5 grams of tuna), and while the cat watched, the food was placed inside a jar. The opening of the jar was small enough that the cat could not stick its head inside to remove the treat. The researcher recorded the paw that was first used by the cat to try to retrieve the treat. This was repeated 100 times for each cat (over a span of several days). The paw used most often was deemed the dominant paw (note that one cat used both paws equally and was classified as "ambidextrous"). Of the 42 cats studied, 20 were classified as "left-pawed".
-Verify that the sample is large enough to use the normal formula to find a confidence interval for the proportion of domestic cats that are "left-pawed".
Unlock Deck
Unlock for access to all 166 flashcards in this deck.
Unlock Deck
k this deck
19
Use the following
A 2009 study to investigate the dominant paws in cats was described in Animal Behaviour (Volume 78, Issue 2). The researchers used a random sample of 42 domestic cats. In this study, each cat was shown a treat (5 grams of tuna), and while the cat watched, the food was placed inside a jar. The opening of the jar was small enough that the cat could not stick its head inside to remove the treat. The researcher recorded the paw that was first used by the cat to try to retrieve the treat. This was repeated 100 times for each cat (over a span of several days). The paw used most often was deemed the dominant paw (note that one cat used both paws equally and was classified as "ambidextrous"). Of the 42 cats studied, 20 were classified as "left-pawed".
-Construct a 95% confidence interval for the proportion of domestic cats that are "left-pawed". Use three decimal places in your margin of error.
Unlock Deck
Unlock for access to all 166 flashcards in this deck.
Unlock Deck
k this deck
20
Use the following
A 2009 study to investigate the dominant paws in cats was described in Animal Behaviour (Volume 78, Issue 2). The researchers used a random sample of 42 domestic cats. In this study, each cat was shown a treat (5 grams of tuna), and while the cat watched, the food was placed inside a jar. The opening of the jar was small enough that the cat could not stick its head inside to remove the treat. The researcher recorded the paw that was first used by the cat to try to retrieve the treat. This was repeated 100 times for each cat (over a span of several days). The paw used most often was deemed the dominant paw (note that one cat used both paws equally and was classified as "ambidextrous"). Of the 42 cats studied, 20 were classified as "left-pawed".
-Provide an interpretation of your interval in the context of this data situation.
Unlock Deck
Unlock for access to all 166 flashcards in this deck.
Unlock Deck
k this deck
21
Use the following
A 2009 study to investigate the dominant paws in cats was described in Animal Behaviour (Volume 78, Issue 2). The researchers used a random sample of 42 domestic cats. In this study, each cat was shown a treat (5 grams of tuna), and while the cat watched, the food was placed inside a jar. The opening of the jar was small enough that the cat could not stick its head inside to remove the treat. The researcher recorded the paw that was first used by the cat to try to retrieve the treat. This was repeated 100 times for each cat (over a span of several days). The paw used most often was deemed the dominant paw (note that one cat used both paws equally and was classified as "ambidextrous"). Of the 42 cats studied, 20 were classified as "left-pawed".
-Another researcher wants to conduct a similar study to more precisely estimate the proportion of cats that are "left-pawed". They want to construct a 95% confidence interval that has a margin of error of 6%. How many cats does she need to use in her sample?
Unlock Deck
Unlock for access to all 166 flashcards in this deck.
Unlock Deck
k this deck
22
Use the following
In an October 2012 survey of 7,786 randomly selected adults living in Germany, 5,840 said they exercised for at least 30 minutes three or more times per week.
-Verify that the sample is large enough to use the normal formula to find a confidence interval for the proportion of Germans who exercises for 30 minutes three or more times a week.
Unlock Deck
Unlock for access to all 166 flashcards in this deck.
Unlock Deck
k this deck
23
Use the following
In an October 2012 survey of 7,786 randomly selected adults living in Germany, 5,840 said they exercised for at least 30 minutes three or more times per week.
-Construct a 99% confidence interval for the proportion of Germans who exercise for 30 minutes three or more times a week. Use three decimal places in your margin of error.
Unlock Deck
Unlock for access to all 166 flashcards in this deck.
Unlock Deck
k this deck
24
Use the following
In an October 2012 survey of 7,786 randomly selected adults living in Germany, 5,840 said they exercised for at least 30 minutes three or more times per week.
-Provide an interpretation of your interval in the context of this data situation.
In an October 2012 survey of 7,786 randomly selected adults living in Germany, 5,840 said they exercised for at least 30 minutes three or more times per week.
-Provide an interpretation of your interval in the context of this data situation.
Unlock Deck
Unlock for access to all 166 flashcards in this deck.
Unlock Deck
k this deck
25
Use the following
In an October 2012 survey of 7,786 randomly selected adults living in Germany, 5,840 said they exercised for at least 30 minutes three or more times per week.
-Suppose an exercise scientist wants to estimate the proportion of American adults who exercise for 30 minutes three or more times per week. He wants to construct a 90% confidence interval with a margin of error of 1%. Note that Americans are typically thought to not be as active as individuals in other countries, and thus the estimate from Germany is likely not a good estimate for Americans. What sample size does he need?
Unlock Deck
Unlock for access to all 166 flashcards in this deck.
Unlock Deck
k this deck
26
Use the following
In an August 2012 Gallup survey of 1,012 randomly selected U.S. adults (age 18 and over), 53% said that they were dissatisfied with the quality of education students receive in kindergarten through grade 12.
-Verify that the sample is large enough to use the normal formula to find a confidence interval for the proportion of Americans who are dissatisfied with the quality of education students receive in kindergarten through grade 12.
Unlock Deck
Unlock for access to all 166 flashcards in this deck.
Unlock Deck
k this deck
27
Use the following
In an August 2012 Gallup survey of 1,012 randomly selected U.S. adults (age 18 and over), 53% said that they were dissatisfied with the quality of education students receive in kindergarten through grade 12.
-Construct a 90% confidence interval for the proportion of U.S. adults who are dissatisfied with the quality of education students receive in kindergarten through grade 12. Use three decimal places in your margin of error.
Unlock Deck
Unlock for access to all 166 flashcards in this deck.
Unlock Deck
k this deck
28
Use the following
In an August 2012 Gallup survey of 1,012 randomly selected U.S. adults (age 18 and over), 53% said that they were dissatisfied with the quality of education students receive in kindergarten through grade 12.
-Provide an interpretation of your interval in the context of this data situation.
In an August 2012 Gallup survey of 1,012 randomly selected U.S. adults (age 18 and over), 53% said that they were dissatisfied with the quality of education students receive in kindergarten through grade 12.
-Provide an interpretation of your interval in the context of this data situation.
Unlock Deck
Unlock for access to all 166 flashcards in this deck.
Unlock Deck
k this deck
29
Use the following
In an August 2012 Gallup survey of 1,012 randomly selected U.S. adults (age 18 and over), 53% said that they were dissatisfied with the quality of education students receive in kindergarten through grade 12.
-Suppose you want to estimate the proportion of local adults who are dissatisfied with the education students receive in kindergarten through grade 12 with 95% confidence and a 5% margin of error. If you suspect that local adults won't differ drastically from those Gallup used, how many people should you sample?
Unlock Deck
Unlock for access to all 166 flashcards in this deck.
Unlock Deck
k this deck
30
Use the following
In an August 2012 Gallup survey of 1,012 randomly selected U.S. adults (age 18 and over), 53% said that they were dissatisfied with the quality of education students receive in kindergarten through grade 12.
-Test, at the 5% level, if this sample provides evidence that the proportion of Americans who are dissatisfied with education in kindergarten through grade 12 differs significantly from 50%. Be sure to verify that it is appropriate to use a normal distribution to compute the p-value and include all of the details of the test.
Unlock Deck
Unlock for access to all 166 flashcards in this deck.
Unlock Deck
k this deck
31
Use the following
A sample of 148 college students at a large university reports getting an average of 6.85 hours of sleep last night with a standard deviation of 2.12 hours.
-Verify that it is reasonable to use the t-distribution to construct a confidence interval for the average amount of sleep students at this university got last night.
Unlock Deck
Unlock for access to all 166 flashcards in this deck.
Unlock Deck
k this deck
32
Use the following
A sample of 148 college students at a large university reports getting an average of 6.85 hours of sleep last night with a standard deviation of 2.12 hours.
-Construct a 98% confidence interval for the average amount of sleep students at this university got last night. Use two decimal places in your margin of error.
Unlock Deck
Unlock for access to all 166 flashcards in this deck.
Unlock Deck
k this deck
33
Use the following
A sample of 148 college students at a large university reports getting an average of 6.85 hours of sleep last night with a standard deviation of 2.12 hours.
-Provide an interpretation of your interval in the context of this data situation.
A sample of 148 college students at a large university reports getting an average of 6.85 hours of sleep last night with a standard deviation of 2.12 hours.
-Provide an interpretation of your interval in the context of this data situation.
Unlock Deck
Unlock for access to all 166 flashcards in this deck.
Unlock Deck
k this deck
34
Use the following
A sample of 148 college students at a large university reports getting an average of 6.85 hours of sleep last night with a standard deviation of 2.12 hours.
-Suppose you want to conduct a similar study at your university. Assuming that the standard deviation of this sample is a reasonable estimate of the standard deviation of sleep time at your university, how many students do you need to survey to estimate the mean sleep time of students at your university with 95% confidence and a margin of error of 0.5 hours?
Unlock Deck
Unlock for access to all 166 flashcards in this deck.
Unlock Deck
k this deck
35
Use the following
An Internet provider contacts a random sample of 300 customers and asks how many hours per week the customers use the Internet. The responses are summarized in the provided dotplot. The average amount of time spent on the Internet per week was 7.2 hours, with a standard deviation of 7.9 hours.
-Is it reasonable to use the t-distribution to construct a confidence interval for the average amount of time customers of this Internet provider spend on the Internet each week? Explain briefly.
Unlock Deck
Unlock for access to all 166 flashcards in this deck.
Unlock Deck
k this deck
36
Use the following
An Internet provider contacts a random sample of 300 customers and asks how many hours per week the customers use the Internet. The responses are summarized in the provided dotplot. The average amount of time spent on the Internet per week was 7.2 hours, with a standard deviation of 7.9 hours.
-Construct a 95% confidence interval for the average amount of time customers of this Internet provider spend on the Internet each week. Round the margin of error to one decimal place.
Unlock Deck
Unlock for access to all 166 flashcards in this deck.
Unlock Deck
k this deck
37
Use the following
An Internet provider contacts a random sample of 300 customers and asks how many hours per week the customers use the Internet. The responses are summarized in the provided dotplot. The average amount of time spent on the Internet per week was 7.2 hours, with a standard deviation of 7.9 hours.
-Provide an interpretation of your interval in the context of this data situation.
Unlock Deck
Unlock for access to all 166 flashcards in this deck.
Unlock Deck
k this deck
38
Use the following
An Internet provider contacts a random sample of 300 customers and asks how many hours per week the customers use the Internet. The responses are summarized in the provided dotplot. The average amount of time spent on the Internet per week was 7.2 hours, with a standard deviation of 7.9 hours.
-If we want a margin of error of 0.5 hours, how large of a sample would we need?
Unlock Deck
Unlock for access to all 166 flashcards in this deck.
Unlock Deck
k this deck
39
Use the following
According to the National Science Foundation, individuals who graduated in 2010 with a doctoral degree had an average of $14,115 graduate debt. Assume that the standard deviation of graduate debt is $26,400. If we take lots of samples of individuals who graduated in 2010 with a doctoral degree, what would you expect the mean and standard error of the distribution of sample mean graduate debt amounts to be in each case? In each case, use two decimal places when reporting your standard error.
-n = 200 individuals
Unlock Deck
Unlock for access to all 166 flashcards in this deck.
Unlock Deck
k this deck
40
Use the following
According to the National Science Foundation, individuals who graduated in 2010 with a doctoral degree had an average of $14,115 graduate debt. Assume that the standard deviation of graduate debt is $26,400. If we take lots of samples of individuals who graduated in 2010 with a doctoral degree, what would you expect the mean and standard error of the distribution of sample mean graduate debt amounts to be in each case? In each case, use two decimal places when reporting your standard error.
-n = 500 individuals
Unlock Deck
Unlock for access to all 166 flashcards in this deck.
Unlock Deck
k this deck
41
Use the following
For each of the following, assume that the sample is a random sample from a distribution that is reasonably normally distributed and that we are doing inference for a population mean.
-Find endpoints of a t-distribution with 2.5% beyond them in each tail if the sample has size n = 15.
For each of the following, assume that the sample is a random sample from a distribution that is reasonably normally distributed and that we are doing inference for a population mean.
-Find endpoints of a t-distribution with 2.5% beyond them in each tail if the sample has size n = 15.
Unlock Deck
Unlock for access to all 166 flashcards in this deck.
Unlock Deck
k this deck
42
Use the following
For each of the following, assume that the sample is a random sample from a distribution that is reasonably normally distributed and that we are doing inference for a population mean.
-Find endpoints of a t-distribution with 10% beyond them in each tail if the sample has size n = 5.
For each of the following, assume that the sample is a random sample from a distribution that is reasonably normally distributed and that we are doing inference for a population mean.
-Find endpoints of a t-distribution with 10% beyond them in each tail if the sample has size n = 5.
Unlock Deck
Unlock for access to all 166 flashcards in this deck.
Unlock Deck
k this deck
43
Use the following
For each of the following, assume that the sample is a random sample from a distribution that is reasonably normally distributed and that we are doing inference for a population mean.
-Find endpoints of a t-distribution with 3% beyond them in each tail if the sample has size n = 60.
For each of the following, assume that the sample is a random sample from a distribution that is reasonably normally distributed and that we are doing inference for a population mean.
-Find endpoints of a t-distribution with 3% beyond them in each tail if the sample has size n = 60.
Unlock Deck
Unlock for access to all 166 flashcards in this deck.
Unlock Deck
k this deck
44
Use the following
For each of the following, assume that the sample is a random sample from a distribution that is reasonably normally distributed and that we are doing inference for a population mean.
-Find endpoints of a t-distribution with 1.5% beyond them in each tail if the sample has size 22.
For each of the following, assume that the sample is a random sample from a distribution that is reasonably normally distributed and that we are doing inference for a population mean.
-Find endpoints of a t-distribution with 1.5% beyond them in each tail if the sample has size 22.
Unlock Deck
Unlock for access to all 166 flashcards in this deck.
Unlock Deck
k this deck
45
Use the following
For each of the following, assume that the sample is a random sample from a distribution that is reasonably normally distributed and that we are doing inference for a population mean.
-Find the area in a t-distribution to the right of 2.6 if the sample has size n = 16.
For each of the following, assume that the sample is a random sample from a distribution that is reasonably normally distributed and that we are doing inference for a population mean.
-Find the area in a t-distribution to the right of 2.6 if the sample has size n = 16.
Unlock Deck
Unlock for access to all 166 flashcards in this deck.
Unlock Deck
k this deck
46
Use the following
For each of the following, assume that the sample is a random sample from a distribution that is reasonably normally distributed and that we are doing inference for a population mean.
-Find the area in a t-distribution to the right of 1.75 if the sample has size n = 4.
For each of the following, assume that the sample is a random sample from a distribution that is reasonably normally distributed and that we are doing inference for a population mean.
-Find the area in a t-distribution to the right of 1.75 if the sample has size n = 4.
Unlock Deck
Unlock for access to all 166 flashcards in this deck.
Unlock Deck
k this deck
47
Use the following
For each of the following, assume that the sample is a random sample from a distribution that is reasonably normally distributed and that we are doing inference for a population mean.
-Find the area in a t-distribution to the left of -2.7 if the sample has size n = 35.
For each of the following, assume that the sample is a random sample from a distribution that is reasonably normally distributed and that we are doing inference for a population mean.
-Find the area in a t-distribution to the left of -2.7 if the sample has size n = 35.
Unlock Deck
Unlock for access to all 166 flashcards in this deck.
Unlock Deck
k this deck
48
Use the following
For each of the following, assume that the sample is a random sample from a distribution that is reasonably normally distributed and that we are doing inference for a population mean.
-Find the area in a t-distribution to the left of -0.68 if the sample has size n = 20.
For each of the following, assume that the sample is a random sample from a distribution that is reasonably normally distributed and that we are doing inference for a population mean.
-Find the area in a t-distribution to the left of -0.68 if the sample has size n = 20.
Unlock Deck
Unlock for access to all 166 flashcards in this deck.
Unlock Deck
k this deck
49
Use the following
For each of the following, find the mean and standard error of the distribution of sample means. Use two decimal places when reporting your standard error.
-Samples of size 15 from a population with mean 25 and standard deviation 4.
For each of the following, find the mean and standard error of the distribution of sample means. Use two decimal places when reporting your standard error.
-Samples of size 15 from a population with mean 25 and standard deviation 4.
Unlock Deck
Unlock for access to all 166 flashcards in this deck.
Unlock Deck
k this deck
50
Use the following
For each of the following, find the mean and standard error of the distribution of sample means. Use two decimal places when reporting your standard error.
-Samples of size 50 from a population with mean 450 and standard deviation 75.
For each of the following, find the mean and standard error of the distribution of sample means. Use two decimal places when reporting your standard error.
-Samples of size 50 from a population with mean 450 and standard deviation 75.
Unlock Deck
Unlock for access to all 166 flashcards in this deck.
Unlock Deck
k this deck
51
Use the following
For each of the following, find the mean and standard error of the distribution of sample means. Use two decimal places when reporting your standard error.
-Samples of size 25 from a population with mean 10 and standard deviation 2.
For each of the following, find the mean and standard error of the distribution of sample means. Use two decimal places when reporting your standard error.
-Samples of size 25 from a population with mean 10 and standard deviation 2.
Unlock Deck
Unlock for access to all 166 flashcards in this deck.
Unlock Deck
k this deck
52
Use the following
For each of the following, find the mean and standard error of the distribution of sample means. Use two decimal places when reporting your standard error.
-Samples of size 250 from a population with mean 80 and standard deviation of 15.
For each of the following, find the mean and standard error of the distribution of sample means. Use two decimal places when reporting your standard error.
-Samples of size 250 from a population with mean 80 and standard deviation of 15.
Unlock Deck
Unlock for access to all 166 flashcards in this deck.
Unlock Deck
k this deck
53
Use the following
A dotplot and the summary statistics for a sample are provided. In each case, indicate whether or not it is appropriate to use the t-distribution.
-n = 12; = 4.75; s = 1.603
A) Appropriate
B) Not Appropriate
A dotplot and the summary statistics for a sample are provided. In each case, indicate whether or not it is appropriate to use the t-distribution.
-n = 12;
= 4.75; s = 1.603A) Appropriate
B) Not Appropriate
Unlock Deck
Unlock for access to all 166 flashcards in this deck.
Unlock Deck
k this deck
54
Use the following
A dotplot and the summary statistics for a sample are provided. In each case, indicate whether or not it is appropriate to use the t-distribution.
-n = 10; = 7.80; s = 9.28
A) Appropriate
B) Not Appropriate
A dotplot and the summary statistics for a sample are provided. In each case, indicate whether or not it is appropriate to use the t-distribution.
-n = 10;
= 7.80; s = 9.28A) Appropriate
B) Not Appropriate
Unlock Deck
Unlock for access to all 166 flashcards in this deck.
Unlock Deck
k this deck
55
Use the following
A dotplot and the summary statistics for a sample are provided. In each case, indicate whether or not it is appropriate to use the t-distribution.
-n = 100; = 9.93; s = 9.247
A) Appropriate
B) Not Appropriate
A dotplot and the summary statistics for a sample are provided. In each case, indicate whether or not it is appropriate to use the t-distribution.
-n = 100;
= 9.93; s = 9.247A) Appropriate
B) Not Appropriate
Unlock Deck
Unlock for access to all 166 flashcards in this deck.
Unlock Deck
k this deck
56
Use the following
A dotplot and the summary statistics for a sample are provided. In each case, indicate whether or not it is appropriate to use the t-distribution.
-n = 15; = 44; s = 7.32
A) Appropriate
B) Not Appropriate
A dotplot and the summary statistics for a sample are provided. In each case, indicate whether or not it is appropriate to use the t-distribution.
-n = 15;
= 44; s = 7.32 A) Appropriate
B) Not Appropriate
Unlock Deck
Unlock for access to all 166 flashcards in this deck.
Unlock Deck
k this deck
57
Use the following
November 6, 2012 was election day. Many of the major television networks aired coverage of the incoming election results during the primetime hours. The provided boxplot displays the amount of time (in minutes) spent watching election coverage for a random sample of 25 U.S. adults. In this sample, the average time spent watching election coverage was 80.44 minutes with standard deviation of 43.99 minutes.
-Is it reasonable to use the t-distribution to construct a confidence interval for the average amount of time spent watching election coverage by U.S. adults? Explain briefly.
Unlock Deck
Unlock for access to all 166 flashcards in this deck.
Unlock Deck
k this deck
58
Use the following
November 6, 2012 was election day. Many of the major television networks aired coverage of the incoming election results during the primetime hours. The provided boxplot displays the amount of time (in minutes) spent watching election coverage for a random sample of 25 U.S. adults. In this sample, the average time spent watching election coverage was 80.44 minutes with standard deviation of 43.99 minutes.
-Construct a 90% confidence interval for the average amount of time U.S. adults spent watching election coverage. Use two decimal places in your margin of error.
Unlock Deck
Unlock for access to all 166 flashcards in this deck.
Unlock Deck
k this deck
59
Use the following
November 6, 2012 was election day. Many of the major television networks aired coverage of the incoming election results during the primetime hours. The provided boxplot displays the amount of time (in minutes) spent watching election coverage for a random sample of 25 U.S. adults. In this sample, the average time spent watching election coverage was 80.44 minutes with standard deviation of 43.99 minutes.
-Provide an interpretation of your interval in the context of this data situation.
Unlock Deck
Unlock for access to all 166 flashcards in this deck.
Unlock Deck
k this deck
60
Use the following
November 6, 2012 was election day. Many of the major television networks aired coverage of the incoming election results during the primetime hours. The provided boxplot displays the amount of time (in minutes) spent watching election coverage for a random sample of 25 U.S. adults. In this sample, the average time spent watching election coverage was 80.44 minutes with standard deviation of 43.99 minutes.
-What sample size would we need to estimate the average amount of time U.S. adults watching election coverage with 99% confidence and a margin of error of 5 hours?
November 6, 2012 was election day. Many of the major television networks aired coverage of the incoming election results during the primetime hours. The provided boxplot displays the amount of time (in minutes) spent watching election coverage for a random sample of 25 U.S. adults. In this sample, the average time spent watching election coverage was 80.44 minutes with standard deviation of 43.99 minutes.
-What sample size would we need to estimate the average amount of time U.S. adults watching election coverage with 99% confidence and a margin of error of
5 hours? Unlock Deck
Unlock for access to all 166 flashcards in this deck.
Unlock Deck
k this deck
61
Use the following
Turkey is a staple at most traditional Thanksgiving dinners. A random sample of 12 grocery store customers were asked about the size of the turkey they were purchasing for Thanksgiving. The average weight was 13.9 pounds with a standard deviation of 2.2 pounds. The boxplot displays the distribution of the sample turkey weights.
-Is is reasonable to use the t-distribution to construct a confidence interval for the average weight of turkeys purchased at this store? Explain briefly.
Unlock Deck
Unlock for access to all 166 flashcards in this deck.
Unlock Deck
k this deck
62
Use the following
Turkey is a staple at most traditional Thanksgiving dinners. A random sample of 12 grocery store customers were asked about the size of the turkey they were purchasing for Thanksgiving. The average weight was 13.9 pounds with a standard deviation of 2.2 pounds. The boxplot displays the distribution of the sample turkey weights.
-Construct a 99% confidence interval for the average weight of turkeys purchased at this store. Round your margin of error to two decimal places.
Unlock Deck
Unlock for access to all 166 flashcards in this deck.
Unlock Deck
k this deck
63
Use the following
Turkey is a staple at most traditional Thanksgiving dinners. A random sample of 12 grocery store customers were asked about the size of the turkey they were purchasing for Thanksgiving. The average weight was 13.9 pounds with a standard deviation of 2.2 pounds. The boxplot displays the distribution of the sample turkey weights.
-Provide an interpretation of your interval in the context of this data situation.
Unlock Deck
Unlock for access to all 166 flashcards in this deck.
Unlock Deck
k this deck
64
Use the following
Turkey is a staple at most traditional Thanksgiving dinners. A random sample of 12 grocery store customers were asked about the size of the turkey they were purchasing for Thanksgiving. The average weight was 13.9 pounds with a standard deviation of 2.2 pounds. The boxplot displays the distribution of the sample turkey weights.
-What sample size would we need to reduce the margin of error to 1 pound?
Turkey is a staple at most traditional Thanksgiving dinners. A random sample of 12 grocery store customers were asked about the size of the turkey they were purchasing for Thanksgiving. The average weight was 13.9 pounds with a standard deviation of 2.2 pounds. The boxplot displays the distribution of the sample turkey weights.
-What sample size would we need to reduce the margin of error to
1 pound? Unlock Deck
Unlock for access to all 166 flashcards in this deck.
Unlock Deck
k this deck
65
Use the following
Turkey is a staple at most traditional Thanksgiving dinners. A random sample of 12 grocery store customers were asked about the size of the turkey they were purchasing for Thanksgiving. The average weight was 13.9 pounds with a standard deviation of 2.2 pounds. The boxplot displays the distribution of the sample turkey weights.
-According to the Minnesota Turkey Growers Association's website, the average weight of turkeys purchased for Thanksgiving dinner is 15 pounds. Test, at the 5% level, if this sample provides evidence that the average weight of turkeys purchased at this store differs from 15 pounds. Include all of the details of the test.
Unlock Deck
Unlock for access to all 166 flashcards in this deck.
Unlock Deck
k this deck
66
Use the following
A study published in 2008 in the American Journal of Health Promotion (Volume 22, Issue 6) by researchers at the University of Minnesota (U of M) found that 124 out of 1,923 U of M females had over $6,000 in credit card debt while 61 out of 1,236 males had over $6,000 in credit card debt.
-Verify that the sample size is large enough in each group to use the normal distribution to construct a confidence interval for a difference in two proportions.
Unlock Deck
Unlock for access to all 166 flashcards in this deck.
Unlock Deck
k this deck
67
Use the following
A study published in 2008 in the American Journal of Health Promotion (Volume 22, Issue 6) by researchers at the University of Minnesota (U of M) found that 124 out of 1,923 U of M females had over $6,000 in credit card debt while 61 out of 1,236 males had over $6,000 in credit card debt.
-Construct a 95% confidence interval for the difference between the proportions of female and male University of Minnesota students who have more than $6,000 in credit card debt (pf - pm). Round your sample proportions and margin of error to four decimal places.
Unlock Deck
Unlock for access to all 166 flashcards in this deck.
Unlock Deck
k this deck
68
Use the following
A study published in 2008 in the American Journal of Health Promotion (Volume 22, Issue 6) by researchers at the University of Minnesota (U of M) found that 124 out of 1,923 U of M females had over $6,000 in credit card debt while 61 out of 1,236 males had over $6,000 in credit card debt.
-Test, at the 5% level, if there is evidence that the proportion of female students at U of M with more that $6,000 credit card debt is greater than the proportion of males at U of M with more than $6,000 credit card debt. Include all details of the test.
Unlock Deck
Unlock for access to all 166 flashcards in this deck.
Unlock Deck
k this deck
69
Use the following
Every year since the 1957-58 academic year, the National Science Foundation (NSF) conducts its Survey of Earned Doctorates (SED) of all individuals receiving research doctoral degrees from accredited U.S. institutions. The results from the 2010 survey published on the NSF website indicate that 78.2% of individuals earning their doctorate in the physical sciences have no graduate debt while 48.3% of those earning their doctorate in the social sciences have no graduate debt. Of the 48,069 research doctorates granted in 2010, 93% completed the SED, thus the information collected by the NSF can be good approximations of the population parameters.
-Suppose we take random samples of 100 individuals who earned a doctorate in the physical sciences (in 2010) and 100 individuals who earned a doctorate in the social sciences (in 2010). Find the mean and standard error (using four decimal places) of the distribution of differences in sample proportions ( ), and indicate if the sample sizes are large enough to use the Central Limit Theorem.
Every year since the 1957-58 academic year, the National Science Foundation (NSF) conducts its Survey of Earned Doctorates (SED) of all individuals receiving research doctoral degrees from accredited U.S. institutions. The results from the 2010 survey published on the NSF website indicate that 78.2% of individuals earning their doctorate in the physical sciences have no graduate debt while 48.3% of those earning their doctorate in the social sciences have no graduate debt. Of the 48,069 research doctorates granted in 2010, 93% completed the SED, thus the information collected by the NSF can be good approximations of the population parameters.
-Suppose we take random samples of 100 individuals who earned a doctorate in the physical sciences (in 2010) and 100 individuals who earned a doctorate in the social sciences (in 2010). Find the mean and standard error (using four decimal places) of the distribution of differences in sample proportions (
), and indicate if the sample sizes are large enough to use the Central Limit Theorem. Unlock Deck
Unlock for access to all 166 flashcards in this deck.
Unlock Deck
k this deck
70
Use the following
Every year since the 1957-58 academic year, the National Science Foundation (NSF) conducts its Survey of Earned Doctorates (SED) of all individuals receiving research doctoral degrees from accredited U.S. institutions. The results from the 2010 survey published on the NSF website indicate that 78.2% of individuals earning their doctorate in the physical sciences have no graduate debt while 48.3% of those earning their doctorate in the social sciences have no graduate debt. Of the 48,069 research doctorates granted in 2010, 93% completed the SED, thus the information collected by the NSF can be good approximations of the population parameters.
-Suppose we take random samples of 25 individuals who earned a doctorate in the physical sciences (in 2010) and 50 individuals who earned a doctorate in the social sciences (in 2010). Find the mean and standard error (using four decimal places) of the distribution of differences in sample proportions ( ), and indicate if the sample sizes are large enough to use the Central Limit Theorem.
Every year since the 1957-58 academic year, the National Science Foundation (NSF) conducts its Survey of Earned Doctorates (SED) of all individuals receiving research doctoral degrees from accredited U.S. institutions. The results from the 2010 survey published on the NSF website indicate that 78.2% of individuals earning their doctorate in the physical sciences have no graduate debt while 48.3% of those earning their doctorate in the social sciences have no graduate debt. Of the 48,069 research doctorates granted in 2010, 93% completed the SED, thus the information collected by the NSF can be good approximations of the population parameters.
-Suppose we take random samples of 25 individuals who earned a doctorate in the physical sciences (in 2010) and 50 individuals who earned a doctorate in the social sciences (in 2010). Find the mean and standard error (using four decimal places) of the distribution of differences in sample proportions (
), and indicate if the sample sizes are large enough to use the Central Limit Theorem. Unlock Deck
Unlock for access to all 166 flashcards in this deck.
Unlock Deck
k this deck
71
Use the following
Every year since the 1957-58 academic year, the National Science Foundation (NSF) conducts its Survey of Earned Doctorates (SED) of all individuals receiving research doctoral degrees from accredited U.S. institutions. The results from the 2010 survey published on the NSF website indicate that 78.2% of individuals earning their doctorate in the physical sciences have no graduate debt while 48.3% of those earning their doctorate in the social sciences have no graduate debt. Of the 48,069 research doctorates granted in 2010, 93% completed the SED, thus the information collected by the NSF can be good approximations of the population parameters.
-Suppose we take random samples of 50 individuals who earned a doctorate in the physical sciences (in 2010) and 25 individuals who earned a doctorate in the social sciences (in 2010). Find the mean and standard error (using four decimal places) of the distribution of differences in sample proportions ( ), and indicate if the sample sizes are large enough to use the Central Limit Theorem.
Every year since the 1957-58 academic year, the National Science Foundation (NSF) conducts its Survey of Earned Doctorates (SED) of all individuals receiving research doctoral degrees from accredited U.S. institutions. The results from the 2010 survey published on the NSF website indicate that 78.2% of individuals earning their doctorate in the physical sciences have no graduate debt while 48.3% of those earning their doctorate in the social sciences have no graduate debt. Of the 48,069 research doctorates granted in 2010, 93% completed the SED, thus the information collected by the NSF can be good approximations of the population parameters.
-Suppose we take random samples of 50 individuals who earned a doctorate in the physical sciences (in 2010) and 25 individuals who earned a doctorate in the social sciences (in 2010). Find the mean and standard error (using four decimal places) of the distribution of differences in sample proportions (
), and indicate if the sample sizes are large enough to use the Central Limit Theorem. Unlock Deck
Unlock for access to all 166 flashcards in this deck.
Unlock Deck
k this deck
72
Use the following
Situations comparing two proportions are described. In each case, determine whether the situation involves comparing proportions for two groups or comparing two proportions from the same group.
-Compare the proportion of U.S. adults who have a positive opinion about the media and the proportion of U.S. adults who have a negative opinion about the media.
A) Comparing proportions for two groups
B) Comparing two proportions from the same group
Unlock Deck
Unlock for access to all 166 flashcards in this deck.
Unlock Deck
k this deck
73
Use the following
Situations comparing two proportions are described. In each case, determine whether the situation involves comparing proportions for two groups or comparing two proportions from the same group.
-Comparing proportion of milk chocolate M&M's that are blue to the proportion of milk chocolate M&M's that are green.
A) Comparing proportions for two groups
B) Comparing two proportions from the same group
Unlock Deck
Unlock for access to all 166 flashcards in this deck.
Unlock Deck
k this deck
74
Use the following
Situations comparing two proportions are described. In each case, determine whether the situation involves comparing proportions for two groups or comparing two proportions from the same group.
-Comparing the proportion of milk chocolate M&M's that are blue to the proportion of dark chocolate M&M's that are blue.
A) Comparing proportions for two groups
B) Comparing two proportions from the same group
Unlock Deck
Unlock for access to all 166 flashcards in this deck.
Unlock Deck
k this deck
75
Use the following
Situations comparing two proportions are described. In each case, determine whether the situation involves comparing proportions for two groups or comparing two proportions from the same group.
-Compare the proportion of female students at a university who play a sport to the proportion of male students at a university who play a sport.
A) Comparing proportions for two groups
B) Comparing two proportions from the same group
Unlock Deck
Unlock for access to all 166 flashcards in this deck.
Unlock Deck
k this deck
76
Use the following
Students in a small statistics class were asked to count the number of scars both on their "dominant"
hand (the one they use most often) and on their "off"
hand. The summary statistics are provided. It is of interest to compare the average number of scars on the dominant and off hands.
-Why is it appropriate to use paired data in this analysis? Explain briefly.
Unlock Deck
Unlock for access to all 166 flashcards in this deck.
Unlock Deck
k this deck
77
Use the following
Students in a small statistics class were asked to count the number of scars both on their "dominant"
hand (the one they use most often) and on their "off"
hand. The summary statistics are provided. It is of interest to compare the average number of scars on the dominant and off hands.
-Boxplots of the raw data are provided. Would it be appropriate to use a t-distribution to construct a confidence interval for, or perform a test about, the difference in the mean number of scars on dominant and off hands? Specifically mention which boxplot(s) you are using to justify your answer.
Unlock Deck
Unlock for access to all 166 flashcards in this deck.
Unlock Deck
k this deck
78
Use the following
Students in a small statistics class were asked to count the number of scars both on their "dominant"
hand (the one they use most often) and on their "off"
hand. The summary statistics are provided. It is of interest to compare the average number of scars on the dominant and off hands.
-Construct a 90% confidence interval for the difference in mean number of scars on dominant and off hands. Round your margin of error to two decimal places.
Unlock Deck
Unlock for access to all 166 flashcards in this deck.
Unlock Deck
k this deck
79
Use the following
Students in a small statistics class were asked to count the number of scars both on their "dominant"
hand (the one they use most often) and on their "off"
hand. The summary statistics are provided. It is of interest to compare the average number of scars on the dominant and off hands.
-Test to see if the mean number of scars on dominant hands is significantly different from the mean number of scars on off hands. Use a 10% significance level. Include all of the details of the test.
Unlock Deck
Unlock for access to all 166 flashcards in this deck.
Unlock Deck
k this deck
80
A 2009 study to investigate the dominant paws in cats was described in Animal Behaviour (Volume 78, Issue 2). The researchers used a random sample of 42 domestic cats. In this study, each cat was shown a treat (5 grams of tuna), and while the cat watched, the food was placed inside a jar. The opening of the jar was small enough that the cat could not stick its head inside to remove the treat. The researcher recorded the paw that was first used by the cat to try to retrieve the treat. This was repeated 100 times for each cat (over a span of several days). The paw used most often was deemed the dominant paw (note that one cat used both paws equally and was classified as "ambidextrous"). The researchers were also interested in comparing the proportion of "left-pawed"
cats for male and female cats. Of the 21 male cats in the sample, 19 were classified as "left-pawed"
while only 1 of the 21 female cats were considered to be "left-pawed". Explain why it would not be appropriate to use the normal distribution to construct a confidence interval for the difference in the proportion of male and female cats that are "left-pawed".
Unlock Deck
Unlock for access to all 166 flashcards in this deck.
Unlock Deck
k this deck
Unlock Deck
Unlock for access to all 166 flashcards in this deck.


