Deck 14: Analysis of Variance Anova
Full screen (f)
Question
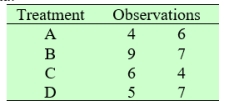
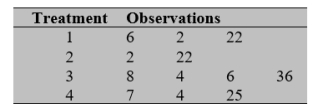
Consider the following data:
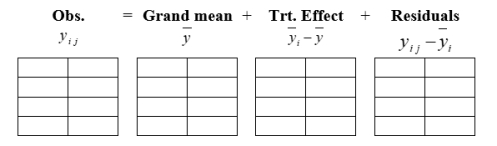
A) Obtain the arrays that show a decomposition for the observations. That is, complete the following arrays.
B) Find the sum of squares for each array. That is, find Treatment S.S, Residual S.S, Mean S.S, Total S.S, Total S.S (Corrected), respectively.
C) Determine the degrees of freedom for each sum of squares. That is, determine Error d.f.
and Treatment d.f., respectively.
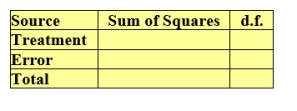
D) Summarize by completing the ANOVA table.
A) Obtain the arrays that show a decomposition for the observations. That is, complete the following arrays.
B) Find the sum of squares for each array. That is, find Treatment S.S, Residual S.S, Mean S.S, Total S.S, Total S.S (Corrected), respectively.
C) Determine the degrees of freedom for each sum of squares. That is, determine Error d.f.
and Treatment d.f., respectively.
D) Summarize by completing the ANOVA table.
Question
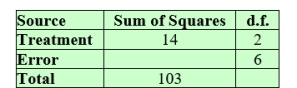
Use the relations for sums of squares and d.f. to complete the following ANOVA table.
Question
Perfect scores are not always attained in a test. Suppose the records from four different courses yield the following data on the number of perfect scores per test.
A) Provide a decomposition of the observations by completing the table.
B) Obtain the ANOVA table.
A) Provide a decomposition of the observations by completing the table.
B) Obtain the ANOVA table.
Question
The following table is associated with the average number of patients served,
0ver 6 days, at different months of the year.
 Present the ANOVA table for these data.
0ver 6 days, at different months of the year.
Present the ANOVA table for these data. Question
Question
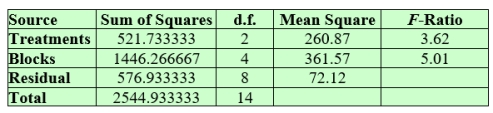
Consider the following ANOVA table.
 Carry out the F test for equality of means taking α = 0.010. Answer "The null hypothesis is rejected at level α = 0.010"
or "The null hypothesis is not rejected at level α = 0.010".
Carry out the F test for equality of means taking α = 0.010. Answer "The null hypothesis is rejected at level α = 0.010"or "The null hypothesis is not rejected at level α = 0.010".
Question
Consider the following ANOVA table.
 Test for equality of means using α = 0.100. Answer "H0 is rejected at α = 0.100"
or "H0 is not rejected at α = 0.100".
Test for equality of means using α = 0.100. Answer "H0 is rejected at α = 0.100"or "H0 is not rejected at α = 0.100".
Question
There are four lecture sessions for a Statistics course but all students take common exams. The following table is associated with the average class score in six 40 point
quizzes administered during the semester.
 Test for equality of means. Take α = 0.001. Answer "H0 is rejected at α = 0.001"
or "H0 is not rejected at α = 0.001".
quizzes administered during the semester.
Test for equality of means. Take α = 0.001. Answer "H0 is rejected at α = 0.001"or "H0 is not rejected at α = 0.001".
Question
Question
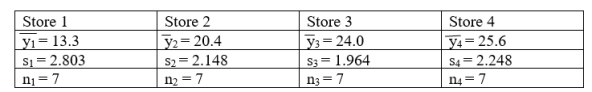
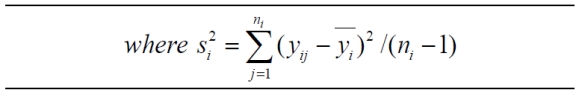
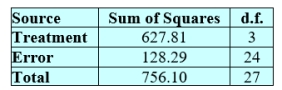
Four drug stores have a pharmacy which is open twenty-four hours a day. The following table is associated with the daily average number of patients served, outside of the normal hours 9 a.m. to 9 p.m. Data are collected each day of the week for one week.
 The ANOVA table for these data is shown below.
 Calculate a simultaneous 94% confidence interval for the difference in means .

The ANOVA table for these data is shown below. Calculate a simultaneous 94% confidence interval for the difference in means . Question
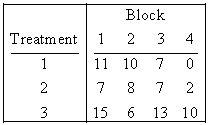
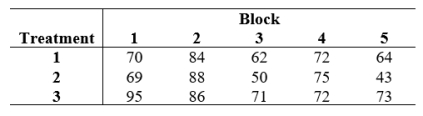
Consider the following data:
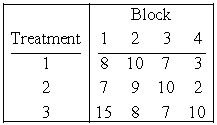
A) Provide a decomposition for the observation from these randomized block experiment. That is, complete the following tables.
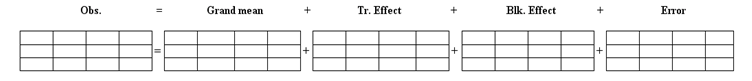 B) Find the sum of squares for each array. That is, find Treatment S.S, Block S.S, Residual S.S, Mean S.S, Total S.S, and Total S.S (corrected), respectively.
C) Determine the degrees of freedom by checking the constraints for each array. That is, find Treatment d.f., Block d.f., and Residual d.f, respectively.
A) Provide a decomposition for the observation from these randomized block experiment. That is, complete the following tables.
B) Find the sum of squares for each array. That is, find Treatment S.S, Block S.S, Residual S.S, Mean S.S, Total S.S, and Total S.S (corrected), respectively.C) Determine the degrees of freedom by checking the constraints for each array. That is, find Treatment d.f., Block d.f., and Residual d.f, respectively.
Question
Consider the following data:
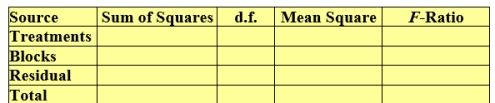
 Fill in the corresponding ANOVA table.
Fill in the corresponding ANOVA table. Question
Consider the following data:
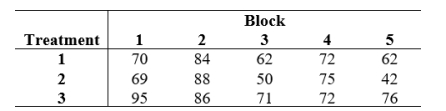 Perform an analysis of variance for these data. Use α = 0.05. Answer "The treatment effects are (are not) significant"
and "The block effects are (are not) significant".
Perform an analysis of variance for these data. Use α = 0.05. Answer "The treatment effects are (are not) significant"and "The block effects are (are not) significant".
Question
Consider the following ANOVA table with treatment means  = 70.20,
  = 65.40, and
  = 79.60.
 Obtain simultaneous confidence intervals for the pairwise differences in mean for the three treatments. Take α = 0.05.
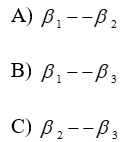
= 70.20, = 65.40, and = 79.60. Obtain simultaneous confidence intervals for the pairwise differences in mean for the three treatments. Take α = 0.05. Question
Consider the following data:
 Find the residuals array.
Find the residuals array. Question
16 Three processes for creating flame-retardant fabric are under con- sideration. Three dresses are made from Fabric A, two from Fabric B, and three from Fabric C. The response of interest is the verti- cal damage(inches) to the dress when a paper tab, attached to the bottom, is ignited.
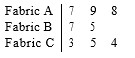
(a) Obtain the arrays that show a decomposition for the observa- tions.
(b) Create the ANOVA table.
(c) Conduct a test for equality of the three means. Take α = .05.
(a) Obtain the arrays that show a decomposition for the observa- tions.
(b) Create the ANOVA table.
(c) Conduct a test for equality of the three means. Take α = .05.

Unlock Deck
Sign up to unlock the cards in this deck!
Unlock Deck
Unlock Deck
1/16
Play
Full screen (f)
Deck 14: Analysis of Variance Anova
1
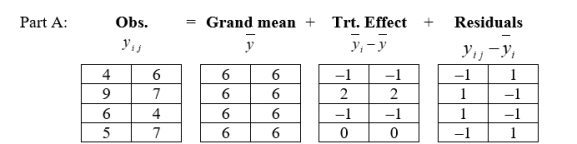
Consider the following data:
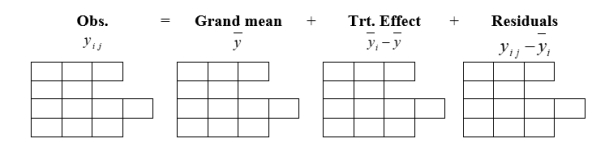
A) Obtain the arrays that show a decomposition for the observations. That is, complete the following arrays.
B) Find the sum of squares for each array. That is, find Treatment S.S, Residual S.S, Mean S.S, Total S.S, Total S.S (Corrected), respectively.
C) Determine the degrees of freedom for each sum of squares. That is, determine Error d.f.
and Treatment d.f., respectively.
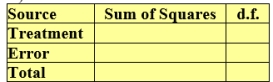
D) Summarize by completing the ANOVA table.
A) Obtain the arrays that show a decomposition for the observations. That is, complete the following arrays.
B) Find the sum of squares for each array. That is, find Treatment S.S, Residual S.S, Mean S.S, Total S.S, Total S.S (Corrected), respectively.
C) Determine the degrees of freedom for each sum of squares. That is, determine Error d.f.
and Treatment d.f., respectively.
D) Summarize by completing the ANOVA table.
Part A:
 Part B:
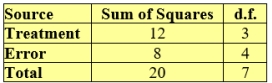
Treatment S.S = 12
Residual S.S = 8
Mean S.S = 288
Total S.S = 308
Total S.S (corrected) = 20
Part C:
Error d.f. = 4
Treatment d.f. = 3
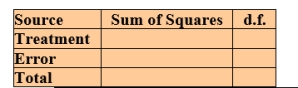
Part D:
Part B:Treatment S.S = 12
Residual S.S = 8
Mean S.S = 288
Total S.S = 308
Total S.S (corrected) = 20
Part C:
Error d.f. = 4
Treatment d.f. = 3
Part D:
2
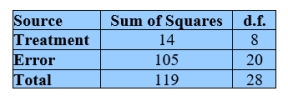
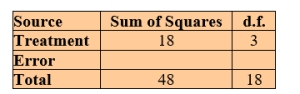
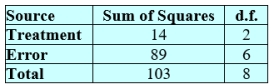
Use the relations for sums of squares and d.f. to complete the following ANOVA table.
3
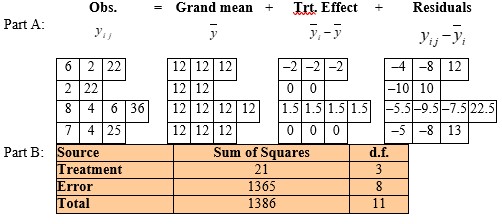
Perfect scores are not always attained in a test. Suppose the records from four different courses yield the following data on the number of perfect scores per test.
A) Provide a decomposition of the observations by completing the table.
B) Obtain the ANOVA table.
A) Provide a decomposition of the observations by completing the table.
B) Obtain the ANOVA table.
4
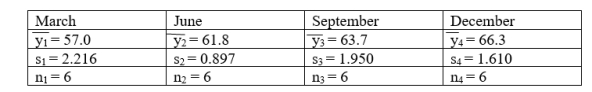
The following table is associated with the average number of patients served,
0ver 6 days, at different months of the year.
Present the ANOVA table for these data.
0ver 6 days, at different months of the year.
Present the ANOVA table for these data. Unlock Deck
Unlock for access to all 16 flashcards in this deck.
Unlock Deck
k this deck
5
Using the table of percentage points for the F distribution, find the upper 10% point when v1 = 8 and v2 = 120.
A) 1.72
B) 2.34
C) 2.02
A) 1.72
B) 2.34
C) 2.02
Unlock Deck
Unlock for access to all 16 flashcards in this deck.
Unlock Deck
k this deck
6
Consider the following ANOVA table.
Carry out the F test for equality of means taking α = 0.010. Answer "The null hypothesis is rejected at level α = 0.010"
or "The null hypothesis is not rejected at level α = 0.010".
Carry out the F test for equality of means taking α = 0.010. Answer "The null hypothesis is rejected at level α = 0.010"or "The null hypothesis is not rejected at level α = 0.010".
Unlock Deck
Unlock for access to all 16 flashcards in this deck.
Unlock Deck
k this deck
7
Consider the following ANOVA table.
Test for equality of means using α = 0.100. Answer "H0 is rejected at α = 0.100"
or "H0 is not rejected at α = 0.100".
Test for equality of means using α = 0.100. Answer "H0 is rejected at α = 0.100"or "H0 is not rejected at α = 0.100".
Unlock Deck
Unlock for access to all 16 flashcards in this deck.
Unlock Deck
k this deck
8
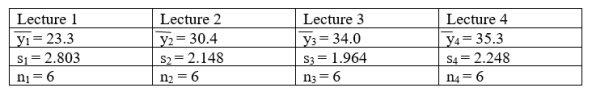
There are four lecture sessions for a Statistics course but all students take common exams. The following table is associated with the average class score in six 40 point
quizzes administered during the semester.
Test for equality of means. Take α = 0.001. Answer "H0 is rejected at α = 0.001"
or "H0 is not rejected at α = 0.001".
quizzes administered during the semester.
Test for equality of means. Take α = 0.001. Answer "H0 is rejected at α = 0.001"or "H0 is not rejected at α = 0.001".
Unlock Deck
Unlock for access to all 16 flashcards in this deck.
Unlock Deck
k this deck
9
Taking = 0.05 and n - k = 18, determine the appropriate percentile of the t distribution when calculating the multiple-t confidence intervals with m = 3.
Unlock Deck
Unlock for access to all 16 flashcards in this deck.
Unlock Deck
k this deck
10
Four drug stores have a pharmacy which is open twenty-four hours a day. The following table is associated with the daily average number of patients served, outside of the normal hours 9 a.m. to 9 p.m. Data are collected each day of the week for one week.
The ANOVA table for these data is shown below.
Calculate a simultaneous 94% confidence interval for the difference in means .
The ANOVA table for these data is shown below. Calculate a simultaneous 94% confidence interval for the difference in means . Unlock Deck
Unlock for access to all 16 flashcards in this deck.
Unlock Deck
k this deck
11
Consider the following data:
A) Provide a decomposition for the observation from these randomized block experiment. That is, complete the following tables.
B) Find the sum of squares for each array. That is, find Treatment S.S, Block S.S, Residual S.S, Mean S.S, Total S.S, and Total S.S (corrected), respectively.
C) Determine the degrees of freedom by checking the constraints for each array. That is, find Treatment d.f., Block d.f., and Residual d.f, respectively.
A) Provide a decomposition for the observation from these randomized block experiment. That is, complete the following tables.
B) Find the sum of squares for each array. That is, find Treatment S.S, Block S.S, Residual S.S, Mean S.S, Total S.S, and Total S.S (corrected), respectively.C) Determine the degrees of freedom by checking the constraints for each array. That is, find Treatment d.f., Block d.f., and Residual d.f, respectively.
Unlock Deck
Unlock for access to all 16 flashcards in this deck.
Unlock Deck
k this deck
12
Consider the following data:
Fill in the corresponding ANOVA table.
Fill in the corresponding ANOVA table. Unlock Deck
Unlock for access to all 16 flashcards in this deck.
Unlock Deck
k this deck
13
Consider the following data:
Perform an analysis of variance for these data. Use α = 0.05. Answer "The treatment effects are (are not) significant"
and "The block effects are (are not) significant".
Perform an analysis of variance for these data. Use α = 0.05. Answer "The treatment effects are (are not) significant"and "The block effects are (are not) significant".
Unlock Deck
Unlock for access to all 16 flashcards in this deck.
Unlock Deck
k this deck
14
Consider the following ANOVA table with treatment means = 70.20, = 65.40, and = 79.60.
Obtain simultaneous confidence intervals for the pairwise differences in mean for the three treatments. Take α = 0.05.
= 70.20, = 65.40, and = 79.60. Obtain simultaneous confidence intervals for the pairwise differences in mean for the three treatments. Take α = 0.05. Unlock Deck
Unlock for access to all 16 flashcards in this deck.
Unlock Deck
k this deck
15
Consider the following data:
Find the residuals array.
Find the residuals array. Unlock Deck
Unlock for access to all 16 flashcards in this deck.
Unlock Deck
k this deck
16
16 Three processes for creating flame-retardant fabric are under con- sideration. Three dresses are made from Fabric A, two from Fabric B, and three from Fabric C. The response of interest is the verti- cal damage(inches) to the dress when a paper tab, attached to the bottom, is ignited.
(a) Obtain the arrays that show a decomposition for the observa- tions.
(b) Create the ANOVA table.
(c) Conduct a test for equality of the three means. Take α = .05.
(a) Obtain the arrays that show a decomposition for the observa- tions.
(b) Create the ANOVA table.
(c) Conduct a test for equality of the three means. Take α = .05.
Unlock Deck
Unlock for access to all 16 flashcards in this deck.
Unlock Deck
k this deck
Unlock Deck
Unlock for access to all 16 flashcards in this deck.


