Deck 52: Population Ecology
Full screen (f)
Question
Question
Figure 52.2 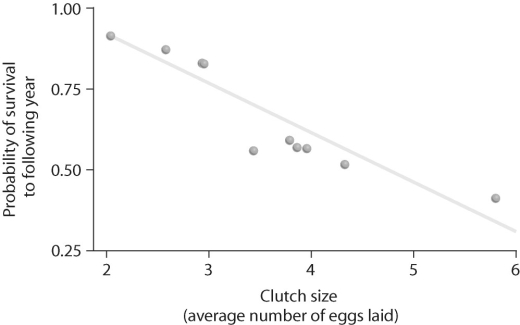
Looking at the data in Figure 52.2,what can be said about survival and clutch size?
A)Animals with low survival tend to have low clutch sizes.
B)High clutch sizes tend to produce animals with low survival.
C)Animals with high fecundity tend to live longer.
D)Animals with high fecundity tend not to live as long as animals with low fecundity.
Question
Figure 52.4 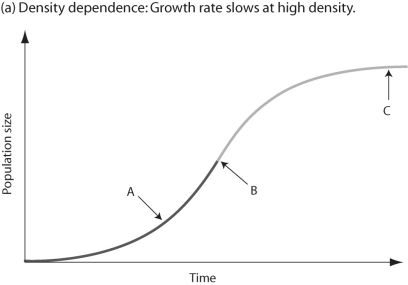
In Figure 52.4,which of the arrows represents the most rapid population growth?
A)arrow A
B)arrow B
C)arrow C
In Figure 52.4,which of the arrows represents the most rapid population growth?
A)arrow A
B)arrow B
C)arrow C
Question
Question
Figure 52.1 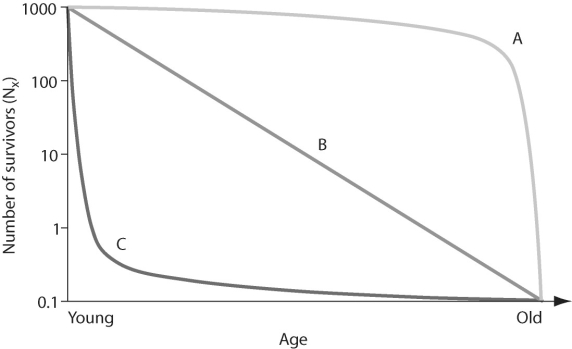
In Figure 52.1,which of the following survivorship curves implies that an animal may lay thousands of eggs,of which a regular number die each year on a logarithmic scale?
A)curve A
B)curve B
C)curve C
D)none of the above
In Figure 52.1,which of the following survivorship curves implies that an animal may lay thousands of eggs,of which a regular number die each year on a logarithmic scale?
A)curve A
B)curve B
C)curve C
D)none of the above
Question
Question
Figure 52.3 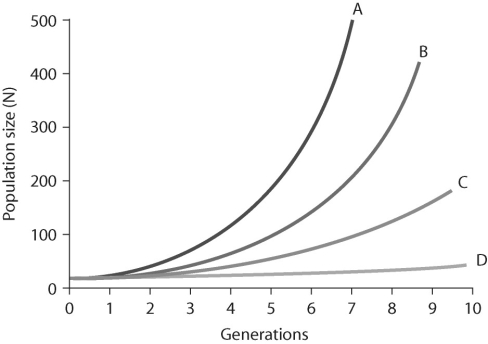
In Figure 52.3,which of the lines represents the highest per-capita rate increase (r)?
A)line A
B)line B
C)line C
D)line D
In Figure 52.3,which of the lines represents the highest per-capita rate increase (r)?
A)line A
B)line B
C)line C
D)line D
Question
Question
Question
Figure 52.3
In Figure 52.3,which of the lines represents exponential growth?
A)line A
B)line B
C)line C
D)line D
E)all of the above
In Figure 52.3,which of the lines represents exponential growth?
A)line A
B)line B
C)line C
D)line D
E)all of the above
Question
Question
Figure 52.4
In Figure 52.4,which of the arrows represents the carrying capacity?
A)arrow A
B)arrow B
C)arrow C
D)Carrying capacity cannot be found in the figure because species under density-dependent control never reach carrying capacity.
In Figure 52.4,which of the arrows represents the carrying capacity?
A)arrow A
B)arrow B
C)arrow C
D)Carrying capacity cannot be found in the figure because species under density-dependent control never reach carrying capacity.
Question
Figure 52.3
Assuming that these populations are density dependent,what is the likely outcome if the system depicted in Figure 52.3 were allowed to continue?
A)Population growth would continue to be discontinuous.
B)Individual growth would continue to be indeterminate.
C)Population growth would likely decrease.
D)Populations would go extinct.
Question
Figure 52.1
In Figure 52.1,which of the following survivorship curves most applies to humans living in developed countries?
A)curve A
B)curve B
C)curve C
D)curve A or curve B
E)none of the above
In Figure 52.1,which of the following survivorship curves most applies to humans living in developed countries?
A)curve A
B)curve B
C)curve C
D)curve A or curve B
E)none of the above
Question
Question
Figure 52.5 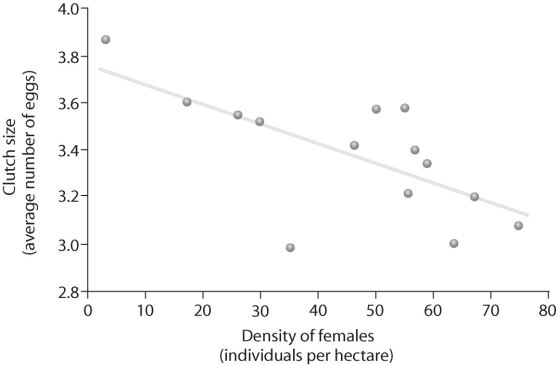
Based on Figure 52.5,which of the following statements correctly interprets the data?
A)Female density is affected by clutch size.
B)Clutch size is affected by female density.
C)Survivorship is affected by female density.
Based on Figure 52.5,which of the following statements correctly interprets the data?
A)Female density is affected by clutch size.
B)Clutch size is affected by female density.
C)Survivorship is affected by female density.
Question
Figure 52.1
In Figure 52.1,which of the following survivorship curves applies to most plant species?
A)curve A
B)curve B
C)curve C
D)none of the above
In Figure 52.1,which of the following survivorship curves applies to most plant species?
A)curve A
B)curve B
C)curve C
D)none of the above
Question
Question
Question
Question
Figure 52.10 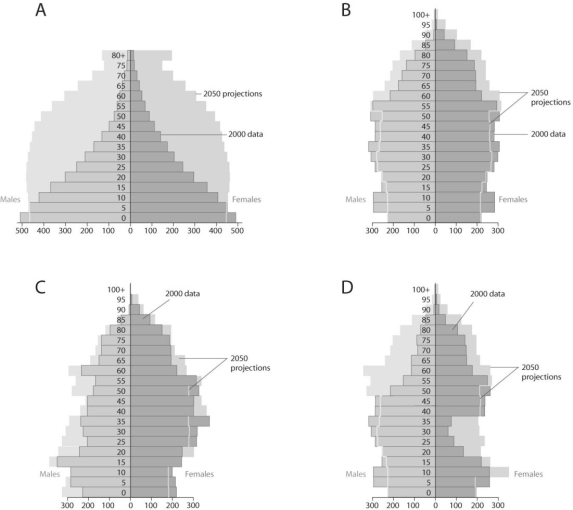
Based on the diagrams in Figure 52.10 and on the large population of baby boomers in the United States,what graph best reflects U.S.population in 20 years?
Based on the diagrams in Figure 52.10 and on the large population of baby boomers in the United States,what graph best reflects U.S.population in 20 years?
Question
Figure 52.12 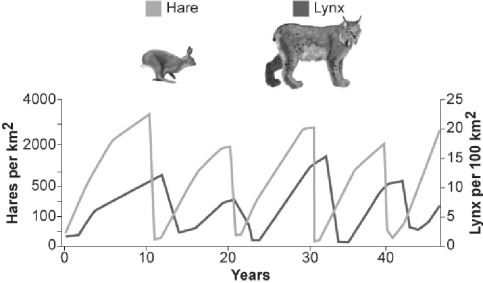
What conclusion can you draw from Figure 52.12?
A)Hares control lynx population size.
B)Lynx control hare population size.
C)Lynx and hare populations are independent of each other.
D)The relationship between the populations cannot be determined from this graph.
What conclusion can you draw from Figure 52.12?
A)Hares control lynx population size.
B)Lynx control hare population size.
C)Lynx and hare populations are independent of each other.
D)The relationship between the populations cannot be determined from this graph.
Question
Figure 52.11 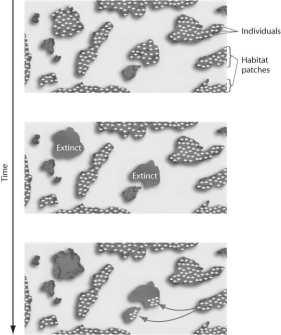
Figure 52.11 represents the dynamics of _____.
A)metapopulations
B)extinction
C)emigration
D)both metapopulations and extinction
E)both extinction and emigration
Figure 52.11 represents the dynamics of _____.
A)metapopulations
B)extinction
C)emigration
D)both metapopulations and extinction
E)both extinction and emigration
Question
Figure 52.6 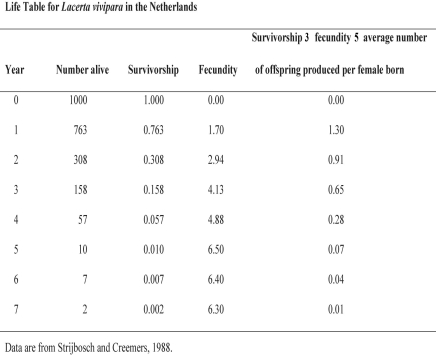
Using Figure 52.6,calculate the net reproductive rate (R₀)for this population.
A)2)00
B)3)26
C)1)30
D)2)31
Using Figure 52.6,calculate the net reproductive rate (R₀)for this population.
A)2)00
B)3)26
C)1)30
D)2)31
Question
Question
Question
Figure 52.8 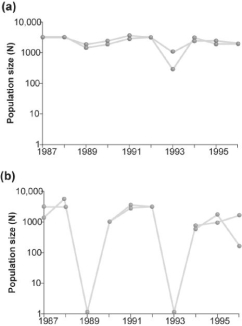
Which of the two graphs in Figure 52.8 shows a population of organisms that has a strong population cycle?
A)(a)
B)(b)
Which of the two graphs in Figure 52.8 shows a population of organisms that has a strong population cycle?
A)(a)
B)(b)
Question
Figure 52.5
Which statement about K is false?
A)K varies among populations.
B)K varies in space.
C)K varies in time.
D)K is specific for a given species.
Which statement about K is false?
A)K varies among populations.
B)K varies in space.
C)K varies in time.
D)K is specific for a given species.
Question
Question
Figure 52.7 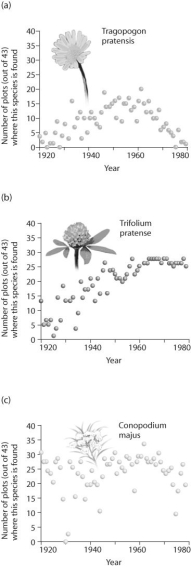
Based on the graphs from the Park Grass study in Rothamsted,UK (Figure 52.7),which species was most likely controlled by density-independent factors?
A)Tragopogon pratensis
B)Trifolium pratense
C)Conopodium majus
D)It does not appear that any of the species are under density-independent control and instead are mainly regulated by density-dependent factors.
E)All of the species appear to be controlled by density-independent factors.
Question
Figure 52.9 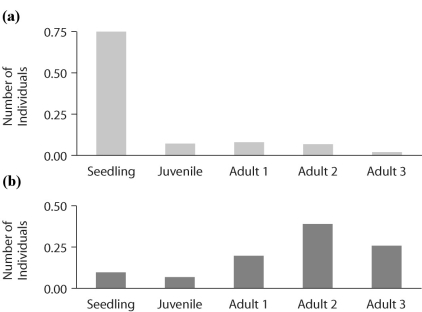
Which of the following statements about the graphs in Figure 52.9 is false?
A)Primrose populations in large gaps (high light)have many juveniles.
B)Primrose populations in small gaps (low light)have few juveniles.
C)The age structure of primrose determines the gap size.
D)All of the above statements are true.
Question
Question
Figure 52.9
Figure 52.9 shows the age structure of Common Primrose populations as they change over time.One of the populations is growing under high light conditions and the other under low light.Based on the graphs in Figure 52.9,which graph,(a)or (b),represents a population growing in high light availability?
A)(a)
B)(b)
C)cannot tell with this information
Question
Question
Figure 52.6
Using Figure 52.6,how would you describe the population dynamics of L.vivipara?
A)The population is increasing.
B)The population is decreasing.
C)The population is stable.
D)The figure does not provide this information.
Using Figure 52.6,how would you describe the population dynamics of L.vivipara?
A)The population is increasing.
B)The population is decreasing.
C)The population is stable.
D)The figure does not provide this information.
Question
Figure 52.6
Using Figure 52.6,determine which age class year would hurt the population growth most if it were wiped out by disease.
A)age class year 1
B)age class year 2
C)age class year 3
D)age class year 4
E)age class year 5
Using Figure 52.6,determine which age class year would hurt the population growth most if it were wiped out by disease.
A)age class year 1
B)age class year 2
C)age class year 3
D)age class year 4
E)age class year 5
Question
Figure 52.8
The graph (b)in Figure 52.8 shows the normal fluctuations of a population of grouse.Assuming graph (a)in Figure 52.8 is the result of some experimental treatment in the grouse population,what can be concluded?
A)The experimental treatment exacerbated the population cycling.
B)The experimental treatment did not affect population cycling in this species.
C)The experimental treatment has most likely identified the cause of population cycling.
D)None of the above answers applies.
Question
Figure 52.7
Based on the graphs in Figure 52.7 from the Park Grass study in Rothamsted,UK,which species is most likely the superior competitor?
A)Tragopogon pratensis
B)Trifolium pratense
C)Conopodium majus
D)From the information presented in the figure we cannot determine which species is the superior competitor.
Question
Question
Question
Figure 52.13 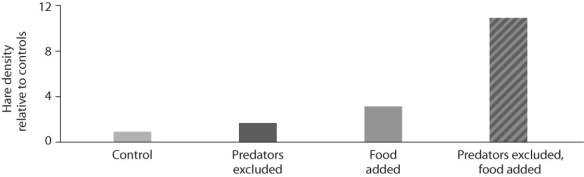
Looking at the data in Figure 52.13 from the hare/lynx experiment,what conclusion can you draw?
A)Food is a factor in controlling hare population size.
B)Excluding lynx are a factor in controlling hare population size.
C)The effect of excluding predators and adding food in the same experiment is greater than the sum of excluding lynx alone plus adding food alone.
D)Only A and B are correct.
E)Choices A,B,and C are correct.
Question
Question
Figure 52.14 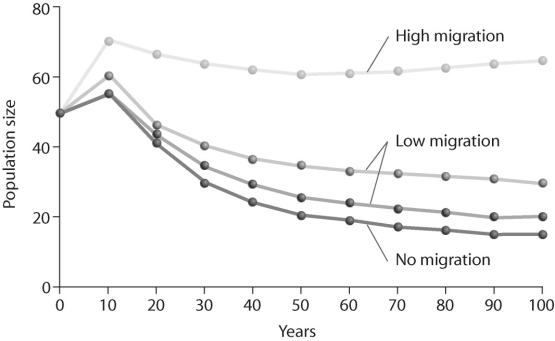
Looking at Figure 52.14,what is contributing significantly to stabilizing population size over time?
A)no migration
B)low migration
C)high migration
D)none of the above
Looking at Figure 52.14,what is contributing significantly to stabilizing population size over time?
A)no migration
B)low migration
C)high migration
D)none of the above
Question
Question
Question

Unlock Deck
Sign up to unlock the cards in this deck!
Unlock Deck
Unlock Deck
1/46
Play
Full screen (f)
Deck 52: Population Ecology
1
During the Lacerta vivipara lizard study,researchers monitored individuals on a daily basis to document the number of young produced by each female in the wild.What would be the best way to obtain the same type of data but not have to visit the site every day?
A)Capture animals and implant tracking devices.
B)Install cameras on-site to monitor lizard movement.
C)Capture animals twice per year and count them.
D)Try the study in an isolated population in the lab.
A)Capture animals and implant tracking devices.
B)Install cameras on-site to monitor lizard movement.
C)Capture animals twice per year and count them.
D)Try the study in an isolated population in the lab.
B
2
Figure 52.2
Looking at the data in Figure 52.2,what can be said about survival and clutch size?
A)Animals with low survival tend to have low clutch sizes.
B)High clutch sizes tend to produce animals with low survival.
C)Animals with high fecundity tend to live longer.
D)Animals with high fecundity tend not to live as long as animals with low fecundity.
D
3
Figure 52.4
In Figure 52.4,which of the arrows represents the most rapid population growth?
A)arrow A
B)arrow B
C)arrow C
In Figure 52.4,which of the arrows represents the most rapid population growth?
A)arrow A
B)arrow B
C)arrow C
B
4
The definition of a generation is _____.
A)20 years
B)the average time between a mother's first offspring and her daughter's first offspring
C)the average time between a father's first offspring and his son's first offspring
D)the average time between parents' first offspring and their child's first offspring
A)20 years
B)the average time between a mother's first offspring and her daughter's first offspring
C)the average time between a father's first offspring and his son's first offspring
D)the average time between parents' first offspring and their child's first offspring
Unlock Deck
Unlock for access to all 46 flashcards in this deck.
Unlock Deck
k this deck
5
Figure 52.1
In Figure 52.1,which of the following survivorship curves implies that an animal may lay thousands of eggs,of which a regular number die each year on a logarithmic scale?
A)curve A
B)curve B
C)curve C
D)none of the above
In Figure 52.1,which of the following survivorship curves implies that an animal may lay thousands of eggs,of which a regular number die each year on a logarithmic scale?
A)curve A
B)curve B
C)curve C
D)none of the above
Unlock Deck
Unlock for access to all 46 flashcards in this deck.
Unlock Deck
k this deck
6
Conservationists will take snow geese off the endangered species list when the population hits 10,000.If populations are sustaining growth at r = 0.088 and the population in 2001 is 3000 individuals,in what year will snow geese be taken off the endangered species list?
A)between 2106 and 2109
B)between 2009 and 2012
C)between 2012 and 2015
D)between 2015 and 2018
A)between 2106 and 2109
B)between 2009 and 2012
C)between 2012 and 2015
D)between 2015 and 2018
Unlock Deck
Unlock for access to all 46 flashcards in this deck.
Unlock Deck
k this deck
7
Figure 52.3
In Figure 52.3,which of the lines represents the highest per-capita rate increase (r)?
A)line A
B)line B
C)line C
D)line D
In Figure 52.3,which of the lines represents the highest per-capita rate increase (r)?
A)line A
B)line B
C)line C
D)line D
Unlock Deck
Unlock for access to all 46 flashcards in this deck.
Unlock Deck
k this deck
8
Which of these terms defines how the organism allocates resources to growth,reproduction,and activities or structures related to survival?
A)resource allocation
B)life history
C)energy budget
D)demography
A)resource allocation
B)life history
C)energy budget
D)demography
Unlock Deck
Unlock for access to all 46 flashcards in this deck.
Unlock Deck
k this deck
9
If 60 snow geese were alive in 1926 and 856 existed in 2001,what is r?
A)0)070
B)0)035
C)0)094
A)0)070
B)0)035
C)0)094
Unlock Deck
Unlock for access to all 46 flashcards in this deck.
Unlock Deck
k this deck
10
Figure 52.3
In Figure 52.3,which of the lines represents exponential growth?
A)line A
B)line B
C)line C
D)line D
E)all of the above
In Figure 52.3,which of the lines represents exponential growth?
A)line A
B)line B
C)line C
D)line D
E)all of the above
Unlock Deck
Unlock for access to all 46 flashcards in this deck.
Unlock Deck
k this deck
11
You observe two female fish of the same species breeding.One female lays 100 eggs and the other female lays 1000 eggs.Which one of the following statements does not agree with the concept of fitness trade-offs?
A)The female laying 100 eggs should be able to breed more often compared to the female laying 1000 eggs.
B)The female laying 100 eggs should live longer than the female laying 1000 eggs.
C)The eggs from the female laying 1000 eggs should have larger yolks compared to the yolks of the eggs from the female laying 100 eggs.
D)The female laying 1000 eggs should be larger than the female laying 100 eggs.
Unlock Deck
Unlock for access to all 46 flashcards in this deck.
Unlock Deck
k this deck
12
Figure 52.4
In Figure 52.4,which of the arrows represents the carrying capacity?
A)arrow A
B)arrow B
C)arrow C
D)Carrying capacity cannot be found in the figure because species under density-dependent control never reach carrying capacity.
In Figure 52.4,which of the arrows represents the carrying capacity?
A)arrow A
B)arrow B
C)arrow C
D)Carrying capacity cannot be found in the figure because species under density-dependent control never reach carrying capacity.
Unlock Deck
Unlock for access to all 46 flashcards in this deck.
Unlock Deck
k this deck
13
Figure 52.3
Assuming that these populations are density dependent,what is the likely outcome if the system depicted in Figure 52.3 were allowed to continue?
A)Population growth would continue to be discontinuous.
B)Individual growth would continue to be indeterminate.
C)Population growth would likely decrease.
D)Populations would go extinct.
Unlock Deck
Unlock for access to all 46 flashcards in this deck.
Unlock Deck
k this deck
14
Figure 52.1
In Figure 52.1,which of the following survivorship curves most applies to humans living in developed countries?
A)curve A
B)curve B
C)curve C
D)curve A or curve B
E)none of the above
In Figure 52.1,which of the following survivorship curves most applies to humans living in developed countries?
A)curve A
B)curve B
C)curve C
D)curve A or curve B
E)none of the above
Unlock Deck
Unlock for access to all 46 flashcards in this deck.
Unlock Deck
k this deck
15
The study of factors that determine the size and structure of populations through time is called _____.
A)population ecology
B)immigration and emigration
C)demography
D)populations
E)logistic growth
A)population ecology
B)immigration and emigration
C)demography
D)populations
E)logistic growth
Unlock Deck
Unlock for access to all 46 flashcards in this deck.
Unlock Deck
k this deck
16
Figure 52.5
Based on Figure 52.5,which of the following statements correctly interprets the data?
A)Female density is affected by clutch size.
B)Clutch size is affected by female density.
C)Survivorship is affected by female density.
Based on Figure 52.5,which of the following statements correctly interprets the data?
A)Female density is affected by clutch size.
B)Clutch size is affected by female density.
C)Survivorship is affected by female density.
Unlock Deck
Unlock for access to all 46 flashcards in this deck.
Unlock Deck
k this deck
17
Figure 52.1
In Figure 52.1,which of the following survivorship curves applies to most plant species?
A)curve A
B)curve B
C)curve C
D)none of the above
In Figure 52.1,which of the following survivorship curves applies to most plant species?
A)curve A
B)curve B
C)curve C
D)none of the above
Unlock Deck
Unlock for access to all 46 flashcards in this deck.
Unlock Deck
k this deck
18
Why can't a female lizard have both high fecundity and high survival?
A)In only rare cases,lizards have both high fecundity and high survival.
B)Female lizards are able to produce only one set of offspring.
C)Competition for resources prevents this.
D)The more energy the female devotes to offspring,the less that can be devoted to her survival.
E)The females are already maximizing the number of eggs she lays and if she attempts to nest later in the season there will not be enough food for her young.
Unlock Deck
Unlock for access to all 46 flashcards in this deck.
Unlock Deck
k this deck
19
It is estimated that snow geese will be able to sustain an r of 0.088 indefinitely.If the flock currently contains 3000 individuals,how long will it take to double?
A)7)9 years
B)34.1 years
C)264 years
A)7)9 years
B)34.1 years
C)264 years
Unlock Deck
Unlock for access to all 46 flashcards in this deck.
Unlock Deck
k this deck
20
What is the primary limiting factor that determines why no female animal can produce a very large number of very large eggs?
A)Time is limited.
B)There are energy constraints.
C)Temperature constraints will prevent females from carrying too many eggs.
D)Male availability is limited.
E)There will be an increase in predation pressure if the females carry too many large eggs.
A)Time is limited.
B)There are energy constraints.
C)Temperature constraints will prevent females from carrying too many eggs.
D)Male availability is limited.
E)There will be an increase in predation pressure if the females carry too many large eggs.
Unlock Deck
Unlock for access to all 46 flashcards in this deck.
Unlock Deck
k this deck
21
Figure 52.10
Based on the diagrams in Figure 52.10 and on the large population of baby boomers in the United States,what graph best reflects U.S.population in 20 years?
Based on the diagrams in Figure 52.10 and on the large population of baby boomers in the United States,what graph best reflects U.S.population in 20 years?
Unlock Deck
Unlock for access to all 46 flashcards in this deck.
Unlock Deck
k this deck
22
Figure 52.12
What conclusion can you draw from Figure 52.12?
A)Hares control lynx population size.
B)Lynx control hare population size.
C)Lynx and hare populations are independent of each other.
D)The relationship between the populations cannot be determined from this graph.
What conclusion can you draw from Figure 52.12?
A)Hares control lynx population size.
B)Lynx control hare population size.
C)Lynx and hare populations are independent of each other.
D)The relationship between the populations cannot be determined from this graph.
Unlock Deck
Unlock for access to all 46 flashcards in this deck.
Unlock Deck
k this deck
23
Figure 52.11
Figure 52.11 represents the dynamics of _____.
A)metapopulations
B)extinction
C)emigration
D)both metapopulations and extinction
E)both extinction and emigration
Figure 52.11 represents the dynamics of _____.
A)metapopulations
B)extinction
C)emigration
D)both metapopulations and extinction
E)both extinction and emigration
Unlock Deck
Unlock for access to all 46 flashcards in this deck.
Unlock Deck
k this deck
24
Figure 52.6
Using Figure 52.6,calculate the net reproductive rate (R₀)for this population.
A)2)00
B)3)26
C)1)30
D)2)31
Using Figure 52.6,calculate the net reproductive rate (R₀)for this population.
A)2)00
B)3)26
C)1)30
D)2)31
Unlock Deck
Unlock for access to all 46 flashcards in this deck.
Unlock Deck
k this deck
25
Suppose researchers marked 800 turtles and later were able to trap a total of 300 individuals in that population,of which 150 were marked.What is the estimate for total population size?
A)between 900 and 1200
B)between 1200 and 1500
C)between 1500 and 1800
D)between 1800 and 2100
E)It is impossible to estimate the total population size from the information given.
A)between 900 and 1200
B)between 1200 and 1500
C)between 1500 and 1800
D)between 1800 and 2100
E)It is impossible to estimate the total population size from the information given.
Unlock Deck
Unlock for access to all 46 flashcards in this deck.
Unlock Deck
k this deck
26
It is estimated that a flock of wood buffalo crane should be able to sustain an r of 0.085 for the foreseeable future.If the flock currently contains 350 individuals,how long will it take for that population to double?
A)between 7.0 and 9.0 years
B)between 9.0 and 11.0 years
C)between 11.0 and 13.0 years
D)less than 7 years
E)more than 13 years
A)between 7.0 and 9.0 years
B)between 9.0 and 11.0 years
C)between 11.0 and 13.0 years
D)less than 7 years
E)more than 13 years
Unlock Deck
Unlock for access to all 46 flashcards in this deck.
Unlock Deck
k this deck
27
Figure 52.8
Which of the two graphs in Figure 52.8 shows a population of organisms that has a strong population cycle?
A)(a)
B)(b)
Which of the two graphs in Figure 52.8 shows a population of organisms that has a strong population cycle?
A)(a)
B)(b)
Unlock Deck
Unlock for access to all 46 flashcards in this deck.
Unlock Deck
k this deck
28
Figure 52.5
Which statement about K is false?
A)K varies among populations.
B)K varies in space.
C)K varies in time.
D)K is specific for a given species.
Which statement about K is false?
A)K varies among populations.
B)K varies in space.
C)K varies in time.
D)K is specific for a given species.
Unlock Deck
Unlock for access to all 46 flashcards in this deck.
Unlock Deck
k this deck
29
Projections for Earth's human population by 2050 that were made in 1992 were much higher than those made in 2002.Which of the following did not likely contribute to this change in projection?
A)Human fertility rates in developing countries have significantly decreased since 1992.
B)Deaths from AIDS have significantly increased since 1992.
C)The number of developed countries has significantly increased since 1992.
D)The birth rates in developed countries have decreased since 1992.
A)Human fertility rates in developing countries have significantly decreased since 1992.
B)Deaths from AIDS have significantly increased since 1992.
C)The number of developed countries has significantly increased since 1992.
D)The birth rates in developed countries have decreased since 1992.
Unlock Deck
Unlock for access to all 46 flashcards in this deck.
Unlock Deck
k this deck
30
Figure 52.7
Based on the graphs from the Park Grass study in Rothamsted,UK (Figure 52.7),which species was most likely controlled by density-independent factors?
A)Tragopogon pratensis
B)Trifolium pratense
C)Conopodium majus
D)It does not appear that any of the species are under density-independent control and instead are mainly regulated by density-dependent factors.
E)All of the species appear to be controlled by density-independent factors.
Unlock Deck
Unlock for access to all 46 flashcards in this deck.
Unlock Deck
k this deck
31
Figure 52.9
Which of the following statements about the graphs in Figure 52.9 is false?
A)Primrose populations in large gaps (high light)have many juveniles.
B)Primrose populations in small gaps (low light)have few juveniles.
C)The age structure of primrose determines the gap size.
D)All of the above statements are true.
Unlock Deck
Unlock for access to all 46 flashcards in this deck.
Unlock Deck
k this deck
32
Which of the following statements regarding the future of populations in developing countries is false?
A)Overall population size will increase dramatically.
B)Survivorship will increase.
C)The fecundity is predicted to increase.
D)The number of offspring each year is predicted to remain high.
A)Overall population size will increase dramatically.
B)Survivorship will increase.
C)The fecundity is predicted to increase.
D)The number of offspring each year is predicted to remain high.
Unlock Deck
Unlock for access to all 46 flashcards in this deck.
Unlock Deck
k this deck
33
Figure 52.9
Figure 52.9 shows the age structure of Common Primrose populations as they change over time.One of the populations is growing under high light conditions and the other under low light.Based on the graphs in Figure 52.9,which graph,(a)or (b),represents a population growing in high light availability?
A)(a)
B)(b)
C)cannot tell with this information
Unlock Deck
Unlock for access to all 46 flashcards in this deck.
Unlock Deck
k this deck
34
What can we not determine from examining age pyramids of human populations?
A)the future population size
B)how populations reproduce
C)the success of future generations
D)the fecundity of a future population
E)the age structure of the population
A)the future population size
B)how populations reproduce
C)the success of future generations
D)the fecundity of a future population
E)the age structure of the population
Unlock Deck
Unlock for access to all 46 flashcards in this deck.
Unlock Deck
k this deck
35
Figure 52.6
Using Figure 52.6,how would you describe the population dynamics of L.vivipara?
A)The population is increasing.
B)The population is decreasing.
C)The population is stable.
D)The figure does not provide this information.
Using Figure 52.6,how would you describe the population dynamics of L.vivipara?
A)The population is increasing.
B)The population is decreasing.
C)The population is stable.
D)The figure does not provide this information.
Unlock Deck
Unlock for access to all 46 flashcards in this deck.
Unlock Deck
k this deck
36
Figure 52.6
Using Figure 52.6,determine which age class year would hurt the population growth most if it were wiped out by disease.
A)age class year 1
B)age class year 2
C)age class year 3
D)age class year 4
E)age class year 5
Using Figure 52.6,determine which age class year would hurt the population growth most if it were wiped out by disease.
A)age class year 1
B)age class year 2
C)age class year 3
D)age class year 4
E)age class year 5
Unlock Deck
Unlock for access to all 46 flashcards in this deck.
Unlock Deck
k this deck
37
Figure 52.8
The graph (b)in Figure 52.8 shows the normal fluctuations of a population of grouse.Assuming graph (a)in Figure 52.8 is the result of some experimental treatment in the grouse population,what can be concluded?
A)The experimental treatment exacerbated the population cycling.
B)The experimental treatment did not affect population cycling in this species.
C)The experimental treatment has most likely identified the cause of population cycling.
D)None of the above answers applies.
Unlock Deck
Unlock for access to all 46 flashcards in this deck.
Unlock Deck
k this deck
38
Figure 52.7
Based on the graphs in Figure 52.7 from the Park Grass study in Rothamsted,UK,which species is most likely the superior competitor?
A)Tragopogon pratensis
B)Trifolium pratense
C)Conopodium majus
D)From the information presented in the figure we cannot determine which species is the superior competitor.
Unlock Deck
Unlock for access to all 46 flashcards in this deck.
Unlock Deck
k this deck
39
The regular fluctuations in size of animal populations are termed _____.
A)population cycles
B)population dynamics
C)growth factors
D)all of the above
A)population cycles
B)population dynamics
C)growth factors
D)all of the above
Unlock Deck
Unlock for access to all 46 flashcards in this deck.
Unlock Deck
k this deck
40
If 40 individuals were alive in 1921 and 856 existed in 2007,what is r?
A)0)020
B)0)249
C)0)05
D)0)036
A)0)020
B)0)249
C)0)05
D)0)036
Unlock Deck
Unlock for access to all 46 flashcards in this deck.
Unlock Deck
k this deck
41
Figure 52.13
Looking at the data in Figure 52.13 from the hare/lynx experiment,what conclusion can you draw?
A)Food is a factor in controlling hare population size.
B)Excluding lynx are a factor in controlling hare population size.
C)The effect of excluding predators and adding food in the same experiment is greater than the sum of excluding lynx alone plus adding food alone.
D)Only A and B are correct.
E)Choices A,B,and C are correct.
Unlock Deck
Unlock for access to all 46 flashcards in this deck.
Unlock Deck
k this deck
42
Use the following abstract from Theoretical Population Biology to answer the corresponding question(s).
Abstract:
We derive measures for assessing the value of an individual habitat fragment for the dynamics and persistence of a metapopulation living in a network of many fragments.We demonstrate that the most appropriate measure of fragment value depends on the question asked.Specifically,we analyse four alternative measures: the contribution of a fragment to the metapopulation capacity of the network,to the equilibrium metapopulation size,to the expected time to metapopulation extinction and the long-term contribution of a fragment to colonization events in the network.The latter measure is comparable to density-dependent measures in general matrix population theory,though some differences are introduced by the fact that "density dependence" is spatially localized in the metapopulation context.We show that the value of a fragment depends not only on the properties of the landscape but also on the properties of the species.Most importantly,variation in fragment values between the habitat fragments is greatest in the case of rare species that occur close to the extinction threshold,as these species are likely to be restricted to the most favorable parts of the landscape.We expect that the measures of habitat fragment described and analysed here have applications in landscape ecology and in conservation biology.
One measure for the value of the patch was given by the long-term contribution of a fragment to colonization events in the network.How do the properties of a landscape and the properties of a species affect the value of a patch?
A)The value of the fragment depends on the properties of the landscape and the properties of the species.
B)The value of the fragment depends only on the properties of the landscape and not on the properties of the species.
C)The value of the fragment depends not on the properties of the landscape but only on the properties of the species.
D)The value of the fragment depends on neither the properties of the landscape nor on the properties of the species.
Unlock Deck
Unlock for access to all 46 flashcards in this deck.
Unlock Deck
k this deck
43
Figure 52.14
Looking at Figure 52.14,what is contributing significantly to stabilizing population size over time?
A)no migration
B)low migration
C)high migration
D)none of the above
Looking at Figure 52.14,what is contributing significantly to stabilizing population size over time?
A)no migration
B)low migration
C)high migration
D)none of the above
Unlock Deck
Unlock for access to all 46 flashcards in this deck.
Unlock Deck
k this deck
44
Use the following abstract from Theoretical Population Biology to answer the corresponding question(s).
Abstract:
We derive measures for assessing the value of an individual habitat fragment for the dynamics and persistence of a metapopulation living in a network of many fragments.We demonstrate that the most appropriate measure of fragment value depends on the question asked.Specifically,we analyse four alternative measures: the contribution of a fragment to the metapopulation capacity of the network,to the equilibrium metapopulation size,to the expected time to metapopulation extinction and the long-term contribution of a fragment to colonization events in the network.The latter measure is comparable to density-dependent measures in general matrix population theory,though some differences are introduced by the fact that "density dependence" is spatially localized in the metapopulation context.We show that the value of a fragment depends not only on the properties of the landscape but also on the properties of the species.Most importantly,variation in fragment values between the habitat fragments is greatest in the case of rare species that occur close to the extinction threshold,as these species are likely to be restricted to the most favorable parts of the landscape.We expect that the measures of habitat fragment described and analysed here have applications in landscape ecology and in conservation biology.
Based on the information in the abstract,which of the following statements is the most correct?
A)If long-term contribution to colonization of a fragment increases,the metapopulation would destabilize.
B)If long-term contribution to colonization of a fragment decreases,the metapopulation would stabilize.
C)If long-term contribution to colonization of a fragment increases,the metapopulation would have more fragments.
D)If long-term contribution to colonization of a fragment decreases,the metapopulation would disappear.
E)If long-term contribution to colonization of a fragment increases,the metapopulation would grow exponentially.
Unlock Deck
Unlock for access to all 46 flashcards in this deck.
Unlock Deck
k this deck
45
A model that estimates the likelihood that a population will avoid extinction for a given period of time is called a(n)_____.
A)metapopulation
B)population viability analysis
C)age pyramid
D)life table
A)metapopulation
B)population viability analysis
C)age pyramid
D)life table
Unlock Deck
Unlock for access to all 46 flashcards in this deck.
Unlock Deck
k this deck
46
Given that fertility rate is defined as each woman producing exactly enough offspring to replace herself and her offspring's father,if the fertility rate is sustained for a generation _____.
A)r = 0 and there is zero population growth
B)0 < r < 1
C)r = 1
D)r > 1
E)population size is at carrying capacity
A)r = 0 and there is zero population growth
B)0 < r < 1
C)r = 1
D)r > 1
E)population size is at carrying capacity
Unlock Deck
Unlock for access to all 46 flashcards in this deck.
Unlock Deck
k this deck
Unlock Deck
Unlock for access to all 46 flashcards in this deck.


