Deck 54: Ecosystems
Full screen (f)
Question
Figure 54.5 
After looking at Figure 54.5,what can be said about productivity in this ecosystem?
A)Nothing can be said based on this information.
B)Between 80% and 90% of the energy is lost at the next highest trophic level.
C)Between 10% and 20% of the energy is lost at the next highest trophic level.
D)Productivity increases with each trophic level.
E)Secondary consumers are more efficient than primary consumers at assimilating energy from the next lowest trophic level.
Question
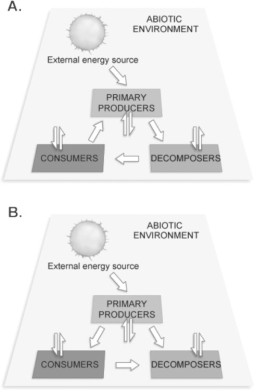
Figure 54.1
How are the components in Figure 54.1 linked by the flow of energy?

How are the components in Figure 54.1 linked by the flow of energy?
Question
Question
Figure 54.3 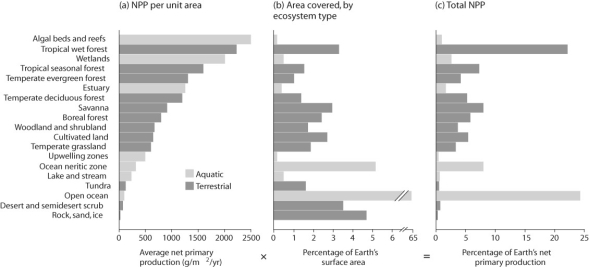
Which habitat type in Figure 54.3 makes available the most new tissue to consumers?
A)tropical wet forest
B)open ocean
C)algal beds and reefs
D)wetlands
Which habitat type in Figure 54.3 makes available the most new tissue to consumers?
A)tropical wet forest
B)open ocean
C)algal beds and reefs
D)wetlands
Question
Question
Figure 54.5
Why is energy lost when herbivores eat primary producers?
A)Primary producers have energy stored in indigestible substances.
B)Primary producers cannot produce once eaten.
C)Digestion takes place so rapidly that very little energy is absorbed.
D)Most primary producers contain no usable energy for herbivores.
Question
Figure 54.6 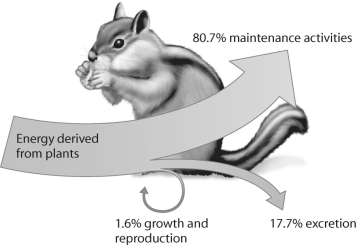
In Figure 54.6,which number represents secondary production?
A)1)6%
B)17.7%
C)80.7%
D)none of the above
In Figure 54.6,which number represents secondary production?
A)1)6%
B)17.7%
C)80.7%
D)none of the above
Question
Question
Figure 54.5
Plants never use 100% of the incoming solar radiation for photosynthesis on a yearly basis.What is a reasonable explanation for this?
A)Plants cannot photosynthesize during winter (in cold winter climates).
B)Plants cannot photosynthesize on cloudy days.
C)The pigments that drive photosynthesis respond to only a fraction of the wavelengths available,and plants cannot photosynthesize on cloudy days.
D)The pigments that drive photosynthesis respond to only a fraction of the wavelengths available,and plants cannot photosynthesize during winter (in cold winter climates).
E)The pigments that drive photosynthesis respond to only a fraction of the wavelengths available,and plants cannot photosynthesize during dry periods.
Question
Figure 54.4 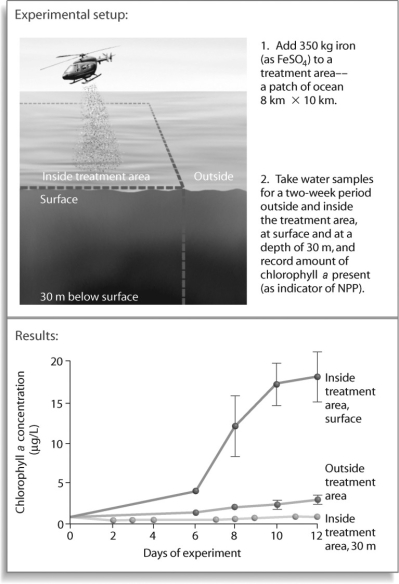
What is the main reason for using food webs instead of food chains in analyzing ecosystems?
A)Most organisms eat more than one type of food.
B)Most organisms feed at several trophic levels.
C)The decomposition cycle needs to be shown.
D)Most organisms eat more than one type of food and feed at several trophic levels.
E)Most organisms eat more than one type of food and feed at several trophic levels.The decomposition cycle needs to be shown.
Question
Question
Figure 54.6
Which of the following statements about secondary production is true?
A)Endotherms have higher metabolic rates compared to ectotherms and therefore have higher secondary production.
B)Ectotherms have higher metabolic rates compared to endotherms and therefore have higher secondary production.
C)Endotherms use less internal energy for metabolism and therefore have higher rates of secondary production.
D)Ectotherms use less internal energy for metabolism and therefore have higher rates of secondary production.
Question
Figure 54.3
Considering its total area covered,which ecosystem type represented in Figure 54.3 has a very low level of economic impact on Earth's ecosystem?
A)tropical wet forest
B)rock,sand,and ice
C)tropical seasonal forest
D)ocean neritic zone
Considering its total area covered,which ecosystem type represented in Figure 54.3 has a very low level of economic impact on Earth's ecosystem?
A)tropical wet forest
B)rock,sand,and ice
C)tropical seasonal forest
D)ocean neritic zone
Question
Figure 54.3
What is the leading hypothesis as to why terrestrial productivity is higher in equatorial climates?
A)Productivity increases with temperature.
B)Productivity increases with water availability.
C)Productivity increases with available sunlight.
D)The hypothesis is most likely a combination of the other answers.
Question
Figure 54.4
After looking at the experiment in Figure 54.4,what can be said about productivity in marine ecosystems?
A)Nothing can be said based on this information.
B)Marine organisms break down iron for energy and thus for productivity.
C)Iron can be a limiting nutrient in productivity.
D)Productivity increases when chlorophyll a is added.
Question
Figure 54.5
If plants in a northern temperate area use 26,400 kcal/m² of energy from solar radiation in photosynthesis,and the total amount of solar radiation energy reaching that area is 2,640,000 kcal/m²,what is the overall gross photosynthetic efficiency?
A)0)01%
B)0)1%
C)1%
D)100%
If plants in a northern temperate area use 26,400 kcal/m² of energy from solar radiation in photosynthesis,and the total amount of solar radiation energy reaching that area is 2,640,000 kcal/m²,what is the overall gross photosynthetic efficiency?
A)0)01%
B)0)1%
C)1%
D)100%
Question
Figure 54.4
Detritus can be consumed by which of the following primary decomposers?
A)bacteria
B)archaea
C)fungi
D)earthworms
E)all of the above
Detritus can be consumed by which of the following primary decomposers?
A)bacteria
B)archaea
C)fungi
D)earthworms
E)all of the above
Question
Figure 54.3
Which category in Figure 54.3 makes available the highest productivity per square meter?
A)tropical wet forest
B)open ocean
C)algal beds and reefs
D)wetlands
Which category in Figure 54.3 makes available the highest productivity per square meter?
A)tropical wet forest
B)open ocean
C)algal beds and reefs
D)wetlands
Question
Figure 54.3
Which habitat types in Figure 54.3 cover the largest area?
A)tropical wet forest plus the ocean neritic zone
B)open ocean
C)algal beds and reefs plus the ocean neritic zone
D)wetlands plus the ocean neritic zone
Which habitat types in Figure 54.3 cover the largest area?
A)tropical wet forest plus the ocean neritic zone
B)open ocean
C)algal beds and reefs plus the ocean neritic zone
D)wetlands plus the ocean neritic zone
Question
Figure 54.3
Figure 54.3 represents net primary productivity in what way?
A)organized by biome
B)organized by geography
C)organized by region
D)randomly organized
Figure 54.3 represents net primary productivity in what way?
A)organized by biome
B)organized by geography
C)organized by region
D)randomly organized
Question
Question
Figure 54.10 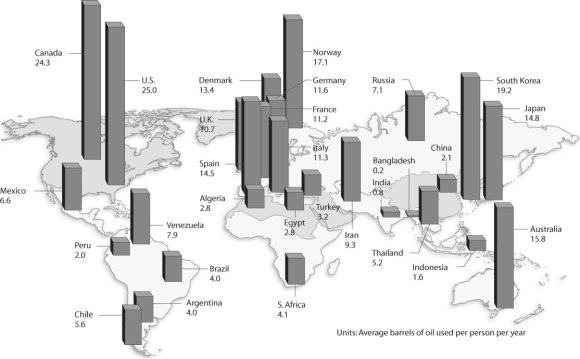
Upon looking at Figure 54.10,what can be concluded?
A)Residents in colder climates use more energy per person.
B)Residents of industrialized countries use more energy per person.
C)Residents of more populated countries use more energy per person.
D)English-speaking countries tend to use more energy per person.
Question
Question
Question
Question
Figure 54.10
Based on Figure 54.10,and given the populations of the following countries,which country uses the most oil overall?
A)United States (population = 300 million)
B)Canada (population = 33 million)
C)China (population = 1.32 billion)
D)Russia (population = 142 million)
E)United Kingdom (population = 60 million)
Question
Figure 54.7 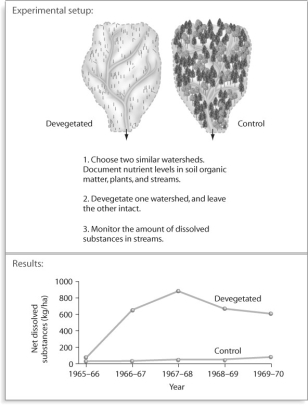
Based on the experiment in Figure 54.7,all of the following are plausible reasons for the result except _____.
A)nutrients evaporate now that vegetation is absent
B)nutrients dissolve in the water running through the watershed
C)nutrients are attached to small particles of sand or clay that leave the watershed
D)plant roots that held soil particles in place are no longer there
Question
Question
Question
Figure 54.8 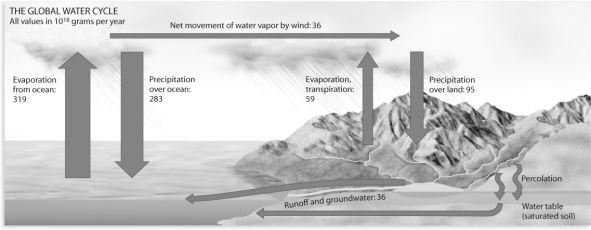
Which of the following human activities is impacting the water cycle the least?
A)increase in asphalt and concrete surfaces
B)conversion of grasslands and forests into agricultural fields
C)increased processing of salt water to freshwater
D)increases in irrigated agriculture
Which of the following human activities is impacting the water cycle the least?
A)increase in asphalt and concrete surfaces
B)conversion of grasslands and forests into agricultural fields
C)increased processing of salt water to freshwater
D)increases in irrigated agriculture
Question
Question
Figure 54.8
Considering the global water cycle depicted in Figure 54.8,where does one find the largest amount of water changing phases?
A)groundwater runoff to oceans
B)movement of water vapor from ocean to land
C)evaporation/transpiration and precipitation over land
D)evaporation and precipitation over the oceans
E)all of the above show equal amounts of water changing between phases
Question
Question
Question
Question
Figure 54.9 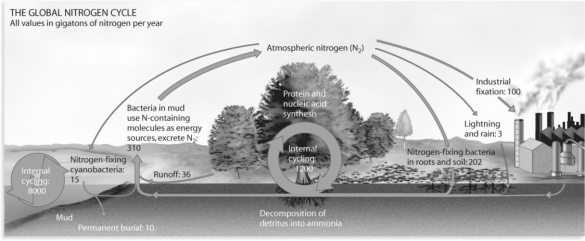
Considering the global nitrogen cycle depicted in Figure 54.9,what is the limiting portion of the cycle for plants?
A)industrial nitrogen fixation
B)nitrogen lost to the atmosphere
C)internal nitrogen cycling in the oceans
D)nitrogen fixation by bacteria
Considering the global nitrogen cycle depicted in Figure 54.9,what is the limiting portion of the cycle for plants?
A)industrial nitrogen fixation
B)nitrogen lost to the atmosphere
C)internal nitrogen cycling in the oceans
D)nitrogen fixation by bacteria
Question
Figure 54.9
Which of the following is not a source of human-fixed nitrogen?
A)industrially produced fertilizers
B)cultivation of soybeans
C)combustion of fossil fuels
D)irrigation agriculture
Which of the following is not a source of human-fixed nitrogen?
A)industrially produced fertilizers
B)cultivation of soybeans
C)combustion of fossil fuels
D)irrigation agriculture
Question
Figure 54.7
After looking at the experiment in Figure 54.7,what can be said about nutrient export in ecosystems?
A)Nutrient export is typically 10 times lower in a clear-cut watershed.
B)Nutrient export is typically 10 times higher in a clear-cut watershed.
C)Nutrient export is typically 10 times higher in an uncut watershed.
D)Nutrient export is not affected by any form of cutting.
Question
Figure 54.9
How much nitrogen is fixed from human processes?
A)It is equal to the amount fixed by natural means.
B)It is about half that fixed by natural means.
C)It is about double that fixed by natural means.
D)We cannot calculate this value.
How much nitrogen is fixed from human processes?
A)It is equal to the amount fixed by natural means.
B)It is about half that fixed by natural means.
C)It is about double that fixed by natural means.
D)We cannot calculate this value.
Question
Figure 54.9
Considering the global nitrogen cycle,how are humans altering this cycle?
A)industrial nitrogen fixation
B)nitrogen lost to the atmosphere
C)reduction of nitrogen available to terrestrial ecosystems
D)reduction of nitrogen fixation by bacteria
E)permanent burial of nitrogen in coastal environments through runoff
Question

Unlock Deck
Sign up to unlock the cards in this deck!
Unlock Deck
Unlock Deck
1/41
Play
Full screen (f)
Deck 54: Ecosystems
1
Figure 54.5
After looking at Figure 54.5,what can be said about productivity in this ecosystem?
A)Nothing can be said based on this information.
B)Between 80% and 90% of the energy is lost at the next highest trophic level.
C)Between 10% and 20% of the energy is lost at the next highest trophic level.
D)Productivity increases with each trophic level.
E)Secondary consumers are more efficient than primary consumers at assimilating energy from the next lowest trophic level.
B
2
Figure 54.1
How are the components in Figure 54.1 linked by the flow of energy?
How are the components in Figure 54.1 linked by the flow of energy?
B
3
At the Hubbard Brook Experimental Forest in New Hampshire,how did large amounts of energy leave the decomposer food web?
A)Energy was lost through incomplete decomposition.
B)Detritus was washed away into streams during heavy rain.
C)Detritus was sublimated by increased solar radiation.
D)Large numbers of decomposers emigrated from the area.
A)Energy was lost through incomplete decomposition.
B)Detritus was washed away into streams during heavy rain.
C)Detritus was sublimated by increased solar radiation.
D)Large numbers of decomposers emigrated from the area.
B
4
Figure 54.3
Which habitat type in Figure 54.3 makes available the most new tissue to consumers?
A)tropical wet forest
B)open ocean
C)algal beds and reefs
D)wetlands
Which habitat type in Figure 54.3 makes available the most new tissue to consumers?
A)tropical wet forest
B)open ocean
C)algal beds and reefs
D)wetlands
Unlock Deck
Unlock for access to all 41 flashcards in this deck.
Unlock Deck
k this deck
5
You own 300 acres of patchy temperate forest.Which one of the following actions would increase the net primary productivity of the area the most?
A)adding fertilizer to the entire area
B)introducing 100 rabbits into the area
C)planting 500 new trees
D)relocating all of the deer found in the area
A)adding fertilizer to the entire area
B)introducing 100 rabbits into the area
C)planting 500 new trees
D)relocating all of the deer found in the area
Unlock Deck
Unlock for access to all 41 flashcards in this deck.
Unlock Deck
k this deck
6
Figure 54.5
Why is energy lost when herbivores eat primary producers?
A)Primary producers have energy stored in indigestible substances.
B)Primary producers cannot produce once eaten.
C)Digestion takes place so rapidly that very little energy is absorbed.
D)Most primary producers contain no usable energy for herbivores.
Unlock Deck
Unlock for access to all 41 flashcards in this deck.
Unlock Deck
k this deck
7
Figure 54.6
In Figure 54.6,which number represents secondary production?
A)1)6%
B)17.7%
C)80.7%
D)none of the above
In Figure 54.6,which number represents secondary production?
A)1)6%
B)17.7%
C)80.7%
D)none of the above
Unlock Deck
Unlock for access to all 41 flashcards in this deck.
Unlock Deck
k this deck
8
Figure 54.1
When primary producers expend energy to build new tissue,this is _____.
A)net primary productivity
B)the amount of energy available to consumers
C)maintenance costs
D)net primary productivity and the amount of energy available to consumers
E)maintenance costs and the amount of energy available to consumers
Unlock Deck
Unlock for access to all 41 flashcards in this deck.
Unlock Deck
k this deck
9
Figure 54.5
Plants never use 100% of the incoming solar radiation for photosynthesis on a yearly basis.What is a reasonable explanation for this?
A)Plants cannot photosynthesize during winter (in cold winter climates).
B)Plants cannot photosynthesize on cloudy days.
C)The pigments that drive photosynthesis respond to only a fraction of the wavelengths available,and plants cannot photosynthesize on cloudy days.
D)The pigments that drive photosynthesis respond to only a fraction of the wavelengths available,and plants cannot photosynthesize during winter (in cold winter climates).
E)The pigments that drive photosynthesis respond to only a fraction of the wavelengths available,and plants cannot photosynthesize during dry periods.
Unlock Deck
Unlock for access to all 41 flashcards in this deck.
Unlock Deck
k this deck
10
Figure 54.4
What is the main reason for using food webs instead of food chains in analyzing ecosystems?
A)Most organisms eat more than one type of food.
B)Most organisms feed at several trophic levels.
C)The decomposition cycle needs to be shown.
D)Most organisms eat more than one type of food and feed at several trophic levels.
E)Most organisms eat more than one type of food and feed at several trophic levels.The decomposition cycle needs to be shown.
Unlock Deck
Unlock for access to all 41 flashcards in this deck.
Unlock Deck
k this deck
11
Figure 54.1
Which of the following consume other living organisms?
A)primary producers
B)herbivores
C)carnivores
D)decomposers
E)both herbivores and carnivores
Which of the following consume other living organisms?
A)primary producers
B)herbivores
C)carnivores
D)decomposers
E)both herbivores and carnivores
Unlock Deck
Unlock for access to all 41 flashcards in this deck.
Unlock Deck
k this deck
12
Figure 54.6
Which of the following statements about secondary production is true?
A)Endotherms have higher metabolic rates compared to ectotherms and therefore have higher secondary production.
B)Ectotherms have higher metabolic rates compared to endotherms and therefore have higher secondary production.
C)Endotherms use less internal energy for metabolism and therefore have higher rates of secondary production.
D)Ectotherms use less internal energy for metabolism and therefore have higher rates of secondary production.
Unlock Deck
Unlock for access to all 41 flashcards in this deck.
Unlock Deck
k this deck
13
Figure 54.3
Considering its total area covered,which ecosystem type represented in Figure 54.3 has a very low level of economic impact on Earth's ecosystem?
A)tropical wet forest
B)rock,sand,and ice
C)tropical seasonal forest
D)ocean neritic zone
Considering its total area covered,which ecosystem type represented in Figure 54.3 has a very low level of economic impact on Earth's ecosystem?
A)tropical wet forest
B)rock,sand,and ice
C)tropical seasonal forest
D)ocean neritic zone
Unlock Deck
Unlock for access to all 41 flashcards in this deck.
Unlock Deck
k this deck
14
Figure 54.3
What is the leading hypothesis as to why terrestrial productivity is higher in equatorial climates?
A)Productivity increases with temperature.
B)Productivity increases with water availability.
C)Productivity increases with available sunlight.
D)The hypothesis is most likely a combination of the other answers.
Unlock Deck
Unlock for access to all 41 flashcards in this deck.
Unlock Deck
k this deck
15
Figure 54.4
After looking at the experiment in Figure 54.4,what can be said about productivity in marine ecosystems?
A)Nothing can be said based on this information.
B)Marine organisms break down iron for energy and thus for productivity.
C)Iron can be a limiting nutrient in productivity.
D)Productivity increases when chlorophyll a is added.
Unlock Deck
Unlock for access to all 41 flashcards in this deck.
Unlock Deck
k this deck
16
Figure 54.5
If plants in a northern temperate area use 26,400 kcal/m² of energy from solar radiation in photosynthesis,and the total amount of solar radiation energy reaching that area is 2,640,000 kcal/m²,what is the overall gross photosynthetic efficiency?
A)0)01%
B)0)1%
C)1%
D)100%
If plants in a northern temperate area use 26,400 kcal/m² of energy from solar radiation in photosynthesis,and the total amount of solar radiation energy reaching that area is 2,640,000 kcal/m²,what is the overall gross photosynthetic efficiency?
A)0)01%
B)0)1%
C)1%
D)100%
Unlock Deck
Unlock for access to all 41 flashcards in this deck.
Unlock Deck
k this deck
17
Figure 54.4
Detritus can be consumed by which of the following primary decomposers?
A)bacteria
B)archaea
C)fungi
D)earthworms
E)all of the above
Detritus can be consumed by which of the following primary decomposers?
A)bacteria
B)archaea
C)fungi
D)earthworms
E)all of the above
Unlock Deck
Unlock for access to all 41 flashcards in this deck.
Unlock Deck
k this deck
18
Figure 54.3
Which category in Figure 54.3 makes available the highest productivity per square meter?
A)tropical wet forest
B)open ocean
C)algal beds and reefs
D)wetlands
Which category in Figure 54.3 makes available the highest productivity per square meter?
A)tropical wet forest
B)open ocean
C)algal beds and reefs
D)wetlands
Unlock Deck
Unlock for access to all 41 flashcards in this deck.
Unlock Deck
k this deck
19
Figure 54.3
Which habitat types in Figure 54.3 cover the largest area?
A)tropical wet forest plus the ocean neritic zone
B)open ocean
C)algal beds and reefs plus the ocean neritic zone
D)wetlands plus the ocean neritic zone
Which habitat types in Figure 54.3 cover the largest area?
A)tropical wet forest plus the ocean neritic zone
B)open ocean
C)algal beds and reefs plus the ocean neritic zone
D)wetlands plus the ocean neritic zone
Unlock Deck
Unlock for access to all 41 flashcards in this deck.
Unlock Deck
k this deck
20
Figure 54.3
Figure 54.3 represents net primary productivity in what way?
A)organized by biome
B)organized by geography
C)organized by region
D)randomly organized
Figure 54.3 represents net primary productivity in what way?
A)organized by biome
B)organized by geography
C)organized by region
D)randomly organized
Unlock Deck
Unlock for access to all 41 flashcards in this deck.
Unlock Deck
k this deck
21
Why are changes in the global carbon cycle important?
A)Burning reduces available carbon for primary producers and therefore primary consumers.
B)Deforestation and suburbanization reduce an area's net primary productivity.
C)Increasing atmospheric concentrations of carbon dioxide could alter Earth's climate.
D)By using fossil fuels we are destroying a nonrenewable resource.
E)All of the above are why changes in the global carbon cycle are important.
Unlock Deck
Unlock for access to all 41 flashcards in this deck.
Unlock Deck
k this deck
22
Figure 54.10
Upon looking at Figure 54.10,what can be concluded?
A)Residents in colder climates use more energy per person.
B)Residents of industrialized countries use more energy per person.
C)Residents of more populated countries use more energy per person.
D)English-speaking countries tend to use more energy per person.
Unlock Deck
Unlock for access to all 41 flashcards in this deck.
Unlock Deck
k this deck
23
What do researchers typically focus on when they study a particular biogeochemical cycle?
A)the nature and size of the reservoirs
B)the rate of element movement between reservoirs
C)interaction of the current cycle with other cycles
D)both the nature and size of the reservoirs,as well as the rate of element movement between reservoirs
E)both the rate of element movement between reservoirs and the interaction of the current cycle with other cycles
Unlock Deck
Unlock for access to all 41 flashcards in this deck.
Unlock Deck
k this deck
24
Considering the global carbon cycle,where are humans having a large impact?
A)terrestrial ecosystems
B)oceans
C)atmosphere
D)beneath the surface of the Earth
E)in both terrestrial ecosystems and the atmosphere
A)terrestrial ecosystems
B)oceans
C)atmosphere
D)beneath the surface of the Earth
E)in both terrestrial ecosystems and the atmosphere
Unlock Deck
Unlock for access to all 41 flashcards in this deck.
Unlock Deck
k this deck
25
Considering the global carbon cycle,where is the largest reservoir of carbon?
A)terrestrial ecosystems
B)oceans
C)atmosphere
D)beneath the surface of the Earth
A)terrestrial ecosystems
B)oceans
C)atmosphere
D)beneath the surface of the Earth
Unlock Deck
Unlock for access to all 41 flashcards in this deck.
Unlock Deck
k this deck
26
Figure 54.10
Based on Figure 54.10,and given the populations of the following countries,which country uses the most oil overall?
A)United States (population = 300 million)
B)Canada (population = 33 million)
C)China (population = 1.32 billion)
D)Russia (population = 142 million)
E)United Kingdom (population = 60 million)
Unlock Deck
Unlock for access to all 41 flashcards in this deck.
Unlock Deck
k this deck
27
Figure 54.7
Based on the experiment in Figure 54.7,all of the following are plausible reasons for the result except _____.
A)nutrients evaporate now that vegetation is absent
B)nutrients dissolve in the water running through the watershed
C)nutrients are attached to small particles of sand or clay that leave the watershed
D)plant roots that held soil particles in place are no longer there
Unlock Deck
Unlock for access to all 41 flashcards in this deck.
Unlock Deck
k this deck
28
Regarding soil and organic matter in humus,which of the following statements is true?
A)Humus is composed of inorganic nutrients,and organic matter is composed only of organic matter.
B)Soil organic matter is completely decayed.
C)Completely decayed soil organic matter is called humus.
D)Eventually,the nutrients in soil organic matter are converted to organic form.
A)Humus is composed of inorganic nutrients,and organic matter is composed only of organic matter.
B)Soil organic matter is completely decayed.
C)Completely decayed soil organic matter is called humus.
D)Eventually,the nutrients in soil organic matter are converted to organic form.
Unlock Deck
Unlock for access to all 41 flashcards in this deck.
Unlock Deck
k this deck
29
Use the following information when answering the corresponding question(s).
Abstract:
Increased radiative forcing is an inevitable part of global climate change,yet little is known of its potential effects on the energy fluxes in natural ecosystems.To simulate the conditions of global warming,we exposed peat monoliths (depth,0.6 cm;surface area,2.1 m²)from a bog and fen in northern Minnesota,USA,to three infrared (IR)loading (ambient,+45,and +90 W m⁻²)and three water table (-16,-20,and -29 cm in bog and -1,-10 and -18 cm in fen)treatments,each replicated in three mesocosm plots.Net radiation (Rn)and soil energy fluxes at the top,bottom,and sides of the mesocosms were measured in 1999,five years after the treatments had begun.Soil heat flux (G)increased proportionately with IR loading,comprising about 3%-8% of Rn.In the fen,the effect of IR loading on G was modulated by water table depth,whereas in the bog,it was not.Energy dissipation from the mesocosms occurred mainly via vertical exchange with air,as well as the deeper soil layers through the bottom of the mesocosms,whereas lateral fluxes were 10- to 20-fold smaller and independent of IR loading and water table depth.The exchange with deeper soil layers was sensitive to water table depth,in contrast to G,which responded primarily to IR loading.The qualitative responses in the bog and fen were similar,but the fen displayed wider seasonal variations and greater extremes in soil energy fluxes.The differences of G in the bog and fen are attributed to differences in the reflectance in the long waveband as a function of vegetation type,whereas the differences in soil heat storage may also depend on different soil properties and different water table depth at comparable treatments.These data suggest that the ecosystem-dependent controls over soil energy fluxes may provide an important constraint on biotic response to climate change.
The Noormets et al.study (2004)shows that there was an ecosystem-specific control over soil energy fluxes,and this constrained the biotic response to climate change.How do you think radiative heat would affect the water table in a wetland versus a temperate forest?
A)The wetland would likely absorb less heat than the temperate forest and therefore not significantly change water table depth.
B)The wetland would likely absorb more heat than the temperate forest and significantly change water table depth.
C)The temperate forest would likely absorb more heat than the wetland and significantly change water table depth.
D)Both areas would absorb similar amounts of radiative heat and therefore affect the water table equally.
Unlock Deck
Unlock for access to all 41 flashcards in this deck.
Unlock Deck
k this deck
30
Figure 54.8
Which of the following human activities is impacting the water cycle the least?
A)increase in asphalt and concrete surfaces
B)conversion of grasslands and forests into agricultural fields
C)increased processing of salt water to freshwater
D)increases in irrigated agriculture
Which of the following human activities is impacting the water cycle the least?
A)increase in asphalt and concrete surfaces
B)conversion of grasslands and forests into agricultural fields
C)increased processing of salt water to freshwater
D)increases in irrigated agriculture
Unlock Deck
Unlock for access to all 41 flashcards in this deck.
Unlock Deck
k this deck
31
Which of the following could be a cause of eutrophication?
A)adding a large amount of a limiting resource to an aquatic ecosystem
B)adding a large amount of a limiting resource to a terrestrial ecosystem
C)removing a limiting resource from an aquatic ecosystem
D)removing a limiting resource from a terrestrial ecosystem
A)adding a large amount of a limiting resource to an aquatic ecosystem
B)adding a large amount of a limiting resource to a terrestrial ecosystem
C)removing a limiting resource from an aquatic ecosystem
D)removing a limiting resource from a terrestrial ecosystem
Unlock Deck
Unlock for access to all 41 flashcards in this deck.
Unlock Deck
k this deck
32
Figure 54.8
Considering the global water cycle depicted in Figure 54.8,where does one find the largest amount of water changing phases?
A)groundwater runoff to oceans
B)movement of water vapor from ocean to land
C)evaporation/transpiration and precipitation over land
D)evaporation and precipitation over the oceans
E)all of the above show equal amounts of water changing between phases
Unlock Deck
Unlock for access to all 41 flashcards in this deck.
Unlock Deck
k this deck
33
From which one of the following environmental issues have we not documented either a slowdown,partial recovery,or significant recovery?
A)phosphate pollution
B)global warming
C)acid rain
D)ozone hole
A)phosphate pollution
B)global warming
C)acid rain
D)ozone hole
Unlock Deck
Unlock for access to all 41 flashcards in this deck.
Unlock Deck
k this deck
34
Which of the following most often controls the rate of nutrient cycling in ecosystems?
A)rate of decomposition of detritus
B)primary productivity
C)secondary productivity
D)both primary and secondary productivity
A)rate of decomposition of detritus
B)primary productivity
C)secondary productivity
D)both primary and secondary productivity
Unlock Deck
Unlock for access to all 41 flashcards in this deck.
Unlock Deck
k this deck
35
Considering the current scientific literature on global warming,which statement best summarizes the most recent findings?
A)The Intergovernmental Panel on Climate Change concluded that carbon dioxide is the sole cause of global warming.
B)The Intergovernmental Panel on Climate Change concluded that the evidence for global warming is unequivocal and that it is very likely due to human-induced changes in greenhouse gases.
C)The Intergovernmental Panel on Climate Change concluded that current evidence suggests that most of the warming over the past 50 years is attributable to human activities.
D)The Intergovernmental Panel on Climate Change concluded that current evidence suggests no link between human activity and climate change.
Unlock Deck
Unlock for access to all 41 flashcards in this deck.
Unlock Deck
k this deck
36
Figure 54.9
Considering the global nitrogen cycle depicted in Figure 54.9,what is the limiting portion of the cycle for plants?
A)industrial nitrogen fixation
B)nitrogen lost to the atmosphere
C)internal nitrogen cycling in the oceans
D)nitrogen fixation by bacteria
Considering the global nitrogen cycle depicted in Figure 54.9,what is the limiting portion of the cycle for plants?
A)industrial nitrogen fixation
B)nitrogen lost to the atmosphere
C)internal nitrogen cycling in the oceans
D)nitrogen fixation by bacteria
Unlock Deck
Unlock for access to all 41 flashcards in this deck.
Unlock Deck
k this deck
37
Figure 54.9
Which of the following is not a source of human-fixed nitrogen?
A)industrially produced fertilizers
B)cultivation of soybeans
C)combustion of fossil fuels
D)irrigation agriculture
Which of the following is not a source of human-fixed nitrogen?
A)industrially produced fertilizers
B)cultivation of soybeans
C)combustion of fossil fuels
D)irrigation agriculture
Unlock Deck
Unlock for access to all 41 flashcards in this deck.
Unlock Deck
k this deck
38
Figure 54.7
After looking at the experiment in Figure 54.7,what can be said about nutrient export in ecosystems?
A)Nutrient export is typically 10 times lower in a clear-cut watershed.
B)Nutrient export is typically 10 times higher in a clear-cut watershed.
C)Nutrient export is typically 10 times higher in an uncut watershed.
D)Nutrient export is not affected by any form of cutting.
Unlock Deck
Unlock for access to all 41 flashcards in this deck.
Unlock Deck
k this deck
39
Figure 54.9
How much nitrogen is fixed from human processes?
A)It is equal to the amount fixed by natural means.
B)It is about half that fixed by natural means.
C)It is about double that fixed by natural means.
D)We cannot calculate this value.
How much nitrogen is fixed from human processes?
A)It is equal to the amount fixed by natural means.
B)It is about half that fixed by natural means.
C)It is about double that fixed by natural means.
D)We cannot calculate this value.
Unlock Deck
Unlock for access to all 41 flashcards in this deck.
Unlock Deck
k this deck
40
Figure 54.9
Considering the global nitrogen cycle,how are humans altering this cycle?
A)industrial nitrogen fixation
B)nitrogen lost to the atmosphere
C)reduction of nitrogen available to terrestrial ecosystems
D)reduction of nitrogen fixation by bacteria
E)permanent burial of nitrogen in coastal environments through runoff
Unlock Deck
Unlock for access to all 41 flashcards in this deck.
Unlock Deck
k this deck
41
Use the following information when answering the corresponding question(s).
Abstract:
Increased radiative forcing is an inevitable part of global climate change,yet little is known of its potential effects on the energy fluxes in natural ecosystems.To simulate the conditions of global warming,we exposed peat monoliths (depth,0.6 cm;surface area,2.1 m²)from a bog and fen in northern Minnesota,USA,to three infrared (IR)loading (ambient,+45,and +90 W m⁻²)and three water table (-16,-20,and -29 cm in bog and -1,-10 and -18 cm in fen)treatments,each replicated in three mesocosm plots.Net radiation (Rn)and soil energy fluxes at the top,bottom,and sides of the mesocosms were measured in 1999,five years after the treatments had begun.Soil heat flux (G)increased proportionately with IR loading,comprising about 3%-8% of Rn.In the fen,the effect of IR loading on G was modulated by water table depth,whereas in the bog,it was not.Energy dissipation from the mesocosms occurred mainly via vertical exchange with air,as well as the deeper soil layers through the bottom of the mesocosms,whereas lateral fluxes were 10- to 20-fold smaller and independent of IR loading and water table depth.The exchange with deeper soil layers was sensitive to water table depth,in contrast to G,which responded primarily to IR loading.The qualitative responses in the bog and fen were similar,but the fen displayed wider seasonal variations and greater extremes in soil energy fluxes.The differences of G in the bog and fen are attributed to differences in the reflectance in the long waveband as a function of vegetation type,whereas the differences in soil heat storage may also depend on different soil properties and different water table depth at comparable treatments.These data suggest that the ecosystem-dependent controls over soil energy fluxes may provide an important constraint on biotic response to climate change.
Once heat is transferred to the soil,where does it go afterward (Noormets et al.2004)?
A)The heat is emitted back to the atmosphere.
B)The heat is transferred to other soil layers.
C)The heat is stored in the soil.
D)The heat is both emitted back to the atmosphere and transferred to other soil layers.
E)The heat is emitted back to the atmosphere,transferred to other soil layers,and stored in the soil.
Unlock Deck
Unlock for access to all 41 flashcards in this deck.
Unlock Deck
k this deck
Unlock Deck
Unlock for access to all 41 flashcards in this deck.


