Deck 5: The Service Delivery Process
Full screen (f)
Question
Question
Question
Question
Question
Question
Question
Question
Question
Question
Question
Question
Question
Question
Exhibit 5-1
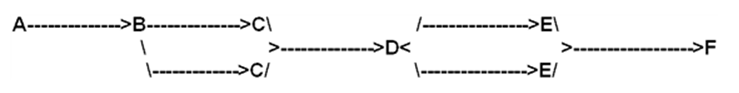
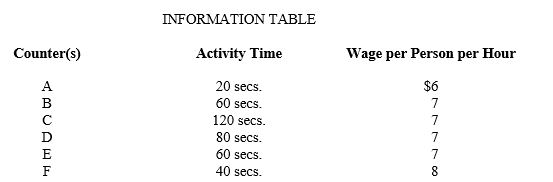
The following questions are based on the below cafeteria flowchart and the information provided in the table. Customers start at counter A and move to Counter B. Customers then choose one of two counter Cs and then move on toward Counter D. Customers then choose one of two counter Es and then move on toward Counter E.
-Refer to Exhibit 5-1.What is the process time for Counter E?
A)10 seconds
B)15 seconds
C)20 seconds
D)30 seconds
E)60 seconds
Question
Question
Question
Question
Exhibit 5-1
The following questions are based on the below cafeteria flowchart and the information provided in the table. Customers start at counter A and move to Counter B. Customers then choose one of two counter Cs and then move on toward Counter D. Customers then choose one of two counter Es and then move on toward Counter E.
-Refer to Exhibit 5-1. What is the activity time for Counter C?
A)10 seconds
B)20 seconds
C)30 seconds
D)45 seconds
E)60 seconds
Question
Question
Question
Question
Exhibit 5-1
The following questions are based on the below cafeteria flowchart and the information provided in the table. Customers start at counter A and move to Counter B. Customers then choose one of two counter Cs and then move on toward Counter D. Customers then choose one of two counter Es and then move on toward Counter E.
-Refer to Exhibit 5-1.How many customers can this cafeteria process in an hour?
A)360
B)120
C)90
D)240
E)180
Question
Question
Question
Based on the following cafeteria flowchart and the information provided in the table: a.What is the service cost per meal? b.If you were to add another station to fix the current bottleneck,where would you add it?c.How does this affect the service cost per meal?

Question
Question
Question
Question
Exhibit 5-1
The following questions are based on the below cafeteria flowchart and the information provided in the table. Customers start at counter A and move to Counter B. Customers then choose one of two counter Cs and then move on toward Counter D. Customers then choose one of two counter Es and then move on toward Counter E.
-Refer to Exhibit 5-1.Assuming one service provider per counter and based on its current configuration,the cafeteria's service cost per meal is:
A)$42.00
B)$0.11
C)$0.46
D)$2.14
E)$0.62
Question
Question
Exhibit 5-1
The following questions are based on the below cafeteria flowchart and the information provided in the table. Customers start at counter A and move to Counter B. Customers then choose one of two counter Cs and then move on toward Counter D. Customers then choose one of two counter Es and then move on toward Counter E.
-?Refer to Exhibit 5-1.If an extra counter is added at the bottleneck location,how many customers can the cafeteria process in an hour?
A)?360
B)?120
C)?90
D)?240
E)?180
Question
Question
Exhibit 5-1
The following questions are based on the below cafeteria flowchart and the information provided in the table. Customers start at counter A and move to Counter B. Customers then choose one of two counter Cs and then move on toward Counter D. Customers then choose one of two counter Es and then move on toward Counter E.
-Refer to Exhibit 5-1.If an extra counter is located at the bottleneck location,what is the new service cost per meal?
A)$49.00
B)$0.53
C)$0.46
D)$2.14
E)$1.90
Question
Exhibit 5-1
The following questions are based on the below cafeteria flowchart and the information provided in the table. Customers start at counter A and move to Counter B. Customers then choose one of two counter Cs and then move on toward Counter D. Customers then choose one of two counter Es and then move on toward Counter E.
-Refer to Exhibit 5-1.Where is the bottleneck located in this example?
A)Counter A
B)Counter B
C)Counter C
D)Counter D
E)Counter E
Question
Exhibit 5-1
The following questions are based on the below cafeteria flowchart and the information provided in the table. Customers start at counter A and move to Counter B. Customers then choose one of two counter Cs and then move on toward Counter D. Customers then choose one of two counter Es and then move on toward Counter E.
-Refer to Exhibit 5-1.Which of the following counters produces a maximum output per hour of 240 customers?
A)Counter A
B)Counter B
C)Counter C
D)Counter D
E)Counter E
Question
Question
Question
Question
Question
Question

Unlock Deck
Sign up to unlock the cards in this deck!
Unlock Deck
Unlock Deck
1/41
Play
Full screen (f)
Deck 5: The Service Delivery Process
1
All of the following are examples of the technical core within an organization except the:
A)kitchen in restaurant.
B)surgical room in a hospital.
C)service bay at an auto repair facility.
D)waiting area at a dentist's office.
E)projection booth in a movie theater.
A)kitchen in restaurant.
B)surgical room in a hospital.
C)service bay at an auto repair facility.
D)waiting area at a dentist's office.
E)projection booth in a movie theater.
D
2
Which of the following is NOT one of the broad categories of strategies used to overcome the problems of service operations?
A)isolating the technical core
B)production-lining the whole system
C)creating flexible capacity
D)increasing customer participation
E)maximizing the servuction system
A)isolating the technical core
B)production-lining the whole system
C)creating flexible capacity
D)increasing customer participation
E)maximizing the servuction system
E
3
The objective of decoupling is:
A)separating consumption in time and space.
B)unbundling services so that they may be purchased separately.
C)separating the technical core of the operation from the high customer contact areas of the firm so that efficiencies may be achieved.
D)managing consumers so that they do not negatively influence one another's service experience.
E)separating co-workers who,due to their differences,decrease the operational efficiency of the system.
C
4
The manner in which "operational competitiveness" is embraced by various service firms can be described by all the following stages except:
A)available for service.
B)marketing and operations.
C)journeyman.
D)distinctive competencies achieved.
E)world-class service delivery.
A)available for service.
B)marketing and operations.
C)journeyman.
D)distinctive competencies achieved.
E)world-class service delivery.
Unlock Deck
Unlock for access to all 41 flashcards in this deck.
Unlock Deck
k this deck
5
According to Thompson's perfect-world model,perfect efficiency occurs when:
A)employees understand their jobs.
B)role congruence occurs between customers and employees.
C)inputs,outputs,and quality happen at a constant rate and remain known and certain.
D)customer needs are being met.
E)when the operation concentrates on performing one particular task in one particular part of the plant.
Unlock Deck
Unlock for access to all 41 flashcards in this deck.
Unlock Deck
k this deck
6
Production-lining a service operation can be achieved through:
A)utilizing hard technologies.
B)customizing services.
C)utilizing soft technologies.
D)meeting individual customer needs.
E)utilizing hard and soft technologies.
A)utilizing hard technologies.
B)customizing services.
C)utilizing soft technologies.
D)meeting individual customer needs.
E)utilizing hard and soft technologies.
Unlock Deck
Unlock for access to all 41 flashcards in this deck.
Unlock Deck
k this deck
7
Blueprints identify all of the following process steps except:
A)the direction in which processes flow.
B)the time it takes to move from one process to the next.
C)the costs involved with each process step.
D)the amount of inventory build-up at each step.
E)none of these are exceptions.
A)the direction in which processes flow.
B)the time it takes to move from one process to the next.
C)the costs involved with each process step.
D)the amount of inventory build-up at each step.
E)none of these are exceptions.
Unlock Deck
Unlock for access to all 41 flashcards in this deck.
Unlock Deck
k this deck
8
Soft technologies refer to the:
A)personal touches that ultimately lead to customer satisfaction.
B)flexible rules that can be bent to meet customer needs.
C)guidelines that permit employee empowerment.
D)hardware that facilitates the production of a standardized product.
E)rules,regulations,and procedures that facilitate the production of a standardized product.
Unlock Deck
Unlock for access to all 41 flashcards in this deck.
Unlock Deck
k this deck
9
All of the following are examples of creating flexible capacity except:
A)using part-time employees.
B)sharing capacity with another firm.
C)handling routine transactions by mail or email.
D)cross-training employees.
E)none of these are exceptions.
A)using part-time employees.
B)sharing capacity with another firm.
C)handling routine transactions by mail or email.
D)cross-training employees.
E)none of these are exceptions.
Unlock Deck
Unlock for access to all 41 flashcards in this deck.
Unlock Deck
k this deck
10
With regards to constructing a service blueprint,the time required to perform one activity at one station is called:
A)process time.
B)activity time.
C)maximum output per hour.
D)operation time.
E)bottleneck time.
A)process time.
B)activity time.
C)maximum output per hour.
D)operation time.
E)bottleneck time.
Unlock Deck
Unlock for access to all 41 flashcards in this deck.
Unlock Deck
k this deck
11
Strategies to increase the efficiency of service operations include all of the following except:
A)buffering.
B)smoothing.
C)anticipating.
D)rationing.
E)allocating.
A)buffering.
B)smoothing.
C)anticipating.
D)rationing.
E)allocating.
Unlock Deck
Unlock for access to all 41 flashcards in this deck.
Unlock Deck
k this deck
12
The strategy of breaking up large,unfocused plants into smaller units buffered from one another so that each can be focused separately is referred to as:
A)the perfect-world model.
B)operations segmentation.
C)the plant-within-a-plant concept.
D)operations segregation.
E)management by focus.
A)the perfect-world model.
B)operations segmentation.
C)the plant-within-a-plant concept.
D)operations segregation.
E)management by focus.
Unlock Deck
Unlock for access to all 41 flashcards in this deck.
Unlock Deck
k this deck
13
Customers ultimately determine:
A)the type of demand.
B)the levels of marketing effectiveness and operational efficiency.
C)the cycle of demand.
D)the length of the service experience.
E)all of the these.
A)the type of demand.
B)the levels of marketing effectiveness and operational efficiency.
C)the cycle of demand.
D)the length of the service experience.
E)all of the these.
Unlock Deck
Unlock for access to all 41 flashcards in this deck.
Unlock Deck
k this deck
14
Exhibit 5-1
The following questions are based on the below cafeteria flowchart and the information provided in the table. Customers start at counter A and move to Counter B. Customers then choose one of two counter Cs and then move on toward Counter D. Customers then choose one of two counter Es and then move on toward Counter E.
-Refer to Exhibit 5-1.What is the process time for Counter E?
A)10 seconds
B)15 seconds
C)20 seconds
D)30 seconds
E)60 seconds
Unlock Deck
Unlock for access to all 41 flashcards in this deck.
Unlock Deck
k this deck
15
The strategy that resorts to triage when the demands placed on the system by the environment exceed its ability to handle them is referred to as:
A)buffering.
B)smoothing.
C)anticipating.
D)rationing.
E)allocating.
A)buffering.
B)smoothing.
C)anticipating.
D)rationing.
E)allocating.
Unlock Deck
Unlock for access to all 41 flashcards in this deck.
Unlock Deck
k this deck
16
The strategy that surrounds the technical core of the operation with input and output components is called:
A)buffering.
B)smoothing.
C)anticipating.
D)rationing.
E)allocating.
A)buffering.
B)smoothing.
C)anticipating.
D)rationing.
E)allocating.
Unlock Deck
Unlock for access to all 41 flashcards in this deck.
Unlock Deck
k this deck
17
The place within an organization where its primary operations are conducted is called the:
A)the technical core.
B)the organizational point.
C)the factory.
D)the main system.
E)main terminal.
A)the technical core.
B)the organizational point.
C)the factory.
D)the main system.
E)main terminal.
Unlock Deck
Unlock for access to all 41 flashcards in this deck.
Unlock Deck
k this deck
18
Exhibit 5-1
The following questions are based on the below cafeteria flowchart and the information provided in the table. Customers start at counter A and move to Counter B. Customers then choose one of two counter Cs and then move on toward Counter D. Customers then choose one of two counter Es and then move on toward Counter E.
-Refer to Exhibit 5-1. What is the activity time for Counter C?
A)10 seconds
B)20 seconds
C)30 seconds
D)45 seconds
E)60 seconds
Unlock Deck
Unlock for access to all 41 flashcards in this deck.
Unlock Deck
k this deck
19
Which of the following is an example of decoupling?
A)using part-time employees
B)sharing capacity with another firm
C)handling routine transactions by mail or email
D)cross-training employees
E)offering discounts during non-peak times
A)using part-time employees
B)sharing capacity with another firm
C)handling routine transactions by mail or email
D)cross-training employees
E)offering discounts during non-peak times
Unlock Deck
Unlock for access to all 41 flashcards in this deck.
Unlock Deck
k this deck
20
An automatic teller machine (ATM) is an example of:
A)production-lining.
B)isolating the technical core.
C)decoupling.
D)creating flexible capacity.
E)moving the time of demand.
A)production-lining.
B)isolating the technical core.
C)decoupling.
D)creating flexible capacity.
E)moving the time of demand.
Unlock Deck
Unlock for access to all 41 flashcards in this deck.
Unlock Deck
k this deck
21
Discuss the relationship between operations and marketing as it pertains to developing service delivery systems.
Unlock Deck
Unlock for access to all 41 flashcards in this deck.
Unlock Deck
k this deck
22
Exhibit 5-1
The following questions are based on the below cafeteria flowchart and the information provided in the table. Customers start at counter A and move to Counter B. Customers then choose one of two counter Cs and then move on toward Counter D. Customers then choose one of two counter Es and then move on toward Counter E.
-Refer to Exhibit 5-1.How many customers can this cafeteria process in an hour?
A)360
B)120
C)90
D)240
E)180
Unlock Deck
Unlock for access to all 41 flashcards in this deck.
Unlock Deck
k this deck
23
Define the fundamental components of a service blueprint.
Unlock Deck
Unlock for access to all 41 flashcards in this deck.
Unlock Deck
k this deck
24
Describe the difficulties associated with applying efficiency models to service organizations.
Unlock Deck
Unlock for access to all 41 flashcards in this deck.
Unlock Deck
k this deck
25
Based on the following cafeteria flowchart and the information provided in the table: a.What is the service cost per meal? b.If you were to add another station to fix the current bottleneck,where would you add it?c.How does this affect the service cost per meal?
Unlock Deck
Unlock for access to all 41 flashcards in this deck.
Unlock Deck
k this deck
26
A service operation consists of four stations.Station 1 can process 150 customers per hour.Station 2 can process 300 customers per hour.Stations 3 can process 100 customers per hour,and Station 4 can process 150 customers per hour.What is the maximum number of customers the entire operation can process in an hour?
A)700
B)300
C)175
D)150
E)100
A)700
B)300
C)175
D)150
E)100
Unlock Deck
Unlock for access to all 41 flashcards in this deck.
Unlock Deck
k this deck
27
Divesting an operation of different services and concentrating on providing only one or a few services in order to pursue a specialization position strategy is called:
A)increasing divergence.
B)reducing divergence.
C)increasing complexity.
D)unbundling the service.
E)divesting concentration.
A)increasing divergence.
B)reducing divergence.
C)increasing complexity.
D)unbundling the service.
E)divesting concentration.
Unlock Deck
Unlock for access to all 41 flashcards in this deck.
Unlock Deck
k this deck
28
The positioning strategy that increases divergence so that the operation can tailor the service experience to each customer is referred to as a:
A)niche positioning strategy.
B)volume-oriented positioning strategy.
C)specialization positioning strategy.
D)penetration strategy.
E)market diversification strategy.
A)niche positioning strategy.
B)volume-oriented positioning strategy.
C)specialization positioning strategy.
D)penetration strategy.
E)market diversification strategy.
Unlock Deck
Unlock for access to all 41 flashcards in this deck.
Unlock Deck
k this deck
29
Exhibit 5-1
The following questions are based on the below cafeteria flowchart and the information provided in the table. Customers start at counter A and move to Counter B. Customers then choose one of two counter Cs and then move on toward Counter D. Customers then choose one of two counter Es and then move on toward Counter E.
-Refer to Exhibit 5-1.Assuming one service provider per counter and based on its current configuration,the cafeteria's service cost per meal is:
A)$42.00
B)$0.11
C)$0.46
D)$2.14
E)$0.62
Unlock Deck
Unlock for access to all 41 flashcards in this deck.
Unlock Deck
k this deck
30
Discuss the type of operation that would typify peak efficiency.
Unlock Deck
Unlock for access to all 41 flashcards in this deck.
Unlock Deck
k this deck
31
Exhibit 5-1
The following questions are based on the below cafeteria flowchart and the information provided in the table. Customers start at counter A and move to Counter B. Customers then choose one of two counter Cs and then move on toward Counter D. Customers then choose one of two counter Es and then move on toward Counter E.
-?Refer to Exhibit 5-1.If an extra counter is added at the bottleneck location,how many customers can the cafeteria process in an hour?
A)?360
B)?120
C)?90
D)?240
E)?180
Unlock Deck
Unlock for access to all 41 flashcards in this deck.
Unlock Deck
k this deck
32
The ____ is calculated by dividing the activity time by the number of locations at which the activity is performed.
A)service cost per meal
B)maximum output per hour
C)process time
D)activity time
E)bottleneck time
A)service cost per meal
B)maximum output per hour
C)process time
D)activity time
E)bottleneck time
Unlock Deck
Unlock for access to all 41 flashcards in this deck.
Unlock Deck
k this deck
33
Exhibit 5-1
The following questions are based on the below cafeteria flowchart and the information provided in the table. Customers start at counter A and move to Counter B. Customers then choose one of two counter Cs and then move on toward Counter D. Customers then choose one of two counter Es and then move on toward Counter E.
-Refer to Exhibit 5-1.If an extra counter is located at the bottleneck location,what is the new service cost per meal?
A)$49.00
B)$0.53
C)$0.46
D)$2.14
E)$1.90
Unlock Deck
Unlock for access to all 41 flashcards in this deck.
Unlock Deck
k this deck
34
Exhibit 5-1
The following questions are based on the below cafeteria flowchart and the information provided in the table. Customers start at counter A and move to Counter B. Customers then choose one of two counter Cs and then move on toward Counter D. Customers then choose one of two counter Es and then move on toward Counter E.
-Refer to Exhibit 5-1.Where is the bottleneck located in this example?
A)Counter A
B)Counter B
C)Counter C
D)Counter D
E)Counter E
Unlock Deck
Unlock for access to all 41 flashcards in this deck.
Unlock Deck
k this deck
35
Exhibit 5-1
The following questions are based on the below cafeteria flowchart and the information provided in the table. Customers start at counter A and move to Counter B. Customers then choose one of two counter Cs and then move on toward Counter D. Customers then choose one of two counter Es and then move on toward Counter E.
-Refer to Exhibit 5-1.Which of the following counters produces a maximum output per hour of 240 customers?
A)Counter A
B)Counter B
C)Counter C
D)Counter D
E)Counter E
Unlock Deck
Unlock for access to all 41 flashcards in this deck.
Unlock Deck
k this deck
36
The most common mistake made when constructing a service blueprint is:
A)bottlenecks are not identified correctly.
B)failure points are not identified correctly.
C)the blueprint is one-sided − representing only the firm's perception of the process.
D)script norms are misunderstood.
E)the time frame for service execution is miscalculated.
A)bottlenecks are not identified correctly.
B)failure points are not identified correctly.
C)the blueprint is one-sided − representing only the firm's perception of the process.
D)script norms are misunderstood.
E)the time frame for service execution is miscalculated.
Unlock Deck
Unlock for access to all 41 flashcards in this deck.
Unlock Deck
k this deck
37
A specialization positioning strategy is accomplished by:
A)increasing divergence.
B)reducing divergence.
C)increasing complexity.
D)reducing complexity.
E)bundling the service.
A)increasing divergence.
B)reducing divergence.
C)increasing complexity.
D)reducing complexity.
E)bundling the service.
Unlock Deck
Unlock for access to all 41 flashcards in this deck.
Unlock Deck
k this deck
38
A volume-oriented positioning strategy is achieved by:
A)increasing divergence.
B)reducing divergence.
C)increasing complexity.
D)reducing complexity.
E)unbundling the service.
A)increasing divergence.
B)reducing divergence.
C)increasing complexity.
D)reducing complexity.
E)unbundling the service.
Unlock Deck
Unlock for access to all 41 flashcards in this deck.
Unlock Deck
k this deck
39
The positioning strategy that increases complexity by adding more services and/or enhancing current services to capture more of the market is referred to as:
A)niche positioning strategy.
B)volume-oriented positioning strategy.
C)specialization positioning strategy.
D)penetration strategy.
E)market diversification strategy.
A)niche positioning strategy.
B)volume-oriented positioning strategy.
C)specialization positioning strategy.
D)penetration strategy.
E)market diversification strategy.
Unlock Deck
Unlock for access to all 41 flashcards in this deck.
Unlock Deck
k this deck
40
Which of the following is NOT a step in the construction process of a service blueprint?
A)obtaining scripts from both customers and employees
B)segmenting customers based on the content of the script
C)identify steps in the process where the system can go awry
D)calculating the time frame for service execution
E)analyzing the profitability of the system
A)obtaining scripts from both customers and employees
B)segmenting customers based on the content of the script
C)identify steps in the process where the system can go awry
D)calculating the time frame for service execution
E)analyzing the profitability of the system
Unlock Deck
Unlock for access to all 41 flashcards in this deck.
Unlock Deck
k this deck
41
Discuss the strategies available for new service development.
Unlock Deck
Unlock for access to all 41 flashcards in this deck.
Unlock Deck
k this deck
Unlock Deck
Unlock for access to all 41 flashcards in this deck.


