Deck 4: Effective Charts
Full screen (f)
Question
Question
Question
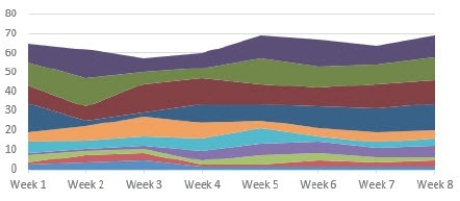
The chart shown above depicts a(n)________ chart.
A)Line
B)Scatter
C)Radar
D)Area
Question
Question
Question
Question
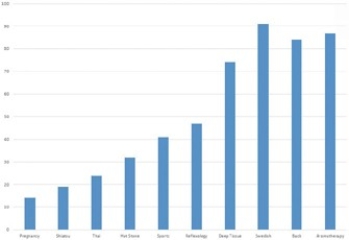
The chart shown above depicts a(n)________ chart.
A)Surface
B)Area
C)Bar
D)Column
Question
Question
Question
Question
Question
Question
Question
Question
Question
Question
Question
Question
Question
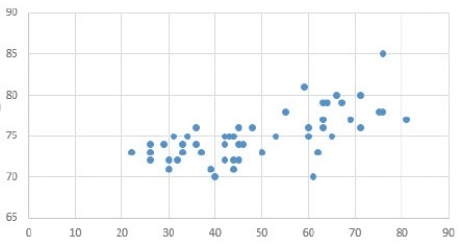
The chart shown above depicts a(n)________ chart.
A)Area
B)Radar
C)Scatter
D)Cluster
Question
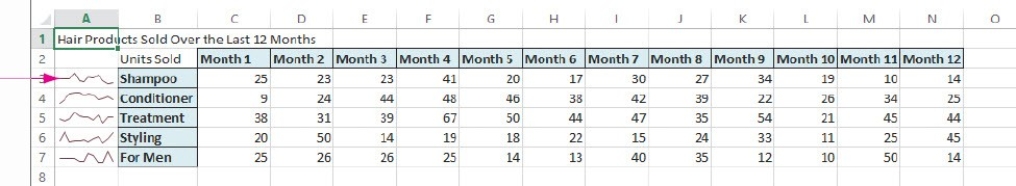
In the worksheet above,the red arrow is pointing at a ________.
A)trendline
B)sparkline
C)regression line
D)progression line
Question
Question
Question
Question
Question
Question
Question
Question
Question
Question
Clicking  allows single-click access to formatting,formulas,and sparklines.
allows single-click access to formatting,formulas,and sparklines. Question
Question
Question
Question
Question
Question
Question
Question
Question
Question
Question
Question
Question
Question
Question
Question
Question
Question
Question
Question
Question
Question
The chart shown above depicts a line chart.
Question
Question
Question
Question
Question
Question
Question
Question
Question
The chart shown above depicts a(n)________ chart.
Question
Question
Question
Question
Question
Question
Question
Question
Question
Question
Question
Question
Question
Question
When formatting a chart area,you would click  ,which is the ________ button used to display chart properties.
,which is the ________ button used to display chart properties. Question
Question
The chart shown above depicts a(n)________ chart.
Question
Question

Unlock Deck
Sign up to unlock the cards in this deck!
Unlock Deck
Unlock Deck
1/98
Play
Full screen (f)
Deck 4: Effective Charts
1
To show changes over time,you would use a ________ chart.
A)Line
B)Column
C)Bar
D)Pie
A)Line
B)Column
C)Bar
D)Pie
A
2
A ________ chart is used to shows project schedule where each bar represents a project component or task.
A)Gantt
B)Flow
C)Structure
D)Venn
A)Gantt
B)Flow
C)Structure
D)Venn
A
3
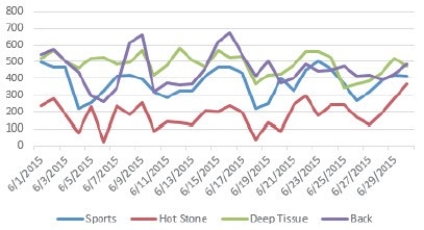
The chart shown above depicts a(n)________ chart.
A)Line
B)Scatter
C)Radar
D)Area
D
4
A(n)________ chart is useful for showing categories that change over time and where each column represents a unit of time.
A)Column
B)Radar
C)Area
D)Surface
A)Column
B)Radar
C)Area
D)Surface
Unlock Deck
Unlock for access to all 98 flashcards in this deck.
Unlock Deck
k this deck
5
To illustrate the relationship of the parts to the whole,you would use a(n)________ chart.
A)Line
B)Pie
C)Scatter
D)Area
A)Line
B)Pie
C)Scatter
D)Area
Unlock Deck
Unlock for access to all 98 flashcards in this deck.
Unlock Deck
k this deck
6
Which of the following is NOT one of the CHART TOOLS contextual tabs?
A)Chart Elements
B)Chart Area
C)Chart Filters
D)Chart Styles
A)Chart Elements
B)Chart Area
C)Chart Filters
D)Chart Styles
Unlock Deck
Unlock for access to all 98 flashcards in this deck.
Unlock Deck
k this deck
7
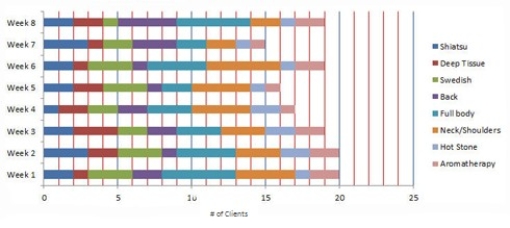
The chart shown above depicts a(n)________ chart.
A)Surface
B)Area
C)Bar
D)Column
Unlock Deck
Unlock for access to all 98 flashcards in this deck.
Unlock Deck
k this deck
8
To show the relationship between two numeric variables,you would use a ________ chart.
A)Cluster
B)Surface
C)Scatter
D)Radar
A)Cluster
B)Surface
C)Scatter
D)Radar
Unlock Deck
Unlock for access to all 98 flashcards in this deck.
Unlock Deck
k this deck
9
When creating a chart from data in a worksheet,the legend data is indicated by ________.
A)shading the data with a light purple background
B)surrounding the data with a purple border
C)changing font color of the data to red
D)surrounding the data with a red dashed border
A)shading the data with a light purple background
B)surrounding the data with a purple border
C)changing font color of the data to red
D)surrounding the data with a red dashed border
Unlock Deck
Unlock for access to all 98 flashcards in this deck.
Unlock Deck
k this deck
10
To display the Move Chart dialog box,you click Move Chart in the ________.
A)Chart Layouts group on the CHART TOOLS FORMAT tab
B)Location group on the CHART TOOLS FORMAT tab
C)Chart Layouts group on the CHART TOOLS DESIGN tab
D)Location group on the CHART TOOLS DESIGN tab
A)Chart Layouts group on the CHART TOOLS FORMAT tab
B)Location group on the CHART TOOLS FORMAT tab
C)Chart Layouts group on the CHART TOOLS DESIGN tab
D)Location group on the CHART TOOLS DESIGN tab
Unlock Deck
Unlock for access to all 98 flashcards in this deck.
Unlock Deck
k this deck
11
A ________ chart can show information such as start and end times,sequence of tasks,and people assigned to each task.
A)Scatter
B)Combination
C)Gantt
D)Flow
A)Scatter
B)Combination
C)Gantt
D)Flow
Unlock Deck
Unlock for access to all 98 flashcards in this deck.
Unlock Deck
k this deck
12
Which of the following is NOT a primary business charting objective?
A)Data modification
B)Data exploration
C)Argumentation
D)Hypothesis testing
A)Data modification
B)Data exploration
C)Argumentation
D)Hypothesis testing
Unlock Deck
Unlock for access to all 98 flashcards in this deck.
Unlock Deck
k this deck
13
If you wanted to compare the percentages of students in a class that received A's,that received B's,that received C's,and so on,you would use a ________ chart.
A)Radar
B)Column
C)Scatter
D)Pie
A)Radar
B)Column
C)Scatter
D)Pie
Unlock Deck
Unlock for access to all 98 flashcards in this deck.
Unlock Deck
k this deck
14
To see possible types of graph to use,you can click Recommended Charts in the ________.
A)Illustrations group on the INSERT tab.
B)Charts group on the INSERT tab.
C)Illustrations group on the VIEW tab.
D)Charts group on the VIEW tab.
A)Illustrations group on the INSERT tab.
B)Charts group on the INSERT tab.
C)Illustrations group on the VIEW tab.
D)Charts group on the VIEW tab.
Unlock Deck
Unlock for access to all 98 flashcards in this deck.
Unlock Deck
k this deck
15
To enter a footer or header to a worksheet,you click Header & Footer in the:
A)Page setup group on the INSERT tab.
B)Text group on the INSERT tab.
C)Page setup group on the PAGE LAYOUT tab.
D)Text group on the PAGE LAYOUT tab.
A)Page setup group on the INSERT tab.
B)Text group on the INSERT tab.
C)Page setup group on the PAGE LAYOUT tab.
D)Text group on the PAGE LAYOUT tab.
Unlock Deck
Unlock for access to all 98 flashcards in this deck.
Unlock Deck
k this deck
16
If you wanted to see how the value of Apple's stock has changed during the past year,you would use a ________ chart.
A)Scatter
B)Column
C)Line
D)Pie
A)Scatter
B)Column
C)Line
D)Pie
Unlock Deck
Unlock for access to all 98 flashcards in this deck.
Unlock Deck
k this deck
17
The related data values used in creating a chart are called ________.
A)a legend
B)category labels
C)data series
D)value labels
A)a legend
B)category labels
C)data series
D)value labels
Unlock Deck
Unlock for access to all 98 flashcards in this deck.
Unlock Deck
k this deck
18
To view additional information or modify labels,you would click the ________ conceptual tab.
A)Chart Elements
B)Chart Styles
C)Chart Area
D)Chart Editing
A)Chart Elements
B)Chart Styles
C)Chart Area
D)Chart Editing
Unlock Deck
Unlock for access to all 98 flashcards in this deck.
Unlock Deck
k this deck
19
Excel's ________ feature analyzes a selection in a worksheet and suggests chart types that best fit the selected data.
A)Chart Wizard
B)Chart Maker
C)Recommended Charts
D)Chart Styles
A)Chart Wizard
B)Chart Maker
C)Recommended Charts
D)Chart Styles
Unlock Deck
Unlock for access to all 98 flashcards in this deck.
Unlock Deck
k this deck
20
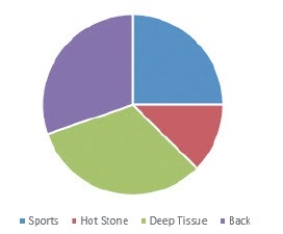
The chart shown above depicts a(n)________ chart.
A)Area
B)Radar
C)Scatter
D)Cluster
Unlock Deck
Unlock for access to all 98 flashcards in this deck.
Unlock Deck
k this deck
21
In the worksheet above,the red arrow is pointing at a ________.
A)trendline
B)sparkline
C)regression line
D)progression line
Unlock Deck
Unlock for access to all 98 flashcards in this deck.
Unlock Deck
k this deck
22
To modify the layout and data in an existing chart,you click Change Chart Type in the ________.
A)Chart Layouts group on the CHART TOOLS FORMAT tab
B)Type group on the CHART TOOLS FORMAT tab
C)Chart Layouts group on the CHART TOOLS DESIGN tab
D)Type group on the CHART TOOLS DESIGN tab
A)Chart Layouts group on the CHART TOOLS FORMAT tab
B)Type group on the CHART TOOLS FORMAT tab
C)Chart Layouts group on the CHART TOOLS DESIGN tab
D)Type group on the CHART TOOLS DESIGN tab
Unlock Deck
Unlock for access to all 98 flashcards in this deck.
Unlock Deck
k this deck
23
A chart sheet contains both the chart and the data associated with the chart.
Unlock Deck
Unlock for access to all 98 flashcards in this deck.
Unlock Deck
k this deck
24
To change the color of a chart ,you click Change Colors in the ________.
A)Chart Layouts group on the CHART TOOLS DESIGN tab
B)Chart Styles group on the CHART TOOLS DESIGN tab
C)Chart Layouts group on the CHART TOOLS FORMAT tab
D)Chart Styles group on the CHART TOOLS FORMAT tab
A)Chart Layouts group on the CHART TOOLS DESIGN tab
B)Chart Styles group on the CHART TOOLS DESIGN tab
C)Chart Layouts group on the CHART TOOLS FORMAT tab
D)Chart Styles group on the CHART TOOLS FORMAT tab
Unlock Deck
Unlock for access to all 98 flashcards in this deck.
Unlock Deck
k this deck
25
A chart is limited to a single data series.
Unlock Deck
Unlock for access to all 98 flashcards in this deck.
Unlock Deck
k this deck
26
To place an object such as a rectangle or circle into a chart,you click ________ in the Illustrations group on the INSERT tab.
A)Figures
B)Objects
C)Shapes
D)Forms
A)Figures
B)Objects
C)Shapes
D)Forms
Unlock Deck
Unlock for access to all 98 flashcards in this deck.
Unlock Deck
k this deck
27
To activate the Chart Tools contextual tab,you double-click the chart border.
Unlock Deck
Unlock for access to all 98 flashcards in this deck.
Unlock Deck
k this deck
28
To open the Format Axis task pane,you ________.
A)click anywhere in the chart and click select Format Axis in the Arrange group on the CHART TOOLS FORMAT tab
B)click anywhere in the chart and click select Format Axis in the Layouts group on the CHART TOOLS FORMAT tab
C)right-click anywhere in the chart and select Format Axis from the menu
D)double-click on the axis
Unlock Deck
Unlock for access to all 98 flashcards in this deck.
Unlock Deck
k this deck
29
Which of the following is NOT an Excel trendline type?
A)Quadratic
B)Linear
C)Exponential
D)Two-period moving average
A)Quadratic
B)Linear
C)Exponential
D)Two-period moving average
Unlock Deck
Unlock for access to all 98 flashcards in this deck.
Unlock Deck
k this deck
30
The Recommend Charts feature is located on the INSERT tab on the Ribbon.
Unlock Deck
Unlock for access to all 98 flashcards in this deck.
Unlock Deck
k this deck
31
Clicking allows single-click access to formatting,formulas,and sparklines.
allows single-click access to formatting,formulas,and sparklines. Unlock Deck
Unlock for access to all 98 flashcards in this deck.
Unlock Deck
k this deck
32
PNG,JPEG,and GIF are examples of file extensions used for ________ files.
A)template
B)dynamic worksheet
C)picture
D)chart or graph
A)template
B)dynamic worksheet
C)picture
D)chart or graph
Unlock Deck
Unlock for access to all 98 flashcards in this deck.
Unlock Deck
k this deck
33
Actions performed in the Chart Formatting Control can be performed through the Chart Tools contextual tab on the Ribbon.
Unlock Deck
Unlock for access to all 98 flashcards in this deck.
Unlock Deck
k this deck
34
You can use the corners or middle areas of a chart border to resize a chart.
Unlock Deck
Unlock for access to all 98 flashcards in this deck.
Unlock Deck
k this deck
35
________ are small charts that are embedded into the cells in a worksheet to help with trend analysis.
A)Minicharts
B)Microcharts
C)Sparklines
D)Data bars
A)Minicharts
B)Microcharts
C)Sparklines
D)Data bars
Unlock Deck
Unlock for access to all 98 flashcards in this deck.
Unlock Deck
k this deck
36
Which of the following is NOT a chart background fill option?
A)Transition
B)Color
C)Pattern
D)Picture
A)Transition
B)Color
C)Pattern
D)Picture
Unlock Deck
Unlock for access to all 98 flashcards in this deck.
Unlock Deck
k this deck
37
To move a chart,you double-click its border and drag the chart to a new location.
Unlock Deck
Unlock for access to all 98 flashcards in this deck.
Unlock Deck
k this deck
38
A(n)________ is a line that uses current data to display the progress or general direction of the data.
A)major gridline
B)minor gridline
C)trendline
D)axis
A)major gridline
B)minor gridline
C)trendline
D)axis
Unlock Deck
Unlock for access to all 98 flashcards in this deck.
Unlock Deck
k this deck
39
To deselect a chosen chart object,you can press Esc.
Unlock Deck
Unlock for access to all 98 flashcards in this deck.
Unlock Deck
k this deck
40
To place an image into a chart,you click ________ in the Illustrations group on the INSERT tab.
A)Pictures
B)Figures
C)Illustrations
D)Images
A)Pictures
B)Figures
C)Illustrations
D)Images
Unlock Deck
Unlock for access to all 98 flashcards in this deck.
Unlock Deck
k this deck
41
By clicking the Chart Elements button,you can add,move,or remove data labels.
Unlock Deck
Unlock for access to all 98 flashcards in this deck.
Unlock Deck
k this deck
42
The chart layouts are available in the Chart Layouts group under the Chart Tools contextual tabs on the Design tab.
Unlock Deck
Unlock for access to all 98 flashcards in this deck.
Unlock Deck
k this deck
43
If a change is made to a worksheet,you have to make the corresponding change to the connected chart.
Unlock Deck
Unlock for access to all 98 flashcards in this deck.
Unlock Deck
k this deck
44
An enhanced pie chart is a chart in which a slice is pulled outward away from the other slices.
Unlock Deck
Unlock for access to all 98 flashcards in this deck.
Unlock Deck
k this deck
45
You can enhance chart text by formatting it as WordArt.
Unlock Deck
Unlock for access to all 98 flashcards in this deck.
Unlock Deck
k this deck
46
A scatter chart is a variation of a stacked line chart emphasizing the amount of change over time.
Unlock Deck
Unlock for access to all 98 flashcards in this deck.
Unlock Deck
k this deck
47
Care must be taken when adding or removing chart elements,since the position of other elements may change.
Unlock Deck
Unlock for access to all 98 flashcards in this deck.
Unlock Deck
k this deck
48
When adding colors to a chart,more is better.
Unlock Deck
Unlock for access to all 98 flashcards in this deck.
Unlock Deck
k this deck
49
After inserting a shape into a graph,you can enter text in the shape.
Unlock Deck
Unlock for access to all 98 flashcards in this deck.
Unlock Deck
k this deck
50
You can remove a chart element by selecting it and then pressing Delete.
Unlock Deck
Unlock for access to all 98 flashcards in this deck.
Unlock Deck
k this deck
51
You can add chart and axes titles on the Chart Tools Format tab or with the Chart Elements button.
Unlock Deck
Unlock for access to all 98 flashcards in this deck.
Unlock Deck
k this deck
52
By default,Excel displays both major gridlines and minor gridlines on a chart.
Unlock Deck
Unlock for access to all 98 flashcards in this deck.
Unlock Deck
k this deck
53
The chart shown above depicts a line chart.
Unlock Deck
Unlock for access to all 98 flashcards in this deck.
Unlock Deck
k this deck
54
To examine the relationship between two numeric variables,you would use a scatter chart.
Unlock Deck
Unlock for access to all 98 flashcards in this deck.
Unlock Deck
k this deck
55
When using an area chart,the x-axis typically involves time.
Unlock Deck
Unlock for access to all 98 flashcards in this deck.
Unlock Deck
k this deck
56
Chart layouts focus on location of components,whereas styles focus more on the color coordination and effects of the components.
Unlock Deck
Unlock for access to all 98 flashcards in this deck.
Unlock Deck
k this deck
57
A scatter chart is displayed vertically and is useful for comparing categorized data sets.
Unlock Deck
Unlock for access to all 98 flashcards in this deck.
Unlock Deck
k this deck
58
To create a line chart,at least one set of labels and at least one set of corresponding data are needed.
Unlock Deck
Unlock for access to all 98 flashcards in this deck.
Unlock Deck
k this deck
59
A bar chart is displayed horizontally and is useful for comparing categorized data sets.
Unlock Deck
Unlock for access to all 98 flashcards in this deck.
Unlock Deck
k this deck
60
To create a pie chart,two data series,the labels and a set of corresponding values are required.
Unlock Deck
Unlock for access to all 98 flashcards in this deck.
Unlock Deck
k this deck
61
A(n)________ chart highlights regions showing growth over time or for categories and is a variation of a line chart.
Unlock Deck
Unlock for access to all 98 flashcards in this deck.
Unlock Deck
k this deck
62
The chart shown above depicts a(n)________ chart.
Unlock Deck
Unlock for access to all 98 flashcards in this deck.
Unlock Deck
k this deck
63
If you wanted to see if there is relationship between the miles per hour over the speed limit recorded on a ticket and the amount of the resulting fine,you would use a(n)________ chart.
Unlock Deck
Unlock for access to all 98 flashcards in this deck.
Unlock Deck
k this deck
64
________ is the graphical presentation of data focusing on qualitative understanding.
Unlock Deck
Unlock for access to all 98 flashcards in this deck.
Unlock Deck
k this deck
65
A(n)________ chart is displayed vertically and is useful for comparing categorized data sets.
Unlock Deck
Unlock for access to all 98 flashcards in this deck.
Unlock Deck
k this deck
66
A(n)________ is a special worksheet that only contains chart objects.
Unlock Deck
Unlock for access to all 98 flashcards in this deck.
Unlock Deck
k this deck
67
To change the style of a chart,you would click the ________ conceptual tab.
Unlock Deck
Unlock for access to all 98 flashcards in this deck.
Unlock Deck
k this deck
68
A(n)________ is an individual value in a data series.
Unlock Deck
Unlock for access to all 98 flashcards in this deck.
Unlock Deck
k this deck
69
To display the Format Data Labels task pane,you click the Data Labels ________ and select More Options.
Unlock Deck
Unlock for access to all 98 flashcards in this deck.
Unlock Deck
k this deck
70
The ________ tool is a contextual tool that provides single-click access to charts and PivotTables.
Unlock Deck
Unlock for access to all 98 flashcards in this deck.
Unlock Deck
k this deck
71
When working with a chart,you click the ________ to display the CHART TOOLS.
Unlock Deck
Unlock for access to all 98 flashcards in this deck.
Unlock Deck
k this deck
72
A common use for ________ charts is for project management.
Unlock Deck
Unlock for access to all 98 flashcards in this deck.
Unlock Deck
k this deck
73
A(n)________ chart stacks a series of colored layers and can be used to see trends over a period of time.
Unlock Deck
Unlock for access to all 98 flashcards in this deck.
Unlock Deck
k this deck
74
Printing a chart is basically the same as printing a worksheet.
Unlock Deck
Unlock for access to all 98 flashcards in this deck.
Unlock Deck
k this deck
75
Exploding a pie slice is a common pie chart enhancement.
Unlock Deck
Unlock for access to all 98 flashcards in this deck.
Unlock Deck
k this deck
76
When formatting a chart area,you would click ,which is the ________ button used to display chart properties.
,which is the ________ button used to display chart properties. Unlock Deck
Unlock for access to all 98 flashcards in this deck.
Unlock Deck
k this deck
77
When creating a chart from data in a worksheet,the data series is surrounded by a(n)________ border.
Unlock Deck
Unlock for access to all 98 flashcards in this deck.
Unlock Deck
k this deck
78
The chart shown above depicts a(n)________ chart.
Unlock Deck
Unlock for access to all 98 flashcards in this deck.
Unlock Deck
k this deck
79
You can display data bars as a one-color solid fill or a gradient fill from left to right as the numerical value increases.
Unlock Deck
Unlock for access to all 98 flashcards in this deck.
Unlock Deck
k this deck
80
A common enhancement for a line chart is the addition of color,weight,and marker size.
Unlock Deck
Unlock for access to all 98 flashcards in this deck.
Unlock Deck
k this deck
Unlock Deck
Unlock for access to all 98 flashcards in this deck.


