Deck 3: The Market at Work: Supply and Demand
Full screen (f)
Question
Question
Question
Question
Question
Question
Question
Question
Question
Question
Question
Refer to the table below.
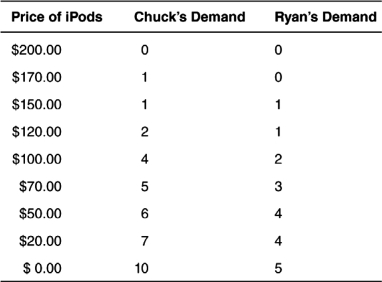
Assume that the market for iPods has only two consumers: Chuck and Ryan.According to the table above,if the price of an iPod is $70,the market will demand ________ iPods.
A) 8
B) 6
C) 5
D) 28
E) 45
Assume that the market for iPods has only two consumers: Chuck and Ryan.According to the table above,if the price of an iPod is $70,the market will demand ________ iPods.
A) 8
B) 6
C) 5
D) 28
E) 45
Question
Consider the following demand schedules for New York Mets T-shirts:
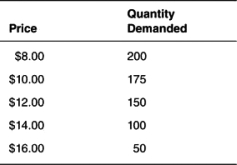
Holding all else constant,which of the following demand schedules is most likely to represent New York Mets T-shirts if they win the World Series?
A)
B)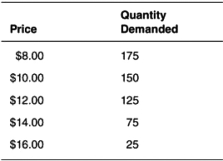
C)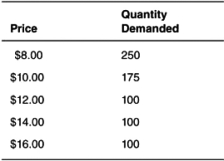
D)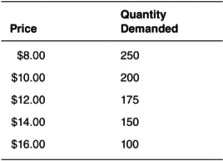
E)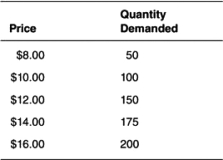
Holding all else constant,which of the following demand schedules is most likely to represent New York Mets T-shirts if they win the World Series?
A)
B)
C)
D)
E)
Question
Question
According to the figure below,at the price of $5:
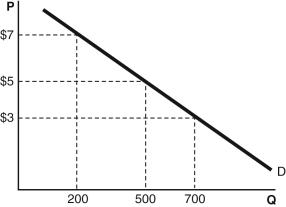
A) the equilibrium quantity is 500.
B) the quantity demanded is 500.
C) the demand is 500.
D) there is a surplus.
E) there is a shortage.
A) the equilibrium quantity is 500.
B) the quantity demanded is 500.
C) the demand is 500.
D) there is a surplus.
E) there is a shortage.
Question
Question
Question
Question
Question
Question
Question
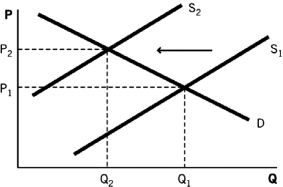
Refer to the following figure to answer the questions that follow.
Which of the following scenarios would explain the change in equilibrium shown in the figure?
A) an increase in an input price
B) a decrease in the number of buyers in a market
C) an increase in the price of a substitute good
D) an increase in the expected future price
E) a negative technological change
Question
Question
Question
Question
Question
Question
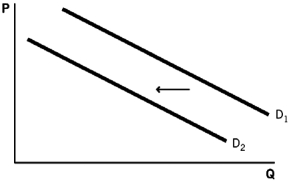
Refer to the following diagram to answer the questions that follow.
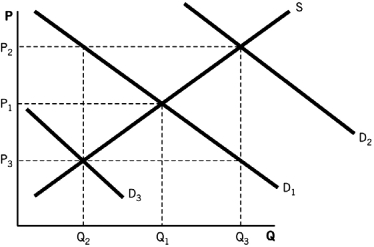
If consumers expect the price of a good to decrease in the future and all else is held constant,we would assume that the demand curve would:
A) shift from D₁ to D₃.
B) remain at D₁.
C) shift from D₁ to D₂.
D) shift from D₂ to D₁.
E) shift from D₂ to D₃.
If consumers expect the price of a good to decrease in the future and all else is held constant,we would assume that the demand curve would:
A) shift from D₁ to D₃.
B) remain at D₁.
C) shift from D₁ to D₂.
D) shift from D₂ to D₁.
E) shift from D₂ to D₃.
Question
Refer to the accompanying figure.When the price changes from P₁ to P₂,we will see a(n):
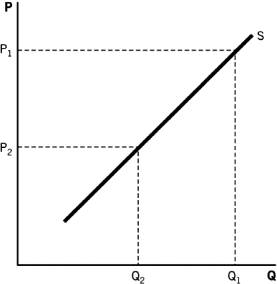
A) decrease in supply from Q1 to Q2.
B) increase in supply from Q2 to Q1.
C) decrease in quantity supplied from Q1 to Q2.
D) increase in quantity supplied from Q2 to Q1.
E) shift of the supply curve.
A) decrease in supply from Q1 to Q2.
B) increase in supply from Q2 to Q1.
C) decrease in quantity supplied from Q1 to Q2.
D) increase in quantity supplied from Q2 to Q1.
E) shift of the supply curve.
Question
Question
Question
Question
Refer to the following diagram to answer the questions that follow.
An increase in the number of buyers would cause the demand curve to:
A) shift from D₁ to D₃.
B) remain at D₁.
C) shift from D₁ to D₂.
D) shift from D₂ to D₁.
E) shift from D₂ to D₃.
An increase in the number of buyers would cause the demand curve to:
A) shift from D₁ to D₃.
B) remain at D₁.
C) shift from D₁ to D₂.
D) shift from D₂ to D₁.
E) shift from D₂ to D₃.
Question
Question
Question
Question
Question
Question
Question
Question
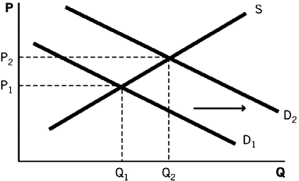
Refer to the following figure to answer the questions that follow.
The demand curve shift shown in the figure was caused by a(n):
A) increase in the input cost of the good.
B) increase in the price of a substitute of the good.
C) decrease in the number of firms selling the good.
D) decrease in the number of buyers in the market for the good.
E) expectation that the future price of this good will be higher than it is currently.
Question
Question
Question
Question
Question
Refer to the accompanying graph.If a tax is placed on a good and all else is held constant,we would assume that the supply curve would:
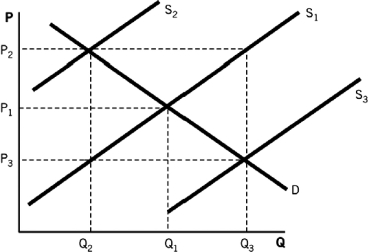
A) shift from S1 to S3.
B) remain at S1.
C) shift from S1 to S2.
D) shift from S2 to S1.
E) shift from S2 to S3.
A) shift from S1 to S3.
B) remain at S1.
C) shift from S1 to S2.
D) shift from S2 to S1.
E) shift from S2 to S3.
Question
Question
Question
Question
Question
Question
Question
Refer to the accompanying figure.What event would cause the change in the equilibrium?
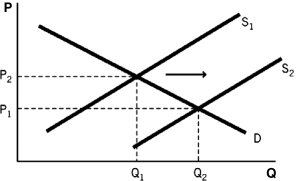
A) Consumers earn higher incomes.
B) Consumers earn lower incomes.
C) The price of an input increases.
D) Firms enter the market.
E) Firms expect the price to rise in the future.
A) Consumers earn higher incomes.
B) Consumers earn lower incomes.
C) The price of an input increases.
D) Firms enter the market.
E) Firms expect the price to rise in the future.
Question
Question
Question
Question
Question
Question
Question
Question
Question
Which of the following scenarios best describes the change in the equilibrium shown in the accompanying graph?
A) firms entering the market
B) firms leaving the market
C) buyers entering the market
D) buyers leaving the market
E) an input cost decreasing
A) firms entering the market
B) firms leaving the market
C) buyers entering the market
D) buyers leaving the market
E) an input cost decreasing
Question
Refer to the accompanying diagram.Which of the following scenarios would explain this change in equilibrium?
A) A number of firms left the market.
B) A number of buyers entered the market, and a number of firms entered the market.
C) The price of a complement of this good increased.
D) The price of a substitute of this good increased.
E) The price of this good decreased.
A) A number of firms left the market.
B) A number of buyers entered the market, and a number of firms entered the market.
C) The price of a complement of this good increased.
D) The price of a substitute of this good increased.
E) The price of this good decreased.
Question
Question
Question
Question
Question
Question
Question
Question
Question
Refer to the following figure to answer the questions that follow.
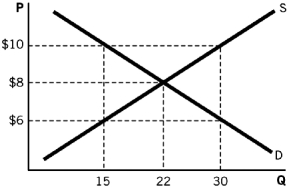
Which of the quantity (Q)and price (P)combinations in the figure represents the market at competitive equilibrium?
A) (15, $10)
B) (15, $6)
C) (22, $8)
D) (30, $6)
E) (30, $10)
Which of the quantity (Q)and price (P)combinations in the figure represents the market at competitive equilibrium?
A) (15, $10)
B) (15, $6)
C) (22, $8)
D) (30, $6)
E) (30, $10)
Question
Question
Refer to the following figure to answer the questions that follow.
According to the figure,if the price is $10,there is a:
A) shortage of 15 units.
B) surplus of 15 units.
C) shortage of 30 units.
D) surplus of 30 units.
E) surplus of 22 units.
According to the figure,if the price is $10,there is a:
A) shortage of 15 units.
B) surplus of 15 units.
C) shortage of 30 units.
D) surplus of 30 units.
E) surplus of 22 units.
Question
Question
Question
Question
Question
Question
Question

Unlock Deck
Sign up to unlock the cards in this deck!
Unlock Deck
Unlock Deck
1/160
Play
Full screen (f)
Deck 3: The Market at Work: Supply and Demand
1
Which of the following will cause the demand curve for burgers to shift to the right?
A) The price of burgers decreases.
B) The price of burgers increases.
C) The price of burger buns increases.
D) A study is published by the National Association for Burger Research that says eating burgers can reduce the risk for bad acne.
E) The price of steak decreases.
A) The price of burgers decreases.
B) The price of burgers increases.
C) The price of burger buns increases.
D) A study is published by the National Association for Burger Research that says eating burgers can reduce the risk for bad acne.
E) The price of steak decreases.
A study is published by the National Association for Burger Research that says eating burgers can reduce the risk for bad acne.
2
Something is a normal good if the demand for the good:
A) increases as the consumer's income increases.
B) increases as the consumer's income decreases.
C) decreases if the price of a substitute good increases.
D) increases if the price of a complement good increases.
E) decreases as the income of the consumer increases.
A) increases as the consumer's income increases.
B) increases as the consumer's income decreases.
C) decreases if the price of a substitute good increases.
D) increases if the price of a complement good increases.
E) decreases as the income of the consumer increases.
increases as the consumer's income increases.
3
A change in which of the following will cause both a shift in supply and a shift in demand?
A) the number of firms in an industry
B) tastes and preferences
C) income
D) expectations of future prices
E) the number of buyers
A) the number of firms in an industry
B) tastes and preferences
C) income
D) expectations of future prices
E) the number of buyers
expectations of future prices
4
According to the law of demand,all other things being equal:
A) the quantity demanded falls when the price falls, and the quantity demanded rises when the price rises.
B) the quantity demanded falls when the price rises, and the quantity demanded rises when the price falls.
C) the demand falls when the price falls, and the demand rises when the price rises.
D) the demand falls when the price rises, and the demand rises when the price falls.
E) price and quantity are always positively correlated.
Unlock Deck
Unlock for access to all 160 flashcards in this deck.
Unlock Deck
k this deck
5
If the price of Gatorade increases,the equilibrium ________ of Powerade will ________ because of a shift in ________.
A) price; increase; demand
B) price; increase; supply
C) price; decrease; demand
D) quantity; decrease; supply
E) quantity; decrease; demand
A) price; increase; demand
B) price; increase; supply
C) price; decrease; demand
D) quantity; decrease; supply
E) quantity; decrease; demand
Unlock Deck
Unlock for access to all 160 flashcards in this deck.
Unlock Deck
k this deck
6
Which of the following situations would cause the demand curve to shift to the right?
A) a decrease in the number of consumers
B) a decrease in the number of producers
C) an increase in the price of a complement
D) an increase in the price of a substitute
E) a change in tastes and preferences
A) a decrease in the number of consumers
B) a decrease in the number of producers
C) an increase in the price of a complement
D) an increase in the price of a substitute
E) a change in tastes and preferences
Unlock Deck
Unlock for access to all 160 flashcards in this deck.
Unlock Deck
k this deck
7
Pepsi and Coke are considered substitute goods.Because of this,one would predict that,holding all else constant,if the price of Pepsi increases,we would see:
A) the demand curve for Coke shift to the right.
B) the demand curve for Coke shift to the left.
C) no change in the demand for Coke.
D) the demand curve for Pepsi shift to the right.
E) the demand curve for Pepsi shift to the left.
A) the demand curve for Coke shift to the right.
B) the demand curve for Coke shift to the left.
C) no change in the demand for Coke.
D) the demand curve for Pepsi shift to the right.
E) the demand curve for Pepsi shift to the left.
Unlock Deck
Unlock for access to all 160 flashcards in this deck.
Unlock Deck
k this deck
8
Two goods that are used together are called:
A) complements.
B) inferior.
C) co-dependents.
D) substitutes.
E) normal.
A) complements.
B) inferior.
C) co-dependents.
D) substitutes.
E) normal.
Unlock Deck
Unlock for access to all 160 flashcards in this deck.
Unlock Deck
k this deck
9
A demand schedule:
A) is a curve representing the relationship between the price of a good or service and the quantity demanded.
B) is a list of goods and services demanded at different prices.
C) is a table representing the relationship between the price of a good or service and the quantity demanded.
D) can only be used to analyze the individual's demand for a good or service.
E) can only be used to analyze the entire market's demand for a good or service.
Unlock Deck
Unlock for access to all 160 flashcards in this deck.
Unlock Deck
k this deck
10
Something is an inferior good if the demand for the good:
A) increases as the consumer's income increases.
B) increases as the consumer's income decreases.
C) decreases as the price of a complement increases.
D) decreases as the price of a substitute increases.
E) decreases as the consumer's income decreases.
A) increases as the consumer's income increases.
B) increases as the consumer's income decreases.
C) decreases as the price of a complement increases.
D) decreases as the price of a substitute increases.
E) decreases as the consumer's income decreases.
Unlock Deck
Unlock for access to all 160 flashcards in this deck.
Unlock Deck
k this deck
11
Refer to the table below.
Assume that the market for iPods has only two consumers: Chuck and Ryan.According to the table above,if the price of an iPod is $70,the market will demand ________ iPods.
A) 8
B) 6
C) 5
D) 28
E) 45
Assume that the market for iPods has only two consumers: Chuck and Ryan.According to the table above,if the price of an iPod is $70,the market will demand ________ iPods.
A) 8
B) 6
C) 5
D) 28
E) 45
Unlock Deck
Unlock for access to all 160 flashcards in this deck.
Unlock Deck
k this deck
12
Consider the following demand schedules for New York Mets T-shirts:
Holding all else constant,which of the following demand schedules is most likely to represent New York Mets T-shirts if they win the World Series?
A)
B)
C)
D)
E)
Holding all else constant,which of the following demand schedules is most likely to represent New York Mets T-shirts if they win the World Series?
A)
B)
C)
D)
E)
Unlock Deck
Unlock for access to all 160 flashcards in this deck.
Unlock Deck
k this deck
13
A decrease in demand is represented by a:
A) shift of the demand curve to the right.
B) movement along the demand curve to the right.
C) shift of the demand curve to the left.
D) movement along the demand curve to the left.
E) shift in the supply curve.
A) shift of the demand curve to the right.
B) movement along the demand curve to the right.
C) shift of the demand curve to the left.
D) movement along the demand curve to the left.
E) shift in the supply curve.
Unlock Deck
Unlock for access to all 160 flashcards in this deck.
Unlock Deck
k this deck
14
According to the figure below,at the price of $5:
A) the equilibrium quantity is 500.
B) the quantity demanded is 500.
C) the demand is 500.
D) there is a surplus.
E) there is a shortage.
A) the equilibrium quantity is 500.
B) the quantity demanded is 500.
C) the demand is 500.
D) there is a surplus.
E) there is a shortage.
Unlock Deck
Unlock for access to all 160 flashcards in this deck.
Unlock Deck
k this deck
15
Which of the following would cause a normal good's demand curve to shift to the left?
A) Income decreases.
B) Income increases.
C) The price increases.
D) The price decreases.
E) The input prices increase.
A) Income decreases.
B) Income increases.
C) The price increases.
D) The price decreases.
E) The input prices increase.
Unlock Deck
Unlock for access to all 160 flashcards in this deck.
Unlock Deck
k this deck
16
When the price of an hour of tutoring increases,the:
A) demand for tutoring decreases.
B) demand for tutoring increases.
C) demand curve for tutoring shifts.
D) quantity demanded for tutoring increases.
E) quantity demanded for tutoring decreases.
A) demand for tutoring decreases.
B) demand for tutoring increases.
C) demand curve for tutoring shifts.
D) quantity demanded for tutoring increases.
E) quantity demanded for tutoring decreases.
Unlock Deck
Unlock for access to all 160 flashcards in this deck.
Unlock Deck
k this deck
17
In March 2012,the state of California started requiring that all packaging for food and drink with the additive 4-methylimidazole (4-MI)be clearly labeled with a cancer warning.Because of this,both Pepsi and Coke changed their formulas to eliminate 4-MI as an ingredient.If Pepsi and Coke did NOT change their formulas,holding all else constant,what do you think would have happened to the demand for these goods,assuming Pepsi and Coke were in a competitive market?
A) The demand curve for both Pepsi and Coke would have shifted to the right, causing the price of both products to decrease and the profits for the companies to fall.
B) The demand curve for Pepsi and Coke would have remained unchanged, but the price of both products would have decreased and the profits for the companies would have fallen.
C) The demand curve for Pepsi and Coke would have decreased, but the prices and profits would not have changed.
D) The demand curve for only one of them would change because Pepsi and Coke are substitutes.
E) The demand curve for Pepsi and Coke would have shifted to the left, causing the price of both products to decrease and the profits for both companies to fall.
Unlock Deck
Unlock for access to all 160 flashcards in this deck.
Unlock Deck
k this deck
18
The price of good X increases by 25%,causing the quantity consumed of good Y to decrease by 10%.If everything else is held constant in the economy,we can say with certainty that good X and good Y are:
A) substitutes.
B) inferior.
C) complements.
D) normal.
E) unrelated.
A) substitutes.
B) inferior.
C) complements.
D) normal.
E) unrelated.
Unlock Deck
Unlock for access to all 160 flashcards in this deck.
Unlock Deck
k this deck
19
If the price of a good increases,holding all else constant,the:
A) demand for all of that good's substitutes will decrease.
B) quantity demanded for that good will increase.
C) demand for all of that good's complements will increase.
D) demand for all of that good's substitutes will increase.
E) demand curve will shift to the left.
A) demand for all of that good's substitutes will decrease.
B) quantity demanded for that good will increase.
C) demand for all of that good's complements will increase.
D) demand for all of that good's substitutes will increase.
E) demand curve will shift to the left.
Unlock Deck
Unlock for access to all 160 flashcards in this deck.
Unlock Deck
k this deck
20
Which of the following would cause the demand curve to shift to the right?
A) Income decreases for an inferior good.
B) Income decreases for a normal good.
C) Tastes and preferences decrease.
D) The price of a substitute decreases.
E) The price of a complement increases.
A) Income decreases for an inferior good.
B) Income decreases for a normal good.
C) Tastes and preferences decrease.
D) The price of a substitute decreases.
E) The price of a complement increases.
Unlock Deck
Unlock for access to all 160 flashcards in this deck.
Unlock Deck
k this deck
21
Refer to the following figure to answer the questions that follow.
Which of the following scenarios would explain the change in equilibrium shown in the figure?
A) an increase in an input price
B) a decrease in the number of buyers in a market
C) an increase in the price of a substitute good
D) an increase in the expected future price
E) a negative technological change
Unlock Deck
Unlock for access to all 160 flashcards in this deck.
Unlock Deck
k this deck
22
As more people migrated West during the gold rush,what do you think happened to the demand curve in most Western markets,holding all else constant?
A) The demand curve shifted to the right.
B) The demand curve shifted to the left.
C) There was no shift, but there was an increase in quantity demanded.
D) There was no shift, but there was a decrease in quantity demanded.
E) There was no shift, nor any increase or decrease in quantity demanded.
A) The demand curve shifted to the right.
B) The demand curve shifted to the left.
C) There was no shift, but there was an increase in quantity demanded.
D) There was no shift, but there was a decrease in quantity demanded.
E) There was no shift, nor any increase or decrease in quantity demanded.
Unlock Deck
Unlock for access to all 160 flashcards in this deck.
Unlock Deck
k this deck
23
Assume there are 100 suppliers of widgets in the widget market.Half of these suppliers supply 35 widgets to the market each,a quarter of these suppliers supply 40 widgets to the market each,and a quarter of these suppliers supply 50 widgets to the market each.What is the market supply for widgets?
A) 100
B) 125
C) 400
D) 4,000
E) 1,750
A) 100
B) 125
C) 400
D) 4,000
E) 1,750
Unlock Deck
Unlock for access to all 160 flashcards in this deck.
Unlock Deck
k this deck
24
Which of the following will cause a movement along a good's supply curve?
A) The price of input increases.
B) The price of the good increases.
C) The production process of the good becomes more efficient.
D) More firms enter the market.
E) The government places a subsidy on the producer of the good.
A) The price of input increases.
B) The price of the good increases.
C) The production process of the good becomes more efficient.
D) More firms enter the market.
E) The government places a subsidy on the producer of the good.
Unlock Deck
Unlock for access to all 160 flashcards in this deck.
Unlock Deck
k this deck
25
An expectation of a lower price in the future will:
A) increase current demand.
B) decrease current demand.
C) not change demand.
D) cause demand to stay the same but increase the quantity demanded.
E) cause demand to stay the same but decrease the quantity demanded.
A) increase current demand.
B) decrease current demand.
C) not change demand.
D) cause demand to stay the same but increase the quantity demanded.
E) cause demand to stay the same but decrease the quantity demanded.
Unlock Deck
Unlock for access to all 160 flashcards in this deck.
Unlock Deck
k this deck
26
Chuck drives past the same gas station every day.He realizes that the gas station always changes its prices on Tuesdays but keeps the price steady the rest of the week.On Saturday,Chuck turns on the news and hears a report projecting that the price of gasoline is going to increase.Holding all else constant,what do you think would happen to Chuck's demand for gasoline on Monday?
A) His demand would shift to the right.
B) His demand would shift to the left.
C) You would see a movement down on his demand curve but no shift.
D) You would see a movement up on his demand curve but no shift.
E) You would see nothing happen to his demand curve until the price changed on Tuesday.
A) His demand would shift to the right.
B) His demand would shift to the left.
C) You would see a movement down on his demand curve but no shift.
D) You would see a movement up on his demand curve but no shift.
E) You would see nothing happen to his demand curve until the price changed on Tuesday.
Unlock Deck
Unlock for access to all 160 flashcards in this deck.
Unlock Deck
k this deck
27
Refer to the following diagram to answer the questions that follow.
If consumers expect the price of a good to decrease in the future and all else is held constant,we would assume that the demand curve would:
A) shift from D₁ to D₃.
B) remain at D₁.
C) shift from D₁ to D₂.
D) shift from D₂ to D₁.
E) shift from D₂ to D₃.
If consumers expect the price of a good to decrease in the future and all else is held constant,we would assume that the demand curve would:
A) shift from D₁ to D₃.
B) remain at D₁.
C) shift from D₁ to D₂.
D) shift from D₂ to D₁.
E) shift from D₂ to D₃.
Unlock Deck
Unlock for access to all 160 flashcards in this deck.
Unlock Deck
k this deck
28
Refer to the accompanying figure.When the price changes from P₁ to P₂,we will see a(n):
A) decrease in supply from Q1 to Q2.
B) increase in supply from Q2 to Q1.
C) decrease in quantity supplied from Q1 to Q2.
D) increase in quantity supplied from Q2 to Q1.
E) shift of the supply curve.
A) decrease in supply from Q1 to Q2.
B) increase in supply from Q2 to Q1.
C) decrease in quantity supplied from Q1 to Q2.
D) increase in quantity supplied from Q2 to Q1.
E) shift of the supply curve.
Unlock Deck
Unlock for access to all 160 flashcards in this deck.
Unlock Deck
k this deck
29
As the life expectancy in the United States increases,which of the following could likely happen to the demand curve for items such as health care,cancer treatments,and nursing facilities,holding all else constant,and why?
A) There would be a shift leftward because individuals are healthier.
B) There would be a shift rightward because the cost of these items is falling.
C) There would be a shift rightward because there will be more buyers in these markets.
D) There would be a shift leftward because Social Security benefits are running out.
E) They will stay the same because these changes would affect the supply curve and not the demand curve.
Unlock Deck
Unlock for access to all 160 flashcards in this deck.
Unlock Deck
k this deck
30
The law of supply states that,all other things being equal:
A) the quantity supplied falls when the price falls, and the quantity supplied rises when the price rises.
B) the quantity supplied falls when the price rises, and the quantity supplied rises when the price falls.
C) the supply falls when the price falls, and the demand rises when the price rises.
D) the supply falls when the price rises, and the demand rises when the price falls.
E) price and quantity are always negatively correlated.
Unlock Deck
Unlock for access to all 160 flashcards in this deck.
Unlock Deck
k this deck
31
Companies use advertising to shift consumer demand.On which of the following demand shifters do you think advertisers most often rely?
A) changes in income
B) the price of related goods
C) changes in tastes and preferences
D) the number of buyers
E) expectations regarding the future price
A) changes in income
B) the price of related goods
C) changes in tastes and preferences
D) the number of buyers
E) expectations regarding the future price
Unlock Deck
Unlock for access to all 160 flashcards in this deck.
Unlock Deck
k this deck
32
Refer to the following diagram to answer the questions that follow.
An increase in the number of buyers would cause the demand curve to:
A) shift from D₁ to D₃.
B) remain at D₁.
C) shift from D₁ to D₂.
D) shift from D₂ to D₁.
E) shift from D₂ to D₃.
An increase in the number of buyers would cause the demand curve to:
A) shift from D₁ to D₃.
B) remain at D₁.
C) shift from D₁ to D₂.
D) shift from D₂ to D₁.
E) shift from D₂ to D₃.
Unlock Deck
Unlock for access to all 160 flashcards in this deck.
Unlock Deck
k this deck
33
A change in quantity supplied:
A) is represented by a shift in the supply curve.
B) is represented by a movement along the supply curve.
C) happens only when the price increases.
D) happens only when the price decreases.
E) is positive if the price of the good decreases.
A) is represented by a shift in the supply curve.
B) is represented by a movement along the supply curve.
C) happens only when the price increases.
D) happens only when the price decreases.
E) is positive if the price of the good decreases.
Unlock Deck
Unlock for access to all 160 flashcards in this deck.
Unlock Deck
k this deck
34
Changes in population can:
A) alter the supply of a good or service in an area.
B) shift the supply curve of a good or service in an area.
C) cause the price of a good or service to increase in an area but cannot cause the price to decrease.
D) cause the price of a good or service to decrease in an area but cannot cause the price to increase.
E) shift the demand curve of a good or service in an area.
Unlock Deck
Unlock for access to all 160 flashcards in this deck.
Unlock Deck
k this deck
35
A supply schedule:
A) is a curve representing the relationship between the price of a good or service and the quantity supplied.
B) is a list of goods and services supplied at different prices.
C) is a table representing the relationship between the price of a good or service and the quantity supplied.
D) can be used only to analyze individuals' supply for a good or service.
E) can be used only to analyze the entire market's supply for a good or service.
Unlock Deck
Unlock for access to all 160 flashcards in this deck.
Unlock Deck
k this deck
36
Higher input costs:
A) reduce profits.
B) increase profits.
C) shift the demand curve.
D) always happen during a recession.
E) provide an incentive to hire more workers.
A) reduce profits.
B) increase profits.
C) shift the demand curve.
D) always happen during a recession.
E) provide an incentive to hire more workers.
Unlock Deck
Unlock for access to all 160 flashcards in this deck.
Unlock Deck
k this deck
37
The demand curve for a good will shift to the right if,holding all else constant:
A) consumers expect future prices to decrease.
B) an input cost of the item goes up.
C) consumers expect future prices to increase.
D) the price of the good goes down.
E) the price of a substitute good goes down.
A) consumers expect future prices to decrease.
B) an input cost of the item goes up.
C) consumers expect future prices to increase.
D) the price of the good goes down.
E) the price of a substitute good goes down.
Unlock Deck
Unlock for access to all 160 flashcards in this deck.
Unlock Deck
k this deck
38
Inputs are:
A) goods that are used together.
B) goods that are used in place of one another.
C) goods that you demand more of as your income increases.
D) goods that you demand less of as your income increases.
E) resources that firms use in the production of final goods and services.
A) goods that are used together.
B) goods that are used in place of one another.
C) goods that you demand more of as your income increases.
D) goods that you demand less of as your income increases.
E) resources that firms use in the production of final goods and services.
Unlock Deck
Unlock for access to all 160 flashcards in this deck.
Unlock Deck
k this deck
39
If the cost of flour increases from $3 to $5 a bag,you could predict the supply curve for bagels to:
A) shift to the right.
B) shift to the left.
C) become steeper.
D) become flatter.
E) increase.
A) shift to the right.
B) shift to the left.
C) become steeper.
D) become flatter.
E) increase.
Unlock Deck
Unlock for access to all 160 flashcards in this deck.
Unlock Deck
k this deck
40
Refer to the following figure to answer the questions that follow.
The demand curve shift shown in the figure was caused by a(n):
A) increase in the input cost of the good.
B) increase in the price of a substitute of the good.
C) decrease in the number of firms selling the good.
D) decrease in the number of buyers in the market for the good.
E) expectation that the future price of this good will be higher than it is currently.
Unlock Deck
Unlock for access to all 160 flashcards in this deck.
Unlock Deck
k this deck
41
When the government places a tax on the producer of a good or service:
A) the demand curve for the good or service shifts to the right.
B) the demand curve for the good or service shifts to the left.
C) the supply curve for the good or service shifts to the right.
D) the supply curve for the good or service shifts to the left.
E) both the supply and demand curves for the good or service shift to the left.
Unlock Deck
Unlock for access to all 160 flashcards in this deck.
Unlock Deck
k this deck
42
When the demand curve shifts to the left and all else is held constant,the equilibrium price ________ and the equilibrium quantity ________.
A) falls; rises
B) rises; falls
C) falls; falls
D) rises; rises
E) falls; remains constant
A) falls; rises
B) rises; falls
C) falls; falls
D) rises; rises
E) falls; remains constant
Unlock Deck
Unlock for access to all 160 flashcards in this deck.
Unlock Deck
k this deck
43
When the government places a tax on a good and all else is held constant,which of the following would most likely happen?
A) The overall consumption of the good decreases.
B) The price the buyer pays for the good decreases.
C) The supply curve shifts to the right.
D) The government receives no tax revenue if the tax is more than 20%.
E) The price and quantity adjust back to the market equilibrium point before the tax.
A) The overall consumption of the good decreases.
B) The price the buyer pays for the good decreases.
C) The supply curve shifts to the right.
D) The government receives no tax revenue if the tax is more than 20%.
E) The price and quantity adjust back to the market equilibrium point before the tax.
Unlock Deck
Unlock for access to all 160 flashcards in this deck.
Unlock Deck
k this deck
44
On January 30,2012,Starbucks India announced plans to open 50 cafés.What would you expect to happen to the market for coffee in India,assuming all other factors are held constant?
A) The demand for coffee will increase in India.
B) The demand for coffee will decrease in India.
C) Both the supply and demand for coffee will increase in India.
D) The supply for coffee will increase in India.
E) The supply for coffee will decrease in India.
A) The demand for coffee will increase in India.
B) The demand for coffee will decrease in India.
C) Both the supply and demand for coffee will increase in India.
D) The supply for coffee will increase in India.
E) The supply for coffee will decrease in India.
Unlock Deck
Unlock for access to all 160 flashcards in this deck.
Unlock Deck
k this deck
45
Refer to the accompanying graph.If a tax is placed on a good and all else is held constant,we would assume that the supply curve would:
A) shift from S1 to S3.
B) remain at S1.
C) shift from S1 to S2.
D) shift from S2 to S1.
E) shift from S2 to S3.
A) shift from S1 to S3.
B) remain at S1.
C) shift from S1 to S2.
D) shift from S2 to S1.
E) shift from S2 to S3.
Unlock Deck
Unlock for access to all 160 flashcards in this deck.
Unlock Deck
k this deck
46
When a hurricane rips through Florida,the price of oranges rises because the:
A) demand curve shifts to the left.
B) supply curve shifts to the right.
C) demand curve shifts to the right.
D) supply curve shifts to the left.
E) supply and demand curves both shift to the left.
A) demand curve shifts to the left.
B) supply curve shifts to the right.
C) demand curve shifts to the right.
D) supply curve shifts to the left.
E) supply and demand curves both shift to the left.
Unlock Deck
Unlock for access to all 160 flashcards in this deck.
Unlock Deck
k this deck
47
Old Navy stocks more Bermuda shorts during the summer months than in the winter months.The resulting shift in supply explains:
A) the change in technology.
B) the change in income.
C) price expectations.
D) the change in input cost.
E) the number of firms in a market.
A) the change in technology.
B) the change in income.
C) price expectations.
D) the change in input cost.
E) the number of firms in a market.
Unlock Deck
Unlock for access to all 160 flashcards in this deck.
Unlock Deck
k this deck
48
An improvement in technology:
A) is one way to shift the demand curve.
B) always increases producers' profits.
C) allows a producer to decrease output with the same amount of input.
D) allows a producer to increase output with the same amount of input.
E) shifts the supply curve to the left.
A) is one way to shift the demand curve.
B) always increases producers' profits.
C) allows a producer to decrease output with the same amount of input.
D) allows a producer to increase output with the same amount of input.
E) shifts the supply curve to the left.
Unlock Deck
Unlock for access to all 160 flashcards in this deck.
Unlock Deck
k this deck
49
In 1993,the government increased the tax on gasoline producers from 14.1 cents per gallon to 18.4 cents per gallon.Our model of supply and demand predicts that:
A) the demand for gasoline decreased.
B) the supply for gasoline increased.
C) the demand for gasoline increased.
D) the supply for gasoline decreased.
E) both the supply and demand for gasoline decreased.
A) the demand for gasoline decreased.
B) the supply for gasoline increased.
C) the demand for gasoline increased.
D) the supply for gasoline decreased.
E) both the supply and demand for gasoline decreased.
Unlock Deck
Unlock for access to all 160 flashcards in this deck.
Unlock Deck
k this deck
50
When the number of firms in a market decreases:
A) the demand curve shifts to the left.
B) the demand curve shifts to the right.
C) the supply curve shifts to the right.
D) the supply curve shifts to the left.
E) both the supply and the demand curves shift to the left.
A) the demand curve shifts to the left.
B) the demand curve shifts to the right.
C) the supply curve shifts to the right.
D) the supply curve shifts to the left.
E) both the supply and the demand curves shift to the left.
Unlock Deck
Unlock for access to all 160 flashcards in this deck.
Unlock Deck
k this deck
51
If the price of rubber were to increase by 20% over the fiscal year and if all else were held constant,what would you expect to happen to the supply curve of tires that are sold separately from automobiles?
A) The supply curve would shift to the right.
B) The quantity supplied would increase.
C) The supply curve would shift to the left.
D) The supply curve would shift down.
E) Nothing; the cost of rubber has no impact on the supply of tires.
A) The supply curve would shift to the right.
B) The quantity supplied would increase.
C) The supply curve would shift to the left.
D) The supply curve would shift down.
E) Nothing; the cost of rubber has no impact on the supply of tires.
Unlock Deck
Unlock for access to all 160 flashcards in this deck.
Unlock Deck
k this deck
52
Refer to the accompanying figure.What event would cause the change in the equilibrium?
A) Consumers earn higher incomes.
B) Consumers earn lower incomes.
C) The price of an input increases.
D) Firms enter the market.
E) Firms expect the price to rise in the future.
A) Consumers earn higher incomes.
B) Consumers earn lower incomes.
C) The price of an input increases.
D) Firms enter the market.
E) Firms expect the price to rise in the future.
Unlock Deck
Unlock for access to all 160 flashcards in this deck.
Unlock Deck
k this deck
53
When the price of ground beef increases and all else is held constant,we would expect the supply of hamburgers to ________,causing the price to ________.
A) decrease; increase
B) decease; decrease
C) stay the same; stay the same
D) increase; increase
E) increase; decrease
A) decrease; increase
B) decease; decrease
C) stay the same; stay the same
D) increase; increase
E) increase; decrease
Unlock Deck
Unlock for access to all 160 flashcards in this deck.
Unlock Deck
k this deck
54
Which of the following could cause the supply curve for the market for oranges to shift to the left?
A) an increase in the income of consumers of oranges
B) a decrease in the cost of workers
C) an increase in the price of orange juice
D) a new study saying that eating oranges will give you heart disease
E) a severe hurricane in Florida
A) an increase in the income of consumers of oranges
B) a decrease in the cost of workers
C) an increase in the price of orange juice
D) a new study saying that eating oranges will give you heart disease
E) a severe hurricane in Florida
Unlock Deck
Unlock for access to all 160 flashcards in this deck.
Unlock Deck
k this deck
55
Which of the following changes in the coffee market would shift the supply curve to the right?
A) A study finds that drinking coffee leads to higher grades.
B) The wage for employees in the coffee business decreases.
C) The income in the economy increases.
D) Firms expect the price of coffee to increase in the future.
E) Fifty Starbucks coffee shops close down.
A) A study finds that drinking coffee leads to higher grades.
B) The wage for employees in the coffee business decreases.
C) The income in the economy increases.
D) Firms expect the price of coffee to increase in the future.
E) Fifty Starbucks coffee shops close down.
Unlock Deck
Unlock for access to all 160 flashcards in this deck.
Unlock Deck
k this deck
56
A subsidy:
A) is a payment made by the government to encourage consumption or production of a good or service.
B) is a payment taken by the government to discourage consumption or production of a good or service.
C) shifts the demand curve of a product.
D) is designed to decrease the available supply of a good or service.
E) raises the cost of doing business.
Unlock Deck
Unlock for access to all 160 flashcards in this deck.
Unlock Deck
k this deck
57
When supply shifts to the right and demand stays constant,the equilibrium price ________ and the equilibrium quantity ________.
A) increases; decreases
B) increases; increases
C) decreases; decreases
D) decreases; increases
E) stays the same; increases
A) increases; decreases
B) increases; increases
C) decreases; decreases
D) decreases; increases
E) stays the same; increases
Unlock Deck
Unlock for access to all 160 flashcards in this deck.
Unlock Deck
k this deck
58
James specializes in college-level economics tutoring.He knows that during the two weeks before finals he can charge more for an hour of private tutoring.Expecting this price increase,James will:
A) supply less tutoring now, shifting supply to the left.
B) supply more tutoring now, shifting supply to the right.
C) supply less tutoring now, shifting supply to the right.
D) supply more tutoring now, shifting supply to the left.
E) change the price of tutoring without any shift in supply.
A) supply less tutoring now, shifting supply to the left.
B) supply more tutoring now, shifting supply to the right.
C) supply less tutoring now, shifting supply to the right.
D) supply more tutoring now, shifting supply to the left.
E) change the price of tutoring without any shift in supply.
Unlock Deck
Unlock for access to all 160 flashcards in this deck.
Unlock Deck
k this deck
59
Firm A notices that Firm B is making a profit by producing footballs.There is nothing stopping Firm A from entering the football market,so it does.Holding all else constant,the number of firms in the market will:
A) increase, causing demand to increase.
B) increase, causing the supply to shift up.
C) decrease, causing the supply to decrease.
D) decrease, causing the supply to increase.
E) increase, causing the supply to increase.
A) increase, causing demand to increase.
B) increase, causing the supply to shift up.
C) decrease, causing the supply to decrease.
D) decrease, causing the supply to increase.
E) increase, causing the supply to increase.
Unlock Deck
Unlock for access to all 160 flashcards in this deck.
Unlock Deck
k this deck
60
If a new french fry-cutting machine works twice as fast as the old machine,McDonald's would:
A) be willing to produce and sell fewer french fries at every price.
B) be making less profit.
C) be willing to produce and sell more french fries at every price.
D) lose customers.
E) pay its employees more.
A) be willing to produce and sell fewer french fries at every price.
B) be making less profit.
C) be willing to produce and sell more french fries at every price.
D) lose customers.
E) pay its employees more.
Unlock Deck
Unlock for access to all 160 flashcards in this deck.
Unlock Deck
k this deck
61
Which of the following scenarios best describes the change in the equilibrium shown in the accompanying graph?
A) firms entering the market
B) firms leaving the market
C) buyers entering the market
D) buyers leaving the market
E) an input cost decreasing
A) firms entering the market
B) firms leaving the market
C) buyers entering the market
D) buyers leaving the market
E) an input cost decreasing
Unlock Deck
Unlock for access to all 160 flashcards in this deck.
Unlock Deck
k this deck
62
Refer to the accompanying diagram.Which of the following scenarios would explain this change in equilibrium?
A) A number of firms left the market.
B) A number of buyers entered the market, and a number of firms entered the market.
C) The price of a complement of this good increased.
D) The price of a substitute of this good increased.
E) The price of this good decreased.
A) A number of firms left the market.
B) A number of buyers entered the market, and a number of firms entered the market.
C) The price of a complement of this good increased.
D) The price of a substitute of this good increased.
E) The price of this good decreased.
Unlock Deck
Unlock for access to all 160 flashcards in this deck.
Unlock Deck
k this deck
63
Taxes cause the equilibrium price of a good to:
A) increase.
B) decrease.
C) remain the same.
D) go up only for producers.
E) go down only for consumers.
A) increase.
B) decrease.
C) remain the same.
D) go up only for producers.
E) go down only for consumers.
Unlock Deck
Unlock for access to all 160 flashcards in this deck.
Unlock Deck
k this deck
64
Some studies have shown that eating chocolate before a test can increase brain activity,thereby causing students to score higher on exams.When these findings were announced,the price and quantity sold of chocolate increased in college towns.One reason for this could have been that the:
A) producers increased their supply of chocolate.
B) consumers increased their demand for chocolate.
C) producers increased their supply of chocolate and consumers increased their demand for chocolate.
D) producers decreased their supply of chocolate.
E) consumers decreased their demand of chocolate.
Unlock Deck
Unlock for access to all 160 flashcards in this deck.
Unlock Deck
k this deck
65
Susie decided to start selling lemonade on her street.The other kids in the neighborhood noticed that Susie was making a lot of money selling lemonade.These kids decided to open their own lemonade stand.When they opened their own lemonade stand,the equilibrium price ________ and the equilibrium quantity ________.
A) increased; decreased
B) decreased; increased
C) increased; increased
D) decreased; decreased
E) stayed the same; stayed the same
A) increased; decreased
B) decreased; increased
C) increased; increased
D) decreased; decreased
E) stayed the same; stayed the same
Unlock Deck
Unlock for access to all 160 flashcards in this deck.
Unlock Deck
k this deck
66
A "twofold" change is when:
A) income goes up and then it goes down.
B) the equilibrium price of both a complement and a substitute changes.
C) supply and demand both shift.
D) equilibrium price and equilibrium quantity both change.
E) some input costs go up and some go down.
A) income goes up and then it goes down.
B) the equilibrium price of both a complement and a substitute changes.
C) supply and demand both shift.
D) equilibrium price and equilibrium quantity both change.
E) some input costs go up and some go down.
Unlock Deck
Unlock for access to all 160 flashcards in this deck.
Unlock Deck
k this deck
67
If all else is held constant,what would happen to the equilibrium price and quantity of iPhones if the price of an Android phone decreased?
A) They would both increase.
B) They would both decrease.
C) One would increase and one would decrease, but we do not know which would do what.
D) The price would increase and the quantity would decrease.
E) The price would decrease and the quantity would increase.
A) They would both increase.
B) They would both decrease.
C) One would increase and one would decrease, but we do not know which would do what.
D) The price would increase and the quantity would decrease.
E) The price would decrease and the quantity would increase.
Unlock Deck
Unlock for access to all 160 flashcards in this deck.
Unlock Deck
k this deck
68
When firms in a market expect the price of their product to rise,the supply curve of their good ________,causing the equilibrium price to ________.
A) decreases; rise
B) decreases; fall
C) increases; fall
D) increases; rise
E) increases; rise and the equilibrium quantity to fall
A) decreases; rise
B) decreases; fall
C) increases; fall
D) increases; rise
E) increases; rise and the equilibrium quantity to fall
Unlock Deck
Unlock for access to all 160 flashcards in this deck.
Unlock Deck
k this deck
69
If all else is held constant and the price of leather decreases,we would expect that the equilibrium quantity of footballs would ________ and the equilibrium price would ________.
A) fall; rise
B) rise; fall
C) fall; fall
D) rise; rise
E) fall; remain constant
A) fall; rise
B) rise; fall
C) fall; fall
D) rise; rise
E) fall; remain constant
Unlock Deck
Unlock for access to all 160 flashcards in this deck.
Unlock Deck
k this deck
70
What would happen to the equilibrium price and quantity of shirts if the price of cotton decreases and all else is held constant?
A) The price falls and the quantity rises.
B) The price rises and the quantity falls.
C) The price falls and the quantity falls.
D) The price rises and the quantity rises.
E) The price falls and the quantity remains constant.
A) The price falls and the quantity rises.
B) The price rises and the quantity falls.
C) The price falls and the quantity falls.
D) The price rises and the quantity rises.
E) The price falls and the quantity remains constant.
Unlock Deck
Unlock for access to all 160 flashcards in this deck.
Unlock Deck
k this deck
71
Refer to the following figure to answer the questions that follow.
Which of the quantity (Q)and price (P)combinations in the figure represents the market at competitive equilibrium?
A) (15, $10)
B) (15, $6)
C) (22, $8)
D) (30, $6)
E) (30, $10)
Which of the quantity (Q)and price (P)combinations in the figure represents the market at competitive equilibrium?
A) (15, $10)
B) (15, $6)
C) (22, $8)
D) (30, $6)
E) (30, $10)
Unlock Deck
Unlock for access to all 160 flashcards in this deck.
Unlock Deck
k this deck
72
The economists at JET Consulting consider Campbell's Soup to be an inferior good.During a recession,when the income in the economy is decreasing,economists at JET Consulting would expect the demand curve for Campbell's Soup to shift to the ________,causing the equilibrium price to ________ and the equilibrium quantity to ________.
A) left; decrease; decrease
B) left; increase; increase
C) right; decrease; increase
D) right; increase; decrease
E) right; increase; increase
A) left; decrease; decrease
B) left; increase; increase
C) right; decrease; increase
D) right; increase; decrease
E) right; increase; increase
Unlock Deck
Unlock for access to all 160 flashcards in this deck.
Unlock Deck
k this deck
73
Refer to the following figure to answer the questions that follow.
According to the figure,if the price is $10,there is a:
A) shortage of 15 units.
B) surplus of 15 units.
C) shortage of 30 units.
D) surplus of 30 units.
E) surplus of 22 units.
According to the figure,if the price is $10,there is a:
A) shortage of 15 units.
B) surplus of 15 units.
C) shortage of 30 units.
D) surplus of 30 units.
E) surplus of 22 units.
Unlock Deck
Unlock for access to all 160 flashcards in this deck.
Unlock Deck
k this deck
74
If the number of buyers in a market increases from 50 to 100,you would expect the equilibrium price to ________ and the equilibrium quantity to ________,holding all else constant.
A) increase; increase
B) increase; decrease
C) decrease; decrease
D) decrease; increase
E) remain the same; remain the same
A) increase; increase
B) increase; decrease
C) decrease; decrease
D) decrease; increase
E) remain the same; remain the same
Unlock Deck
Unlock for access to all 160 flashcards in this deck.
Unlock Deck
k this deck
75
Oil is a main component in the manufacture of plastic bags.If the price of oil were to increase,the price of plastics bags would ________ and the quantity would ________.
A) increase; increase
B) increase; decrease
C) decrease; increase
D) decrease; decrease
E) increase; stay the same
A) increase; increase
B) increase; decrease
C) decrease; increase
D) decrease; decrease
E) increase; stay the same
Unlock Deck
Unlock for access to all 160 flashcards in this deck.
Unlock Deck
k this deck
76
During the winter months,many elderly persons leave their homes in northern New York and travel south to Florida or Arizona.What would you expect to happen to the equilibrium price and quantity of items most used by the elderly in northern New York?
A) They would both increase.
B) They would both decrease.
C) One would increase and one would decrease, but we do not know which would do what.
D) The price would increase and the quantity would decrease.
E) The price would decrease and the quantity would increase.
A) They would both increase.
B) They would both decrease.
C) One would increase and one would decrease, but we do not know which would do what.
D) The price would increase and the quantity would decrease.
E) The price would decrease and the quantity would increase.
Unlock Deck
Unlock for access to all 160 flashcards in this deck.
Unlock Deck
k this deck
77
The equilibrium price of peanut butter is $5.A study comes out that says the fat in peanut butter is good for your heart.Holding all other factors constant,which of the following scenarios could happen?
A) The price of peanut butter increases to $7 because of a supply shift.
B) The price of peanut butter decreases to $4 because of a supply shift.
C) The price of peanut butter decreases to $4 because of a demand shift.
D) The price of peanut butter increases to $7 because of a demand shift.
E) The price of peanut butter increases to $7 because of a demand and a supply shift.
Unlock Deck
Unlock for access to all 160 flashcards in this deck.
Unlock Deck
k this deck
78
When the demand curve shifts to the right and the supply curve is held constant:
A) the equilibrium price and quantity decrease.
B) the equilibrium price increases, and the equilibrium quantity decreases.
C) the equilibrium price decreases, and the equilibrium quantity increases.
D) the equilibrium price and quantity increase.
E) you see a movement along the demand curve.
A) the equilibrium price and quantity decrease.
B) the equilibrium price increases, and the equilibrium quantity decreases.
C) the equilibrium price decreases, and the equilibrium quantity increases.
D) the equilibrium price and quantity increase.
E) you see a movement along the demand curve.
Unlock Deck
Unlock for access to all 160 flashcards in this deck.
Unlock Deck
k this deck
79
A technological advancement for Good A will shift the ________ curve of Good A to the ________,making the equilibrium price ________.
A) demand; left; decrease
B) supply; right; increase
C) demand; right; increase
D) supply; left; increase
E) supply; right; decrease
A) demand; left; decrease
B) supply; right; increase
C) demand; right; increase
D) supply; left; increase
E) supply; right; decrease
Unlock Deck
Unlock for access to all 160 flashcards in this deck.
Unlock Deck
k this deck
80
The equilibrium price of teddy bears is $5.A study comes out that says owning a teddy bear causes one to earn a lower salary.If all other factors are held constant,which of the following scenarios could happen?
A) The price of teddy bears increases to $7 because of a supply shift.
B) The price of teddy bears decreases to $4 because of a supply shift.
C) The price of teddy bears decreases to $4 because of a demand shift.
D) The price of teddy bears increases to $7 because of a demand shift.
E) The price of teddy bears increases to $7 because of both a demand shift and a supply shift.
Unlock Deck
Unlock for access to all 160 flashcards in this deck.
Unlock Deck
k this deck
Unlock Deck
Unlock for access to all 160 flashcards in this deck.


