Deck 11: Simple Regression
Full screen (f)
Question
Question
If the null H0 : p = 0 hypothesis is true and the random variables have a joint normal distribution,then the random variable  - which is used to test the hypothesis that there is no linear association in the population between a pair of random variables-follows the:
A)degenerate distribution.
B)Student's t distribution.
C)chi-square distribution.
D)distribution.
- which is used to test the hypothesis that there is no linear association in the population between a pair of random variables-follows the:A)degenerate distribution.
B)Student's t distribution.
C)chi-square distribution.
D)distribution.
Question
Question
THE NEXT QUESTIONS ARE BASED ON THE FOLLOWING:
The below sample data set shows the relationship between two variables.
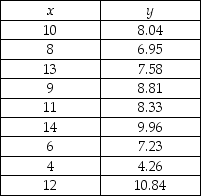
What is the value of cov(x,y)?
A)4.925
B)8.000
C)9.667
D)6.679
The below sample data set shows the relationship between two variables.
What is the value of cov(x,y)?
A)4.925
B)8.000
C)9.667
D)6.679
Question
Determine the least squares regression line.
A)
= 0.46 - 3.57x
B)
= 0.46 + 3.57x
C)
= 3.57 + 0.46x
D)
= 3.57 - 0.46x
A)
= 0.46 - 3.57x
B)
= 0.46 + 3.57x
C)
= 3.57 + 0.46x
D)
= 3.57 - 0.46x
Question
THE NEXT QUESTIONS ARE BASED ON THE FOLLOWING INFORMATION:
The manager of a used-car dealership is very interested in the resale price of used cars.The manager feels that the age of the car is important in determining the resale value.He collects data on the age and resale value of 15 cars and runs a regression analysis with the value of the car (in thousands of dollars)as the dependent variable and the age of the car (in years)as the independent variable.Unfortunately,the printout had lost some of the results,identified by"A" through"F".The partial results left are displayed below.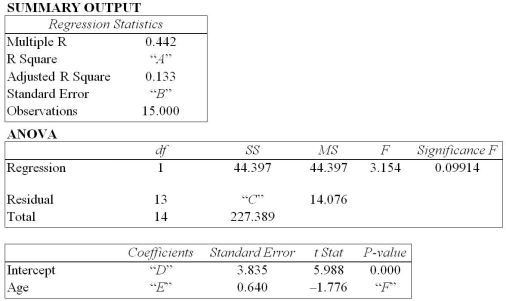
Which of the following is the value of "A"?
A)0.195
B)0.805
C)0.442
D)0.67
Question
A regression analysis between sales (in $1000)and advertising (in $)resulted in the following least squares line:  = 80,000 + 4x.This implies that:
A)an increase of $1 in advertising is expected to result in an increase of $4 in sales.
B)an increase of $4 in advertising is expected to result in an increase of $4,000 in sales.
C)an increase of $1 in advertising is expected to result in an increase of $80,000 in sales.
D)an increase of $1 in advertising is expected to result in an increase of $4,000 in sales.
= 80,000 + 4x.This implies that:A)an increase of $1 in advertising is expected to result in an increase of $4 in sales.
B)an increase of $4 in advertising is expected to result in an increase of $4,000 in sales.
C)an increase of $1 in advertising is expected to result in an increase of $80,000 in sales.
D)an increase of $1 in advertising is expected to result in an increase of $4,000 in sales.
Question
Question
Question
Question
Question
Question
Question
Question
Question
Question
Question
Question
Test H0 : β = 1 vs.H1 : β < 1 if the following regression information are given: b1 = 1.39,s  = 0.18,and n = 30.
A)reject H0 for α = 0.01
B)reject H0 for α = 0.10
C)reject H0 for α = 0.005
D)unable to reject H0 for α = 0.025
= 0.18,and n = 30.A)reject H0 for α = 0.01
B)reject H0 for α = 0.10
C)reject H0 for α = 0.005
D)unable to reject H0 for α = 0.025
Question
Question
THE NEXT QUESTIONS ARE BASED ON THE FOLLOWING INFORMATION:
The manager of a used-car dealership is very interested in the resale price of used cars.The manager feels that the age of the car is important in determining the resale value.He collects data on the age and resale value of 15 cars and runs a regression analysis with the value of the car (in thousands of dollars)as the dependent variable and the age of the car (in years)as the independent variable.Unfortunately,the printout had lost some of the results,identified by"A" through"F".The partial results left are displayed below.
Compute the value of "D."
A)9.35
B)3.06
C)9.82
D)22.96
Question
THE NEXT QUESTIONS ARE BASED ON THE FOLLOWING INFORMATION:
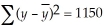
You want to explore the relationship between the grades students receive on their first quiz (x)and their first exam (y).The first quiz and test scores for a sample of eight students reveal the following summary statistics:
The sample correlation coefficient is:
A)0.691
B)0.806
C)0.749
D)0.209
You want to explore the relationship between the grades students receive on their first quiz (x)and their first exam (y).The first quiz and test scores for a sample of eight students reveal the following summary statistics:
The sample correlation coefficient is:
A)0.691
B)0.806
C)0.749
D)0.209
Question
THE NEXT QUESTIONS ARE BASED ON THE FOLLOWING INFORMATION:
The manager of a used-car dealership is very interested in the resale price of used cars.The manager feels that the age of the car is important in determining the resale value.He collects data on the age and resale value of 15 cars and runs a regression analysis with the value of the car (in thousands of dollars)as the dependent variable and the age of the car (in years)as the independent variable.Unfortunately,the printout had lost some of the results,identified by"A" through"F".The partial results left are displayed below.
In order to estimate with 95% confidence the expected value of y in a simple linear regression problem,a random sample of 10 observations is taken.Which of the following t-table values listed below would be used?
A)2.228
B)1.860
C)1.812
D)2.306
Question
THE NEXT QUESTIONS ARE BASED ON THE FOLLOWING INFORMATION:
The manager of a used-car dealership is very interested in the resale price of used cars.The manager feels that the age of the car is important in determining the resale value.He collects data on the age and resale value of 15 cars and runs a regression analysis with the value of the car (in thousands of dollars)as the dependent variable and the age of the car (in years)as the independent variable.Unfortunately,the printout had lost some of the results,identified by"A" through"F".The partial results left are displayed below.
What is the value of "C"?
A)172.25
B)162.42
C)140.03
D)182.99
Question
Question
THE NEXT QUESTIONS ARE BASED ON THE FOLLOWING INFORMATION:
The manager of a used-car dealership is very interested in the resale price of used cars.The manager feels that the age of the car is important in determining the resale value.He collects data on the age and resale value of 15 cars and runs a regression analysis with the value of the car (in thousands of dollars)as the dependent variable and the age of the car (in years)as the independent variable.Unfortunately,the printout had lost some of the results,identified by"A" through"F".The partial results left are displayed below.
What is the approximate value of "F"?
A)0.025
B)0.05
C)0.10
D)0.01
Question
THE NEXT QUESTIONS ARE BASED ON THE FOLLOWING INFORMATION:
You want to explore the relationship between the scores students receive on their first quiz and their first exam.You believe that there is a positive correlation between the two scores.
What is the appropriate decision rule?
A)reject H0 if r(n - 2)/ (1 - r2)> tn-2,α
B)reject H0 if r
/

> tn-2,α
C)reject H0 if r(n - 2)/
> tn-2,α
D)reject H0 if r(n - 2)/
> tn-2,α/2
You want to explore the relationship between the scores students receive on their first quiz and their first exam.You believe that there is a positive correlation between the two scores.
What is the appropriate decision rule?
A)reject H0 if r(n - 2)/ (1 - r2)> tn-2,α
B)reject H0 if r
/
> tn-2,α
C)reject H0 if r(n - 2)/
> tn-2,α
D)reject H0 if r(n - 2)/
> tn-2,α/2
Question
Question
THE NEXT QUESTIONS ARE BASED ON THE FOLLOWING INFORMATION:
You want to explore the relationship between the grades students receive on their first quiz (x)and their first exam (y).The first quiz and test scores for a sample of eight students reveal the following summary statistics:
What is the covariance between x and y?
A)4.83
B)7.11
C)50.50
D)58.92
You want to explore the relationship between the grades students receive on their first quiz (x)and their first exam (y).The first quiz and test scores for a sample of eight students reveal the following summary statistics:
What is the covariance between x and y?
A)4.83
B)7.11
C)50.50
D)58.92
Question
Question
Question
Question
THE NEXT QUESTIONS ARE BASED ON THE FOLLOWING INFORMATION:
You want to explore the relationship between the grades students receive on their first quiz (x)and their first exam (y).The first quiz and test scores for a sample of eight students reveal the following summary statistics:
Determine the value of the test statistic for testing H0 : p = 0
A)2.53
B)2.34
C)2.20
D)2.77
Question
Question
Question
Question
Question
THE NEXT QUESTIONS ARE BASED ON THE FOLLOWING INFORMATION:
The manager of a used-car dealership is very interested in the resale price of used cars.The manager feels that the age of the car is important in determining the resale value.He collects data on the age and resale value of 15 cars and runs a regression analysis with the value of the car (in thousands of dollars)as the dependent variable and the age of the car (in years)as the independent variable.Unfortunately,the printout had lost some of the results,identified by"A" through"F".The partial results left are displayed below.
What is the value of "B"?
A)2.58
B)6.67
C)3.75
D)3.95
Question
THE NEXT QUESTIONS ARE BASED ON THE FOLLOWING INFORMATION:
The manager of a used-car dealership is very interested in the resale price of used cars.The manager feels that the age of the car is important in determining the resale value.He collects data on the age and resale value of 15 cars and runs a regression analysis with the value of the car (in thousands of dollars)as the dependent variable and the age of the car (in years)as the independent variable.Unfortunately,the printout had lost some of the results,identified by"A" through"F".The partial results left are displayed below.
Calculate the value of "E."
A)1.136
B)-1.136
C)0.278
D)-0.278
Question
THE NEXT QUESTIONS ARE BASED ON THE FOLLOWING INFORMATION:
An insurance company analyst is interested in analyzing the dollar value of damage in automobile accidents.She collects data from 115 accidents,and records the amount of damage as well as the age of the driver.The results of her regression analysis are listed below.
SUMMARY OUTPUT
The regression equation is:
A)y = 10725.802 + 69.964x
B)y = 114 + 113x
C)y = 1535.215 + 34.625x
D)y = 113 + 114x
Question
THE NEXT QUESTIONS ARE BASED ON THE FOLLOWING INFORMATION:
A sample of 8 households was asked about their monthly income (x)and the number of hours they spend connected to the internet each month (y).The data yield the following statistics:
,
,
,
,
The slope of the regression line of hours on income is:
A)0.6337
B)0.9482
C)0.5541
D)0.6475
A sample of 8 households was asked about their monthly income (x)and the number of hours they spend connected to the internet each month (y).The data yield the following statistics:
,
,
,
,
The slope of the regression line of hours on income is:
A)0.6337
B)0.9482
C)0.5541
D)0.6475
Question
THE NEXT QUESTIONS ARE BASED ON THE FOLLOWING INFORMATION:
A sample of 8 households was asked about their monthly income (x)and the number of hours they spend connected to the internet each month (y).The data yield the following statistics:
,
,
,
,
The standard deviation of the households' monthly income is:
A)12.817
B)14.667
C)15.679
D)11.990
A sample of 8 households was asked about their monthly income (x)and the number of hours they spend connected to the internet each month (y).The data yield the following statistics:
,
,
,
,
The standard deviation of the households' monthly income is:
A)12.817
B)14.667
C)15.679
D)11.990
Question
THE NEXT QUESTIONS ARE BASED ON THE FOLLOWING INFORMATION:
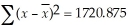
Consider a random sample of 25 observations of two variables x and y.The following summary statistics are available:
= 43.2,
= 195.6,
= 1357.2,
= 1253.4,and
= 4843.6.
Which of the following is the slope of the sample regression line?
A)0.43
B)54.85
C)0.978
D)3.57
Consider a random sample of 25 observations of two variables x and y.The following summary statistics are available:
= 43.2,
= 195.6,
= 1357.2,
= 1253.4,and
= 4843.6.
Which of the following is the slope of the sample regression line?
A)0.43
B)54.85
C)0.978
D)3.57
Question
THE NEXT QUESTIONS ARE BASED ON THE FOLLOWING INFORMATION:
Suppose we have the following information from a simple regression:
b0= 117.4,b1 = -14.39,s
= 0.18,s
= 0.18,n = 300,
= 4.3,SST = 17,045,and SSE = 12,053.
Which of the following would most likely represent a 95% confidence interval for the estimate of y,given x = ?
?
A)55.52 ± 0.72
B)55.52 ± 12.42
C)55.52 ± 40.4
D)55.52 ± 18.63
Suppose we have the following information from a simple regression:
b0= 117.4,b1 = -14.39,s
= 0.18,s
= 0.18,n = 300,
= 4.3,SST = 17,045,and SSE = 12,053.
Which of the following would most likely represent a 95% confidence interval for the estimate of y,given x =
?A)55.52 ± 0.72
B)55.52 ± 12.42
C)55.52 ± 40.4
D)55.52 ± 18.63
Question
THE NEXT QUESTIONS ARE BASED ON THE FOLLOWING INFORMATION:
A sample of 8 households was asked about their monthly income (x)and the number of hours they spend connected to the internet each month (y).The data yield the following statistics:
,
,
,
,
Compute the error sum of squares.
A)116.399
B)458.962
C)712.082
D)688.188
A sample of 8 households was asked about their monthly income (x)and the number of hours they spend connected to the internet each month (y).The data yield the following statistics:
,
,
,
,
Compute the error sum of squares.
A)116.399
B)458.962
C)712.082
D)688.188
Question
THE NEXT QUESTIONS ARE BASED ON THE FOLLOWING INFORMATION:
Suppose we have the following information from a simple regression:
b0= 117.4,b1 = -14.39,s
= 0.18,s
= 0.18,n = 300,
= 4.3,SST = 17,045,and SSE = 12,053.
What is the coefficient of determination?
A)0.2929
B)0.7122
C)0.5408
D)0.4671
Suppose we have the following information from a simple regression:
b0= 117.4,b1 = -14.39,s
= 0.18,s
= 0.18,n = 300,
= 4.3,SST = 17,045,and SSE = 12,053.
What is the coefficient of determination?
A)0.2929
B)0.7122
C)0.5408
D)0.4671
Question
Question
THE NEXT QUESTIONS ARE BASED ON THE FOLLOWING INFORMATION:
A sample of 8 households was asked about their monthly income (x)and the number of hours they spend connected to the internet each month (y).The data yield the following statistics:
,
,
,
,
What is the value of the coefficient of determination?
A)0.637
B)0.575
C)0.601
D)0.664
A sample of 8 households was asked about their monthly income (x)and the number of hours they spend connected to the internet each month (y).The data yield the following statistics:
,
,
,
,
What is the value of the coefficient of determination?
A)0.637
B)0.575
C)0.601
D)0.664
Question
THE NEXT QUESTIONS ARE BASED ON THE FOLLOWING INFORMATION:
A sample of 8 households was asked about their monthly income (x)and the number of hours they spend connected to the internet each month (y).The data yield the following statistics:
,
,
,
,
Calculate the sample covariance between x and y.
A)136.313
B)155.786
C)181.750
D)159.032
A sample of 8 households was asked about their monthly income (x)and the number of hours they spend connected to the internet each month (y).The data yield the following statistics:
,
,
,
,
Calculate the sample covariance between x and y.
A)136.313
B)155.786
C)181.750
D)159.032
Question
THE NEXT QUESTIONS ARE BASED ON THE FOLLOWING INFORMATION:
A sample of 8 households was asked about their monthly income (x)and the number of hours they spend connected to the internet each month (y).The data yield the following statistics:
,
,
,
,
What is the y-intercept of the regression line of hours on income?
A)64.23
B)36.43
C)46.23
D)23.46
A sample of 8 households was asked about their monthly income (x)and the number of hours they spend connected to the internet each month (y).The data yield the following statistics:
,
,
,
,
What is the y-intercept of the regression line of hours on income?
A)64.23
B)36.43
C)46.23
D)23.46
Question
THE NEXT QUESTIONS ARE BASED ON THE FOLLOWING INFORMATION:
Consider a random sample of 25 observations of two variables x and y.The following summary statistics are available:
= 43.2,
= 195.6,
= 1357.2,
= 1253.4,and
= 4843.6.
Determine the intercept of the regression line.
A)2.038
B)41.43
C)3.57
D)54.86
Consider a random sample of 25 observations of two variables x and y.The following summary statistics are available:
= 43.2,
= 195.6,
= 1357.2,
= 1253.4,and
= 4843.6.
Determine the intercept of the regression line.
A)2.038
B)41.43
C)3.57
D)54.86
Question
Question
THE NEXT QUESTIONS ARE BASED ON THE FOLLOWING INFORMATION:
Suppose we have the following information from a simple regression:
b0= 117.4,b1 = -14.39,s
= 0.18,s
= 0.18,n = 300,
= 4.3,SST = 17,045,and SSE = 12,053.
Determine the sample mean of y.
A)103.08
B)179.28
C)55.52
D)74.37
Suppose we have the following information from a simple regression:
b0= 117.4,b1 = -14.39,s
= 0.18,s
= 0.18,n = 300,
= 4.3,SST = 17,045,and SSE = 12,053.
Determine the sample mean of y.
A)103.08
B)179.28
C)55.52
D)74.37
Question
THE NEXT QUESTIONS ARE BASED ON THE FOLLOWING INFORMATION:
A sample of 8 households was asked about their monthly income (x)and the number of hours they spend connected to the internet each month (y).The data yield the following statistics:
,
,
,
,
Determine the regression sum of squares.
A)691.038
B)1033.601
C)461.812
D)437.918
A sample of 8 households was asked about their monthly income (x)and the number of hours they spend connected to the internet each month (y).The data yield the following statistics:
,
,
,
,
Determine the regression sum of squares.
A)691.038
B)1033.601
C)461.812
D)437.918
Question
THE NEXT QUESTIONS ARE BASED ON THE FOLLOWING INFORMATION:
A sample of 8 households was asked about their monthly income (x)and the number of hours they spend connected to the internet each month (y).The data yield the following statistics:
,
,
,
,
Determine the estimate of the variance of the population model error.
A)118.347
B)114.698
C)19.399
D)76.494
A sample of 8 households was asked about their monthly income (x)and the number of hours they spend connected to the internet each month (y).The data yield the following statistics:
,
,
,
,
Determine the estimate of the variance of the population model error.
A)118.347
B)114.698
C)19.399
D)76.494
Question
THE NEXT QUESTIONS ARE BASED ON THE FOLLOWING INFORMATION:
A sample of 8 households was asked about their monthly income (x)and the number of hours they spend connected to the internet each month (y).The data yield the following statistics:
,
,
,
,
Compute the standard error of the slope of the regression line of hours on income.
A)0.256
B)0.234
C)0.211
D)0.269
Question
THE NEXT QUESTIONS ARE BASED ON THE FOLLOWING INFORMATION:
A sample of 8 households was asked about their monthly income (x)and the number of hours they spend connected to the internet each month (y).The data yield the following statistics:
,
,
,
,
Determine the sample correlation coefficient between x and y.
A)0.678
B)0.791
C)0.905
D)0.775
A sample of 8 households was asked about their monthly income (x)and the number of hours they spend connected to the internet each month (y).The data yield the following statistics:
,
,
,
,
Determine the sample correlation coefficient between x and y.
A)0.678
B)0.791
C)0.905
D)0.775
Question
A regression analysis between weight (y in pounds)and height (x in inches)resulted in the following least squares line:  = 120 + 5x.This implies that if the height is increased by 1 inch,the weight is expected to:
A)increase by 1 pound.
B)decrease by 1 pound.
C)decrease by 120 pounds.
D)increase by 5 pounds.
= 120 + 5x.This implies that if the height is increased by 1 inch,the weight is expected to:A)increase by 1 pound.
B)decrease by 1 pound.
C)decrease by 120 pounds.
D)increase by 5 pounds.
Question
THE NEXT QUESTIONS ARE BASED ON THE FOLLOWING INFORMATION:
A sample of 8 households was asked about their monthly income (x)and the number of hours they spend connected to the internet each month (y).The data yield the following statistics:
,
,
,
,
What is the standard deviation of the number of hours households spend connected to the internet each month?
A)12.817
B)14.667
C)15.679
D)11.990
Question
THE NEXT QUESTIONS ARE BASED ON THE FOLLOWING INFORMATION:
Suppose we have the following information from a simple regression:
b0= 117.4,b1 = -14.39,s
= 0.18,s
= 0.18,n = 300,
= 4.3,SST = 17,045,and SSE = 12,053.
The correlation coefficient is:
A)-0.6834
B)0.5412
C)0.6834
D)-0.5412
Suppose we have the following information from a simple regression:
b0= 117.4,b1 = -14.39,s
= 0.18,s
= 0.18,n = 300,
= 4.3,SST = 17,045,and SSE = 12,053.
The correlation coefficient is:
A)-0.6834
B)0.5412
C)0.6834
D)-0.5412
Question
THE NEXT QUESTIONS ARE BASED ON THE FOLLOWING INFORMATION:
A sample of 8 households was asked about their monthly income (x)and the number of hours they spend connected to the internet each month (y).The data yield the following statistics:
,
,
,
,
An indication of no linear relationship between two variables would be a:
A)coefficient of determination equal to 1
B)coefficient of determination equal to -1
C)coefficient of correlation equal to 0
D)coefficient of correlation equal to -1
Question
THE NEXT QUESTIONS ARE BASED ON THE FOLLOWING INFORMATION:
A professor of statistics is interested in studying the relationship between the number of hours graduate students spent studying for his comprehensive final exam and the exam score.The results of the regression analysis of hours studied on exam scores are presented below.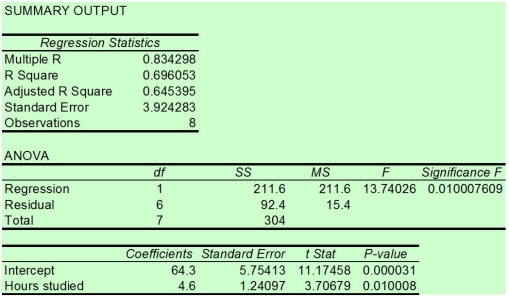
Determine the slope of the sample regression line.
A)3.71
B)1.24
C)4.60
D)3.92
Question
THE NEXT QUESTIONS ARE BASED ON THE FOLLOWING INFORMATION:
A sales manager is interested in determining the relationship between the amount spent on advertising and total sales.The manager collects data for the past 24 months and runs a regression of sales on advertising expenditures.The results are presented below but,unfortunately,some values identified by asterisks are missing.
SUMMARY OUTPUT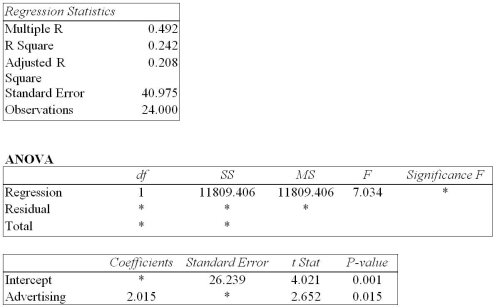
Determine the value of residual sum of squares.
A)10,945.2
B)11,759.9
C)10,130.5
D)36,935.8
Question
THE NEXT QUESTIONS ARE BASED ON THE FOLLOWING INFORMATION:
A sales manager is interested in determining the relationship between the amount spent on advertising and total sales.The manager collects data for the past 24 months and runs a regression of sales on advertising expenditures.The results are presented below but,unfortunately,some values identified by asterisks are missing.
SUMMARY OUTPUT
What is the value of total sum of squares?
A)48,745.2
B)46,538.7
C)50,292.4
D)52,644.8
Question
THE NEXT QUESTIONS ARE BASED ON THE FOLLOWING INFORMATION:
A sales manager is interested in determining the relationship between the amount spent on advertising and total sales.The manager collects data for the past 24 months and runs a regression of sales on advertising expenditures.The results are presented below but,unfortunately,some values identified by asterisks are missing.
SUMMARY OUTPUT
Calculate the standard error of estimate.
A)0)66
B)0)76
C)0)85
D)0)61
Question
THE NEXT QUESTIONS ARE BASED ON THE FOLLOWING INFORMATION:
A professor of statistics is interested in studying the relationship between the number of hours graduate students spent studying for his comprehensive final exam and the exam score.The results of the regression analysis of hours studied on exam scores are presented below.
For the given data,which of the following is the result of the hypothesis test?
A)Since the test statistic equals 4.439 and the critical value equals 1.645,we reject the null hypothesis and assume there is a positive correlation between the variables.
B)Since the test statistic equals 4.113 and the critical value equals -1.645,we fail to reject the null hypothesis and assume there is no correlation between the variables.
C)Since the test statistic equals 3.305 and the critical value equals 2.447,we reject the null hypothesis and assume there is a correlation between the variables.
D)Since the test statistic equals 3.707 and the critical value equals 1.943,we reject the null hypothesis and assume there is a positive correlation between the variables.
Question
THE NEXT QUESTIONS ARE BASED ON THE FOLLOWING INFORMATION:
A professor of statistics is interested in studying the relationship between the number of hours graduate students spent studying for his comprehensive final exam and the exam score.The results of the regression analysis of hours studied on exam scores are presented below.
Which of the following is the value of the sample correlation?
A)0.696
B)0.834
C)0.645
D)0.803
Question
THE NEXT QUESTIONS ARE BASED ON THE FOLLOWING INFORMATION:
A sales manager is interested in determining the relationship between the amount spent on advertising and total sales.The manager collects data for the past 24 months and runs a regression of sales on advertising expenditures.The results are presented below but,unfortunately,some values identified by asterisks are missing.
SUMMARY OUTPUT
If the regression line = 3 + 2x has been fitted to the data points (4,8),(2,5),and (1,2),the residual sum of squares will be:
A)10
B)15
C)13
D)22
A sales manager is interested in determining the relationship between the amount spent on advertising and total sales.The manager collects data for the past 24 months and runs a regression of sales on advertising expenditures.The results are presented below but,unfortunately,some values identified by asterisks are missing.
SUMMARY OUTPUT
If the regression line
= 3 + 2x has been fitted to the data points (4,8),(2,5),and (1,2),the residual sum of squares will be:A)10
B)15
C)13
D)22
Question
THE NEXT QUESTIONS ARE BASED ON THE FOLLOWING INFORMATION:
A professor of statistics is interested in studying the relationship between the number of hours graduate students spent studying for his comprehensive final exam and the exam score.The results of the regression analysis of hours studied on exam scores are presented below.
Determine the intercept of the sample regression line.
A)11.17
B)64.30
C)92.40
D)13.74
Question
THE NEXT QUESTIONS ARE BASED ON THE FOLLOWING INFORMATION:
A professor of statistics is interested in studying the relationship between the number of hours graduate students spent studying for his comprehensive final exam and the exam score.The results of the regression analysis of hours studied on exam scores are presented below.
What is the value of the test statistic for testing H0 : ρ = 0 vs.Ha : ρ >0?
A)4.439
B)4.113
C)3.707
D)3.305
Question
THE NEXT QUESTIONS ARE BASED ON THE FOLLOWING INFORMATION:
A sales manager is interested in determining the relationship between the amount spent on advertising and total sales.The manager collects data for the past 24 months and runs a regression of sales on advertising expenditures.The results are presented below but,unfortunately,some values identified by asterisks are missing.
SUMMARY OUTPUT
The value of mean square error is:
A)1678.9
B)1,554.25
C)1,493.63
D)1,407.35
Question
THE NEXT QUESTIONS ARE BASED ON THE FOLLOWING INFORMATION:
A sales manager is interested in determining the relationship between the amount spent on advertising and total sales.The manager collects data for the past 24 months and runs a regression of sales on advertising expenditures.The results are presented below but,unfortunately,some values identified by asterisks are missing.
SUMMARY OUTPUT
The total degrees of freedom is:
A)21
B)22
C)23
D)24
Question
THE NEXT QUESTIONS ARE BASED ON THE FOLLOWING INFORMATION:
A sales manager is interested in determining the relationship between the amount spent on advertising and total sales.The manager collects data for the past 24 months and runs a regression of sales on advertising expenditures.The results are presented below but,unfortunately,some values identified by asterisks are missing.
SUMMARY OUTPUT
Correlation analysis is used to determine the:
A)strength of the relationship between x and y.
B)least squares estimates of the regression parameters.
C)predicted value of y for a given value of x.
D)forecast value of a particular dependent variable.
Question
THE NEXT QUESTIONS ARE BASED ON THE FOLLOWING INFORMATION:
A professor of statistics is interested in studying the relationship between the number of hours graduate students spent studying for his comprehensive final exam and the exam score.The results of the regression analysis of hours studied on exam scores are presented below.
For the given data,what is/are the critical value(s)for testing the hypotheses at 0.05 level of significance?
A)+1.943
B)± 2.447
C)+1.645
D)-1.645
Question
THE NEXT QUESTIONS ARE BASED ON THE FOLLOWING INFORMATION:
A sales manager is interested in determining the relationship between the amount spent on advertising and total sales.The manager collects data for the past 24 months and runs a regression of sales on advertising expenditures.The results are presented below but,unfortunately,some values identified by asterisks are missing.
SUMMARY OUTPUT
In a regression problem,a coefficient of determination 0.90 indicates that:
A)90% of the y values are positive.
B)90% of the variation in y can be explained by the regression line.
C)90% of the x values are equal.
D)90% of the variation in x can be explained by the regression line.
Question
THE NEXT QUESTIONS ARE BASED ON THE FOLLOWING INFORMATION:
A sales manager is interested in determining the relationship between the amount spent on advertising and total sales.The manager collects data for the past 24 months and runs a regression of sales on advertising expenditures.The results are presented below but,unfortunately,some values identified by asterisks are missing.
SUMMARY OUTPUT
A regression analysis between sales (in $1000)and advertising (in $100)resulted in the following least squares line: = 75 + 5x.This implies that if advertising is $800,then the predicted amount of sales (in dollars)is:
A)$4075
B)$115,000
C)$164,000
D)$179,000
A sales manager is interested in determining the relationship between the amount spent on advertising and total sales.The manager collects data for the past 24 months and runs a regression of sales on advertising expenditures.The results are presented below but,unfortunately,some values identified by asterisks are missing.
SUMMARY OUTPUT
A regression analysis between sales (in $1000)and advertising (in $100)resulted in the following least squares line:
= 75 + 5x.This implies that if advertising is $800,then the predicted amount of sales (in dollars)is:A)$4075
B)$115,000
C)$164,000
D)$179,000
Question
THE NEXT QUESTIONS ARE BASED ON THE FOLLOWING INFORMATION:
A sample of 8 households was asked about their monthly income (x)and the number of hours they spend connected to the internet each month (y).The data yield the following statistics:
,
,
,
,
Which of the following is the value of the test statistic for testing H0 : β1 = 0 vs.H1 : β1 ≠ 0?
A)2.36
B)3.01
C)2.48
D)2.71
Question
THE NEXT QUESTIONS ARE BASED ON THE FOLLOWING INFORMATION:
A sales manager is interested in determining the relationship between the amount spent on advertising and total sales.The manager collects data for the past 24 months and runs a regression of sales on advertising expenditures.The results are presented below but,unfortunately,some values identified by asterisks are missing.
SUMMARY OUTPUT
What are the degrees of freedom for residuals?
A)21
B)22
C)23
D)24
Question
THE NEXT QUESTIONS ARE BASED ON THE FOLLOWING INFORMATION:
A professor of statistics is interested in studying the relationship between the number of hours graduate students spent studying for his comprehensive final exam and the exam score.The results of the regression analysis of hours studied on exam scores are presented below.
The value of the coefficient of determination is:
A)0.696
B)0.834
C)211.6
D)3.924
Question
THE NEXT QUESTIONS ARE BASED ON THE FOLLOWING INFORMATION:
A sales manager is interested in determining the relationship between the amount spent on advertising and total sales.The manager collects data for the past 24 months and runs a regression of sales on advertising expenditures.The results are presented below but,unfortunately,some values identified by asterisks are missing.
SUMMARY OUTPUT
Determine the regression coefficient of the y-intercept.
A)112.4
B)102.3
C)108.6
D)105.5

Unlock Deck
Sign up to unlock the cards in this deck!
Unlock Deck
Unlock Deck
1/217
Play
Full screen (f)
Deck 11: Simple Regression
1
Determine the slope of the least squares regression line.
A)10.48
B)18.05
C)3.57
D)0.46
A)10.48
B)18.05
C)3.57
D)0.46
0.46
2
If the null H0 : p = 0 hypothesis is true and the random variables have a joint normal distribution,then the random variable - which is used to test the hypothesis that there is no linear association in the population between a pair of random variables-follows the:
A)degenerate distribution.
B)Student's t distribution.
C)chi-square distribution.
D)distribution.
- which is used to test the hypothesis that there is no linear association in the population between a pair of random variables-follows the:A)degenerate distribution.
B)Student's t distribution.
C)chi-square distribution.
D)distribution.
Student's t distribution.
3
Which of the following will tend to make it more likely to reject H0 : β1 = 0?
A)increasing SSE
B)decreasing the absolute value of b1
C)increasing the variance of X
D)decreasing sample size
A)increasing SSE
B)decreasing the absolute value of b1
C)increasing the variance of X
D)decreasing sample size
increasing the variance of X
4
THE NEXT QUESTIONS ARE BASED ON THE FOLLOWING:
The below sample data set shows the relationship between two variables.
What is the value of cov(x,y)?
A)4.925
B)8.000
C)9.667
D)6.679
The below sample data set shows the relationship between two variables.
What is the value of cov(x,y)?
A)4.925
B)8.000
C)9.667
D)6.679
Unlock Deck
Unlock for access to all 217 flashcards in this deck.
Unlock Deck
k this deck
5
Determine the least squares regression line.
A)
= 0.46 - 3.57x
B)
= 0.46 + 3.57x
C)
= 3.57 + 0.46x
D)
= 3.57 - 0.46x
A)
= 0.46 - 3.57x
B)
= 0.46 + 3.57x
C)
= 3.57 + 0.46x
D)
= 3.57 - 0.46x
Unlock Deck
Unlock for access to all 217 flashcards in this deck.
Unlock Deck
k this deck
6
THE NEXT QUESTIONS ARE BASED ON THE FOLLOWING INFORMATION:
The manager of a used-car dealership is very interested in the resale price of used cars.The manager feels that the age of the car is important in determining the resale value.He collects data on the age and resale value of 15 cars and runs a regression analysis with the value of the car (in thousands of dollars)as the dependent variable and the age of the car (in years)as the independent variable.Unfortunately,the printout had lost some of the results,identified by"A" through"F".The partial results left are displayed below.
Which of the following is the value of "A"?
A)0.195
B)0.805
C)0.442
D)0.67
Unlock Deck
Unlock for access to all 217 flashcards in this deck.
Unlock Deck
k this deck
7
A regression analysis between sales (in $1000)and advertising (in $)resulted in the following least squares line: = 80,000 + 4x.This implies that:
A)an increase of $1 in advertising is expected to result in an increase of $4 in sales.
B)an increase of $4 in advertising is expected to result in an increase of $4,000 in sales.
C)an increase of $1 in advertising is expected to result in an increase of $80,000 in sales.
D)an increase of $1 in advertising is expected to result in an increase of $4,000 in sales.
= 80,000 + 4x.This implies that:A)an increase of $1 in advertising is expected to result in an increase of $4 in sales.
B)an increase of $4 in advertising is expected to result in an increase of $4,000 in sales.
C)an increase of $1 in advertising is expected to result in an increase of $80,000 in sales.
D)an increase of $1 in advertising is expected to result in an increase of $4,000 in sales.
Unlock Deck
Unlock for access to all 217 flashcards in this deck.
Unlock Deck
k this deck
8
You want to explore the relationship between the grades students receive on their first two exams.For a sample of 15 students,you find a correlation coefficient of 0.47.What is the value of the test statistic for testing H0 : p = 0 vs.H1 : p > 0?
A)2.80
B)1.06
C)1.39
D)1.92
A)2.80
B)1.06
C)1.39
D)1.92
Unlock Deck
Unlock for access to all 217 flashcards in this deck.
Unlock Deck
k this deck
9
The value of the F-test statistic is:
A)1.50
B)18.05
C)12.05
D)3.47
A)1.50
B)18.05
C)12.05
D)3.47
Unlock Deck
Unlock for access to all 217 flashcards in this deck.
Unlock Deck
k this deck
10
The value of SSR is:
A)18.05
B)10.48
C)28.53
D)0)010
A)18.05
B)10.48
C)28.53
D)0)010
Unlock Deck
Unlock for access to all 217 flashcards in this deck.
Unlock Deck
k this deck
11
Which of the following is the value of SST?
A)18.05
B)10.48
C)28.53
D)0)010
A)18.05
B)10.48
C)28.53
D)0)010
Unlock Deck
Unlock for access to all 217 flashcards in this deck.
Unlock Deck
k this deck
12
Calculate the value of SSE.
A)18.05
B)10.48
C)28.53
D)0)010
A)18.05
B)10.48
C)28.53
D)0)010
Unlock Deck
Unlock for access to all 217 flashcards in this deck.
Unlock Deck
k this deck
13
The y-intercept of the least squares regression line is:
A)10.48
B)18.05
C)3.57
D)0.46
A)10.48
B)18.05
C)3.57
D)0.46
Unlock Deck
Unlock for access to all 217 flashcards in this deck.
Unlock Deck
k this deck
14
Determine the value of the Student's t statistic.
A)1.34
B)0.80
C)2.67
D)3.47
A)1.34
B)0.80
C)2.67
D)3.47
Unlock Deck
Unlock for access to all 217 flashcards in this deck.
Unlock Deck
k this deck
15
Compute the value of the coefficient of determination.
A)3.47
B)2.67
C)0.80
D)0.63
A)3.47
B)2.67
C)0.80
D)0.63
Unlock Deck
Unlock for access to all 217 flashcards in this deck.
Unlock Deck
k this deck
16
The value of the correlation coefficient is:
A)0.633
B)0.795
C)1.266
D)-0.633
A)0.633
B)0.795
C)1.266
D)-0.633
Unlock Deck
Unlock for access to all 217 flashcards in this deck.
Unlock Deck
k this deck
17
Calculate the standard error of the estimate.
A)1.22
B)3.47
C)2.67
D)63.3
A)1.22
B)3.47
C)2.67
D)63.3
Unlock Deck
Unlock for access to all 217 flashcards in this deck.
Unlock Deck
k this deck
18
The value of the standard error of the slope coefficient is:
A)1.34
B)0.45
C)0.13
D)2.67
A)1.34
B)0.45
C)0.13
D)2.67
Unlock Deck
Unlock for access to all 217 flashcards in this deck.
Unlock Deck
k this deck
19
Test H0 : β = 1 vs.H1 : β < 1 if the following regression information are given: b1 = 1.39,s = 0.18,and n = 30.
A)reject H0 for α = 0.01
B)reject H0 for α = 0.10
C)reject H0 for α = 0.005
D)unable to reject H0 for α = 0.025
= 0.18,and n = 30.A)reject H0 for α = 0.01
B)reject H0 for α = 0.10
C)reject H0 for α = 0.005
D)unable to reject H0 for α = 0.025
Unlock Deck
Unlock for access to all 217 flashcards in this deck.
Unlock Deck
k this deck
20
Compute the value of the model error variance.
A)18.05
B)1.50
C)10.48
D)0.63
A)18.05
B)1.50
C)10.48
D)0.63
Unlock Deck
Unlock for access to all 217 flashcards in this deck.
Unlock Deck
k this deck
21
THE NEXT QUESTIONS ARE BASED ON THE FOLLOWING INFORMATION:
The manager of a used-car dealership is very interested in the resale price of used cars.The manager feels that the age of the car is important in determining the resale value.He collects data on the age and resale value of 15 cars and runs a regression analysis with the value of the car (in thousands of dollars)as the dependent variable and the age of the car (in years)as the independent variable.Unfortunately,the printout had lost some of the results,identified by"A" through"F".The partial results left are displayed below.
Compute the value of "D."
A)9.35
B)3.06
C)9.82
D)22.96
Unlock Deck
Unlock for access to all 217 flashcards in this deck.
Unlock Deck
k this deck
22
THE NEXT QUESTIONS ARE BASED ON THE FOLLOWING INFORMATION:
You want to explore the relationship between the grades students receive on their first quiz (x)and their first exam (y).The first quiz and test scores for a sample of eight students reveal the following summary statistics:
The sample correlation coefficient is:
A)0.691
B)0.806
C)0.749
D)0.209
You want to explore the relationship between the grades students receive on their first quiz (x)and their first exam (y).The first quiz and test scores for a sample of eight students reveal the following summary statistics:
The sample correlation coefficient is:
A)0.691
B)0.806
C)0.749
D)0.209
Unlock Deck
Unlock for access to all 217 flashcards in this deck.
Unlock Deck
k this deck
23
THE NEXT QUESTIONS ARE BASED ON THE FOLLOWING INFORMATION:
The manager of a used-car dealership is very interested in the resale price of used cars.The manager feels that the age of the car is important in determining the resale value.He collects data on the age and resale value of 15 cars and runs a regression analysis with the value of the car (in thousands of dollars)as the dependent variable and the age of the car (in years)as the independent variable.Unfortunately,the printout had lost some of the results,identified by"A" through"F".The partial results left are displayed below.
In order to estimate with 95% confidence the expected value of y in a simple linear regression problem,a random sample of 10 observations is taken.Which of the following t-table values listed below would be used?
A)2.228
B)1.860
C)1.812
D)2.306
Unlock Deck
Unlock for access to all 217 flashcards in this deck.
Unlock Deck
k this deck
24
THE NEXT QUESTIONS ARE BASED ON THE FOLLOWING INFORMATION:
The manager of a used-car dealership is very interested in the resale price of used cars.The manager feels that the age of the car is important in determining the resale value.He collects data on the age and resale value of 15 cars and runs a regression analysis with the value of the car (in thousands of dollars)as the dependent variable and the age of the car (in years)as the independent variable.Unfortunately,the printout had lost some of the results,identified by"A" through"F".The partial results left are displayed below.
What is the value of "C"?
A)172.25
B)162.42
C)140.03
D)182.99
Unlock Deck
Unlock for access to all 217 flashcards in this deck.
Unlock Deck
k this deck
25
In a simple regression problem,the following data is shown below: Standard error of estimate se = 18,n = 10.
What is the error sum of squares?
A)2916
B)2592
C)1800
D)3240
What is the error sum of squares?
A)2916
B)2592
C)1800
D)3240
Unlock Deck
Unlock for access to all 217 flashcards in this deck.
Unlock Deck
k this deck
26
THE NEXT QUESTIONS ARE BASED ON THE FOLLOWING INFORMATION:
The manager of a used-car dealership is very interested in the resale price of used cars.The manager feels that the age of the car is important in determining the resale value.He collects data on the age and resale value of 15 cars and runs a regression analysis with the value of the car (in thousands of dollars)as the dependent variable and the age of the car (in years)as the independent variable.Unfortunately,the printout had lost some of the results,identified by"A" through"F".The partial results left are displayed below.
What is the approximate value of "F"?
A)0.025
B)0.05
C)0.10
D)0.01
Unlock Deck
Unlock for access to all 217 flashcards in this deck.
Unlock Deck
k this deck
27
THE NEXT QUESTIONS ARE BASED ON THE FOLLOWING INFORMATION:
You want to explore the relationship between the scores students receive on their first quiz and their first exam.You believe that there is a positive correlation between the two scores.
What is the appropriate decision rule?
A)reject H0 if r(n - 2)/ (1 - r2)> tn-2,α
B)reject H0 if r
/
> tn-2,α
C)reject H0 if r(n - 2)/
> tn-2,α
D)reject H0 if r(n - 2)/
> tn-2,α/2
Unlock Deck
Unlock for access to all 217 flashcards in this deck.
Unlock Deck
k this deck
28
Develop a 90% confidence interval for the population slope if the following regression information are given: b1= 23.5,p-value = 0.01,and n = 25.
A)23.5 ± 17.35
B)23.5 ± 15.35
C)23.5 ± 16.35
D)23.5 ± 14.35
A)23.5 ± 17.35
B)23.5 ± 15.35
C)23.5 ± 16.35
D)23.5 ± 14.35
Unlock Deck
Unlock for access to all 217 flashcards in this deck.
Unlock Deck
k this deck
29
THE NEXT QUESTIONS ARE BASED ON THE FOLLOWING INFORMATION:
You want to explore the relationship between the grades students receive on their first quiz (x)and their first exam (y).The first quiz and test scores for a sample of eight students reveal the following summary statistics:
What is the covariance between x and y?
A)4.83
B)7.11
C)50.50
D)58.92
You want to explore the relationship between the grades students receive on their first quiz (x)and their first exam (y).The first quiz and test scores for a sample of eight students reveal the following summary statistics:
What is the covariance between x and y?
A)4.83
B)7.11
C)50.50
D)58.92
Unlock Deck
Unlock for access to all 217 flashcards in this deck.
Unlock Deck
k this deck
30
What would be the dollar value of an accident involving a 25-year-old driver?
A)$11,836.56
B)$10,795.47
C)$13,372.58
D)$12,474.90
A)$11,836.56
B)$10,795.47
C)$13,372.58
D)$12,474.90
Unlock Deck
Unlock for access to all 217 flashcards in this deck.
Unlock Deck
k this deck
31
Which of the following statements is the best explanation of the R2?
A)3)5% of the accident damage can be explained by the age of the driver.
B)3)5% of the variation in accident damage can be explained by variation in the age of the driver.
C)3)5% of the coefficients,t-stat,and p-value can be explained by the age of the driver.
D)3)5% of the total error can be explained by the SSE.
Unlock Deck
Unlock for access to all 217 flashcards in this deck.
Unlock Deck
k this deck
32
How would you best explain the y-intercept in this situation?
A)For each additional 1-year increase in the age of the driver,we would expect damage to increase by $10,726.
B)For each additional 1-year increase in the age of the driver,we would expect damage to increase by $70.
C)It makes no sense to explain the intercept in this situation,since we cannot have a driver with an age of zero.
D)The average amount of damage was $10,726.
Unlock Deck
Unlock for access to all 217 flashcards in this deck.
Unlock Deck
k this deck
33
THE NEXT QUESTIONS ARE BASED ON THE FOLLOWING INFORMATION:
You want to explore the relationship between the grades students receive on their first quiz (x)and their first exam (y).The first quiz and test scores for a sample of eight students reveal the following summary statistics:
Determine the value of the test statistic for testing H0 : p = 0
A)2.53
B)2.34
C)2.20
D)2.77
Unlock Deck
Unlock for access to all 217 flashcards in this deck.
Unlock Deck
k this deck
34
The vertical spread of the data points about the regression line is measured by the:
A)regression coefficient.
B)y-intercept.
C)standard error of estimate.
D)F-ratio.
A)regression coefficient.
B)y-intercept.
C)standard error of estimate.
D)F-ratio.
Unlock Deck
Unlock for access to all 217 flashcards in this deck.
Unlock Deck
k this deck
35
THE NEXT QUESTIONS ARE BASED ON THE FOLLOWING INFORMATION:
For a random sample of 263 professionals,the correlation between their age and their income was found to be 0.17.You are interested in testing the null hypothesis that there is no linear relationship between these two variables against the alternative that there is a positive relationship.
What is the most accurate statement that can be made about the p-value for this test?
A)p-value < 0.005
B)p-value < 0.01
C)p-value < 0.025
D)p-value < 0.05
Unlock Deck
Unlock for access to all 217 flashcards in this deck.
Unlock Deck
k this deck
36
THE NEXT QUESTIONS ARE BASED ON THE FOLLOWING INFORMATION:
For a random sample of 263 professionals,the correlation between their age and their income was found to be 0.17.You are interested in testing the null hypothesis that there is no linear relationship between these two variables against the alternative that there is a positive relationship.
What is the value of the test statistic?
A)3.669
B)2.756
C)2.787
D)6.785
Unlock Deck
Unlock for access to all 217 flashcards in this deck.
Unlock Deck
k this deck
37
THE NEXT QUESTIONS ARE BASED ON THE FOLLOWING INFORMATION:
You want to explore the relationship between the scores students receive on their first quiz and their first exam.You believe that there is a positive correlation between the two scores.
What are the most appropriate null and alternative hypotheses regarding the population correlation?
A)H0 : p = 0 and H1 : p ≠ 0
B)H0 : p = 0 and H1 : p < 0
C)H0 : p = 0 and H1 : p > 0
D)H0 : p = 0 and H1 : p < 1
Unlock Deck
Unlock for access to all 217 flashcards in this deck.
Unlock Deck
k this deck
38
THE NEXT QUESTIONS ARE BASED ON THE FOLLOWING INFORMATION:
The manager of a used-car dealership is very interested in the resale price of used cars.The manager feels that the age of the car is important in determining the resale value.He collects data on the age and resale value of 15 cars and runs a regression analysis with the value of the car (in thousands of dollars)as the dependent variable and the age of the car (in years)as the independent variable.Unfortunately,the printout had lost some of the results,identified by"A" through"F".The partial results left are displayed below.
What is the value of "B"?
A)2.58
B)6.67
C)3.75
D)3.95
Unlock Deck
Unlock for access to all 217 flashcards in this deck.
Unlock Deck
k this deck
39
THE NEXT QUESTIONS ARE BASED ON THE FOLLOWING INFORMATION:
The manager of a used-car dealership is very interested in the resale price of used cars.The manager feels that the age of the car is important in determining the resale value.He collects data on the age and resale value of 15 cars and runs a regression analysis with the value of the car (in thousands of dollars)as the dependent variable and the age of the car (in years)as the independent variable.Unfortunately,the printout had lost some of the results,identified by"A" through"F".The partial results left are displayed below.
Calculate the value of "E."
A)1.136
B)-1.136
C)0.278
D)-0.278
Unlock Deck
Unlock for access to all 217 flashcards in this deck.
Unlock Deck
k this deck
40
THE NEXT QUESTIONS ARE BASED ON THE FOLLOWING INFORMATION:
An insurance company analyst is interested in analyzing the dollar value of damage in automobile accidents.She collects data from 115 accidents,and records the amount of damage as well as the age of the driver.The results of her regression analysis are listed below.
SUMMARY OUTPUT
The regression equation is:
A)y = 10725.802 + 69.964x
B)y = 114 + 113x
C)y = 1535.215 + 34.625x
D)y = 113 + 114x
Unlock Deck
Unlock for access to all 217 flashcards in this deck.
Unlock Deck
k this deck
41
THE NEXT QUESTIONS ARE BASED ON THE FOLLOWING INFORMATION:
A sample of 8 households was asked about their monthly income (x)and the number of hours they spend connected to the internet each month (y).The data yield the following statistics:
,
,
,
,
The slope of the regression line of hours on income is:
A)0.6337
B)0.9482
C)0.5541
D)0.6475
A sample of 8 households was asked about their monthly income (x)and the number of hours they spend connected to the internet each month (y).The data yield the following statistics:
,
,
,
,
The slope of the regression line of hours on income is:
A)0.6337
B)0.9482
C)0.5541
D)0.6475
Unlock Deck
Unlock for access to all 217 flashcards in this deck.
Unlock Deck
k this deck
42
THE NEXT QUESTIONS ARE BASED ON THE FOLLOWING INFORMATION:
A sample of 8 households was asked about their monthly income (x)and the number of hours they spend connected to the internet each month (y).The data yield the following statistics:
,
,
,
,
The standard deviation of the households' monthly income is:
A)12.817
B)14.667
C)15.679
D)11.990
A sample of 8 households was asked about their monthly income (x)and the number of hours they spend connected to the internet each month (y).The data yield the following statistics:
,
,
,
,
The standard deviation of the households' monthly income is:
A)12.817
B)14.667
C)15.679
D)11.990
Unlock Deck
Unlock for access to all 217 flashcards in this deck.
Unlock Deck
k this deck
43
THE NEXT QUESTIONS ARE BASED ON THE FOLLOWING INFORMATION:
Consider a random sample of 25 observations of two variables x and y.The following summary statistics are available:
= 43.2,
= 195.6,
= 1357.2,
= 1253.4,and
= 4843.6.
Which of the following is the slope of the sample regression line?
A)0.43
B)54.85
C)0.978
D)3.57
Consider a random sample of 25 observations of two variables x and y.The following summary statistics are available:
= 43.2,
= 195.6,
= 1357.2,
= 1253.4,and
= 4843.6.
Which of the following is the slope of the sample regression line?
A)0.43
B)54.85
C)0.978
D)3.57
Unlock Deck
Unlock for access to all 217 flashcards in this deck.
Unlock Deck
k this deck
44
THE NEXT QUESTIONS ARE BASED ON THE FOLLOWING INFORMATION:
Suppose we have the following information from a simple regression:
b0= 117.4,b1 = -14.39,s
= 0.18,s
= 0.18,n = 300,
= 4.3,SST = 17,045,and SSE = 12,053.
Which of the following would most likely represent a 95% confidence interval for the estimate of y,given x = ?
A)55.52 ± 0.72
B)55.52 ± 12.42
C)55.52 ± 40.4
D)55.52 ± 18.63
Suppose we have the following information from a simple regression:
b0= 117.4,b1 = -14.39,s
= 0.18,s
= 0.18,n = 300,
= 4.3,SST = 17,045,and SSE = 12,053.
Which of the following would most likely represent a 95% confidence interval for the estimate of y,given x =
?A)55.52 ± 0.72
B)55.52 ± 12.42
C)55.52 ± 40.4
D)55.52 ± 18.63
Unlock Deck
Unlock for access to all 217 flashcards in this deck.
Unlock Deck
k this deck
45
THE NEXT QUESTIONS ARE BASED ON THE FOLLOWING INFORMATION:
A sample of 8 households was asked about their monthly income (x)and the number of hours they spend connected to the internet each month (y).The data yield the following statistics:
,
,
,
,
Compute the error sum of squares.
A)116.399
B)458.962
C)712.082
D)688.188
A sample of 8 households was asked about their monthly income (x)and the number of hours they spend connected to the internet each month (y).The data yield the following statistics:
,
,
,
,
Compute the error sum of squares.
A)116.399
B)458.962
C)712.082
D)688.188
Unlock Deck
Unlock for access to all 217 flashcards in this deck.
Unlock Deck
k this deck
46
THE NEXT QUESTIONS ARE BASED ON THE FOLLOWING INFORMATION:
Suppose we have the following information from a simple regression:
b0= 117.4,b1 = -14.39,s
= 0.18,s
= 0.18,n = 300,
= 4.3,SST = 17,045,and SSE = 12,053.
What is the coefficient of determination?
A)0.2929
B)0.7122
C)0.5408
D)0.4671
Suppose we have the following information from a simple regression:
b0= 117.4,b1 = -14.39,s
= 0.18,s
= 0.18,n = 300,
= 4.3,SST = 17,045,and SSE = 12,053.
What is the coefficient of determination?
A)0.2929
B)0.7122
C)0.5408
D)0.4671
Unlock Deck
Unlock for access to all 217 flashcards in this deck.
Unlock Deck
k this deck
47
The residual is defined as the difference between the actual value of:
A)y and the estimated value of y.
B)x and the estimated value of x.
C)y and the estimated value of x.
D)x and the estimated value of y.
A)y and the estimated value of y.
B)x and the estimated value of x.
C)y and the estimated value of x.
D)x and the estimated value of y.
Unlock Deck
Unlock for access to all 217 flashcards in this deck.
Unlock Deck
k this deck
48
THE NEXT QUESTIONS ARE BASED ON THE FOLLOWING INFORMATION:
A sample of 8 households was asked about their monthly income (x)and the number of hours they spend connected to the internet each month (y).The data yield the following statistics:
,
,
,
,
What is the value of the coefficient of determination?
A)0.637
B)0.575
C)0.601
D)0.664
A sample of 8 households was asked about their monthly income (x)and the number of hours they spend connected to the internet each month (y).The data yield the following statistics:
,
,
,
,
What is the value of the coefficient of determination?
A)0.637
B)0.575
C)0.601
D)0.664
Unlock Deck
Unlock for access to all 217 flashcards in this deck.
Unlock Deck
k this deck
49
THE NEXT QUESTIONS ARE BASED ON THE FOLLOWING INFORMATION:
A sample of 8 households was asked about their monthly income (x)and the number of hours they spend connected to the internet each month (y).The data yield the following statistics:
,
,
,
,
Calculate the sample covariance between x and y.
A)136.313
B)155.786
C)181.750
D)159.032
A sample of 8 households was asked about their monthly income (x)and the number of hours they spend connected to the internet each month (y).The data yield the following statistics:
,
,
,
,
Calculate the sample covariance between x and y.
A)136.313
B)155.786
C)181.750
D)159.032
Unlock Deck
Unlock for access to all 217 flashcards in this deck.
Unlock Deck
k this deck
50
THE NEXT QUESTIONS ARE BASED ON THE FOLLOWING INFORMATION:
A sample of 8 households was asked about their monthly income (x)and the number of hours they spend connected to the internet each month (y).The data yield the following statistics:
,
,
,
,
What is the y-intercept of the regression line of hours on income?
A)64.23
B)36.43
C)46.23
D)23.46
A sample of 8 households was asked about their monthly income (x)and the number of hours they spend connected to the internet each month (y).The data yield the following statistics:
,
,
,
,
What is the y-intercept of the regression line of hours on income?
A)64.23
B)36.43
C)46.23
D)23.46
Unlock Deck
Unlock for access to all 217 flashcards in this deck.
Unlock Deck
k this deck
51
THE NEXT QUESTIONS ARE BASED ON THE FOLLOWING INFORMATION:
Consider a random sample of 25 observations of two variables x and y.The following summary statistics are available:
= 43.2,
= 195.6,
= 1357.2,
= 1253.4,and
= 4843.6.
Determine the intercept of the regression line.
A)2.038
B)41.43
C)3.57
D)54.86
Consider a random sample of 25 observations of two variables x and y.The following summary statistics are available:
= 43.2,
= 195.6,
= 1357.2,
= 1253.4,and
= 4843.6.
Determine the intercept of the regression line.
A)2.038
B)41.43
C)3.57
D)54.86
Unlock Deck
Unlock for access to all 217 flashcards in this deck.
Unlock Deck
k this deck
52
Which of the following will not tend to increase the standard error of the slope?
A)increase the sample size
B)decrease the variation in x
C)decrease the SSE
D)decrease in the standard error of the estimate
A)increase the sample size
B)decrease the variation in x
C)decrease the SSE
D)decrease in the standard error of the estimate
Unlock Deck
Unlock for access to all 217 flashcards in this deck.
Unlock Deck
k this deck
53
THE NEXT QUESTIONS ARE BASED ON THE FOLLOWING INFORMATION:
Suppose we have the following information from a simple regression:
b0= 117.4,b1 = -14.39,s
= 0.18,s
= 0.18,n = 300,
= 4.3,SST = 17,045,and SSE = 12,053.
Determine the sample mean of y.
A)103.08
B)179.28
C)55.52
D)74.37
Suppose we have the following information from a simple regression:
b0= 117.4,b1 = -14.39,s
= 0.18,s
= 0.18,n = 300,
= 4.3,SST = 17,045,and SSE = 12,053.
Determine the sample mean of y.
A)103.08
B)179.28
C)55.52
D)74.37
Unlock Deck
Unlock for access to all 217 flashcards in this deck.
Unlock Deck
k this deck
54
THE NEXT QUESTIONS ARE BASED ON THE FOLLOWING INFORMATION:
A sample of 8 households was asked about their monthly income (x)and the number of hours they spend connected to the internet each month (y).The data yield the following statistics:
,
,
,
,
Determine the regression sum of squares.
A)691.038
B)1033.601
C)461.812
D)437.918
A sample of 8 households was asked about their monthly income (x)and the number of hours they spend connected to the internet each month (y).The data yield the following statistics:
,
,
,
,
Determine the regression sum of squares.
A)691.038
B)1033.601
C)461.812
D)437.918
Unlock Deck
Unlock for access to all 217 flashcards in this deck.
Unlock Deck
k this deck
55
THE NEXT QUESTIONS ARE BASED ON THE FOLLOWING INFORMATION:
A sample of 8 households was asked about their monthly income (x)and the number of hours they spend connected to the internet each month (y).The data yield the following statistics:
,
,
,
,
Determine the estimate of the variance of the population model error.
A)118.347
B)114.698
C)19.399
D)76.494
A sample of 8 households was asked about their monthly income (x)and the number of hours they spend connected to the internet each month (y).The data yield the following statistics:
,
,
,
,
Determine the estimate of the variance of the population model error.
A)118.347
B)114.698
C)19.399
D)76.494
Unlock Deck
Unlock for access to all 217 flashcards in this deck.
Unlock Deck
k this deck
56
THE NEXT QUESTIONS ARE BASED ON THE FOLLOWING INFORMATION:
A sample of 8 households was asked about their monthly income (x)and the number of hours they spend connected to the internet each month (y).The data yield the following statistics:
,
,
,
,
Compute the standard error of the slope of the regression line of hours on income.
A)0.256
B)0.234
C)0.211
D)0.269
Unlock Deck
Unlock for access to all 217 flashcards in this deck.
Unlock Deck
k this deck
57
THE NEXT QUESTIONS ARE BASED ON THE FOLLOWING INFORMATION:
A sample of 8 households was asked about their monthly income (x)and the number of hours they spend connected to the internet each month (y).The data yield the following statistics:
,
,
,
,
Determine the sample correlation coefficient between x and y.
A)0.678
B)0.791
C)0.905
D)0.775
A sample of 8 households was asked about their monthly income (x)and the number of hours they spend connected to the internet each month (y).The data yield the following statistics:
,
,
,
,
Determine the sample correlation coefficient between x and y.
A)0.678
B)0.791
C)0.905
D)0.775
Unlock Deck
Unlock for access to all 217 flashcards in this deck.
Unlock Deck
k this deck
58
A regression analysis between weight (y in pounds)and height (x in inches)resulted in the following least squares line: = 120 + 5x.This implies that if the height is increased by 1 inch,the weight is expected to:
A)increase by 1 pound.
B)decrease by 1 pound.
C)decrease by 120 pounds.
D)increase by 5 pounds.
= 120 + 5x.This implies that if the height is increased by 1 inch,the weight is expected to:A)increase by 1 pound.
B)decrease by 1 pound.
C)decrease by 120 pounds.
D)increase by 5 pounds.
Unlock Deck
Unlock for access to all 217 flashcards in this deck.
Unlock Deck
k this deck
59
THE NEXT QUESTIONS ARE BASED ON THE FOLLOWING INFORMATION:
A sample of 8 households was asked about their monthly income (x)and the number of hours they spend connected to the internet each month (y).The data yield the following statistics:
,
,
,
,
What is the standard deviation of the number of hours households spend connected to the internet each month?
A)12.817
B)14.667
C)15.679
D)11.990
Unlock Deck
Unlock for access to all 217 flashcards in this deck.
Unlock Deck
k this deck
60
THE NEXT QUESTIONS ARE BASED ON THE FOLLOWING INFORMATION:
Suppose we have the following information from a simple regression:
b0= 117.4,b1 = -14.39,s
= 0.18,s
= 0.18,n = 300,
= 4.3,SST = 17,045,and SSE = 12,053.
The correlation coefficient is:
A)-0.6834
B)0.5412
C)0.6834
D)-0.5412
Suppose we have the following information from a simple regression:
b0= 117.4,b1 = -14.39,s
= 0.18,s
= 0.18,n = 300,
= 4.3,SST = 17,045,and SSE = 12,053.
The correlation coefficient is:
A)-0.6834
B)0.5412
C)0.6834
D)-0.5412
Unlock Deck
Unlock for access to all 217 flashcards in this deck.
Unlock Deck
k this deck
61
THE NEXT QUESTIONS ARE BASED ON THE FOLLOWING INFORMATION:
A sample of 8 households was asked about their monthly income (x)and the number of hours they spend connected to the internet each month (y).The data yield the following statistics:
,
,
,
,
An indication of no linear relationship between two variables would be a:
A)coefficient of determination equal to 1
B)coefficient of determination equal to -1
C)coefficient of correlation equal to 0
D)coefficient of correlation equal to -1
Unlock Deck
Unlock for access to all 217 flashcards in this deck.
Unlock Deck
k this deck
62
THE NEXT QUESTIONS ARE BASED ON THE FOLLOWING INFORMATION:
A professor of statistics is interested in studying the relationship between the number of hours graduate students spent studying for his comprehensive final exam and the exam score.The results of the regression analysis of hours studied on exam scores are presented below.
Determine the slope of the sample regression line.
A)3.71
B)1.24
C)4.60
D)3.92
Unlock Deck
Unlock for access to all 217 flashcards in this deck.
Unlock Deck
k this deck
63
THE NEXT QUESTIONS ARE BASED ON THE FOLLOWING INFORMATION:
A sales manager is interested in determining the relationship between the amount spent on advertising and total sales.The manager collects data for the past 24 months and runs a regression of sales on advertising expenditures.The results are presented below but,unfortunately,some values identified by asterisks are missing.
SUMMARY OUTPUT
Determine the value of residual sum of squares.
A)10,945.2
B)11,759.9
C)10,130.5
D)36,935.8
Unlock Deck
Unlock for access to all 217 flashcards in this deck.
Unlock Deck
k this deck
64
THE NEXT QUESTIONS ARE BASED ON THE FOLLOWING INFORMATION:
A sales manager is interested in determining the relationship between the amount spent on advertising and total sales.The manager collects data for the past 24 months and runs a regression of sales on advertising expenditures.The results are presented below but,unfortunately,some values identified by asterisks are missing.
SUMMARY OUTPUT
What is the value of total sum of squares?
A)48,745.2
B)46,538.7
C)50,292.4
D)52,644.8
Unlock Deck
Unlock for access to all 217 flashcards in this deck.
Unlock Deck
k this deck
65
THE NEXT QUESTIONS ARE BASED ON THE FOLLOWING INFORMATION:
A sales manager is interested in determining the relationship between the amount spent on advertising and total sales.The manager collects data for the past 24 months and runs a regression of sales on advertising expenditures.The results are presented below but,unfortunately,some values identified by asterisks are missing.
SUMMARY OUTPUT
Calculate the standard error of estimate.
A)0)66
B)0)76
C)0)85
D)0)61
Unlock Deck
Unlock for access to all 217 flashcards in this deck.
Unlock Deck
k this deck
66
THE NEXT QUESTIONS ARE BASED ON THE FOLLOWING INFORMATION:
A professor of statistics is interested in studying the relationship between the number of hours graduate students spent studying for his comprehensive final exam and the exam score.The results of the regression analysis of hours studied on exam scores are presented below.
For the given data,which of the following is the result of the hypothesis test?
A)Since the test statistic equals 4.439 and the critical value equals 1.645,we reject the null hypothesis and assume there is a positive correlation between the variables.
B)Since the test statistic equals 4.113 and the critical value equals -1.645,we fail to reject the null hypothesis and assume there is no correlation between the variables.
C)Since the test statistic equals 3.305 and the critical value equals 2.447,we reject the null hypothesis and assume there is a correlation between the variables.
D)Since the test statistic equals 3.707 and the critical value equals 1.943,we reject the null hypothesis and assume there is a positive correlation between the variables.
Unlock Deck
Unlock for access to all 217 flashcards in this deck.
Unlock Deck
k this deck
67
THE NEXT QUESTIONS ARE BASED ON THE FOLLOWING INFORMATION:
A professor of statistics is interested in studying the relationship between the number of hours graduate students spent studying for his comprehensive final exam and the exam score.The results of the regression analysis of hours studied on exam scores are presented below.
Which of the following is the value of the sample correlation?
A)0.696
B)0.834
C)0.645
D)0.803
Unlock Deck
Unlock for access to all 217 flashcards in this deck.
Unlock Deck
k this deck
68
THE NEXT QUESTIONS ARE BASED ON THE FOLLOWING INFORMATION:
A sales manager is interested in determining the relationship between the amount spent on advertising and total sales.The manager collects data for the past 24 months and runs a regression of sales on advertising expenditures.The results are presented below but,unfortunately,some values identified by asterisks are missing.
SUMMARY OUTPUT
If the regression line = 3 + 2x has been fitted to the data points (4,8),(2,5),and (1,2),the residual sum of squares will be:
A)10
B)15
C)13
D)22
A sales manager is interested in determining the relationship between the amount spent on advertising and total sales.The manager collects data for the past 24 months and runs a regression of sales on advertising expenditures.The results are presented below but,unfortunately,some values identified by asterisks are missing.
SUMMARY OUTPUT
If the regression line
= 3 + 2x has been fitted to the data points (4,8),(2,5),and (1,2),the residual sum of squares will be:A)10
B)15
C)13
D)22
Unlock Deck
Unlock for access to all 217 flashcards in this deck.
Unlock Deck
k this deck
69
THE NEXT QUESTIONS ARE BASED ON THE FOLLOWING INFORMATION:
A professor of statistics is interested in studying the relationship between the number of hours graduate students spent studying for his comprehensive final exam and the exam score.The results of the regression analysis of hours studied on exam scores are presented below.
Determine the intercept of the sample regression line.
A)11.17
B)64.30
C)92.40
D)13.74
Unlock Deck
Unlock for access to all 217 flashcards in this deck.
Unlock Deck
k this deck
70
THE NEXT QUESTIONS ARE BASED ON THE FOLLOWING INFORMATION:
A professor of statistics is interested in studying the relationship between the number of hours graduate students spent studying for his comprehensive final exam and the exam score.The results of the regression analysis of hours studied on exam scores are presented below.
What is the value of the test statistic for testing H0 : ρ = 0 vs.Ha : ρ >0?
A)4.439
B)4.113
C)3.707
D)3.305
Unlock Deck
Unlock for access to all 217 flashcards in this deck.
Unlock Deck
k this deck
71
THE NEXT QUESTIONS ARE BASED ON THE FOLLOWING INFORMATION:
A sales manager is interested in determining the relationship between the amount spent on advertising and total sales.The manager collects data for the past 24 months and runs a regression of sales on advertising expenditures.The results are presented below but,unfortunately,some values identified by asterisks are missing.
SUMMARY OUTPUT
The value of mean square error is:
A)1678.9
B)1,554.25
C)1,493.63
D)1,407.35
Unlock Deck
Unlock for access to all 217 flashcards in this deck.
Unlock Deck
k this deck
72
THE NEXT QUESTIONS ARE BASED ON THE FOLLOWING INFORMATION:
A sales manager is interested in determining the relationship between the amount spent on advertising and total sales.The manager collects data for the past 24 months and runs a regression of sales on advertising expenditures.The results are presented below but,unfortunately,some values identified by asterisks are missing.
SUMMARY OUTPUT
The total degrees of freedom is:
A)21
B)22
C)23
D)24
Unlock Deck
Unlock for access to all 217 flashcards in this deck.
Unlock Deck
k this deck
73
THE NEXT QUESTIONS ARE BASED ON THE FOLLOWING INFORMATION:
A sales manager is interested in determining the relationship between the amount spent on advertising and total sales.The manager collects data for the past 24 months and runs a regression of sales on advertising expenditures.The results are presented below but,unfortunately,some values identified by asterisks are missing.
SUMMARY OUTPUT
Correlation analysis is used to determine the:
A)strength of the relationship between x and y.
B)least squares estimates of the regression parameters.
C)predicted value of y for a given value of x.
D)forecast value of a particular dependent variable.
Unlock Deck
Unlock for access to all 217 flashcards in this deck.
Unlock Deck
k this deck
74
THE NEXT QUESTIONS ARE BASED ON THE FOLLOWING INFORMATION:
A professor of statistics is interested in studying the relationship between the number of hours graduate students spent studying for his comprehensive final exam and the exam score.The results of the regression analysis of hours studied on exam scores are presented below.
For the given data,what is/are the critical value(s)for testing the hypotheses at 0.05 level of significance?
A)+1.943
B)± 2.447
C)+1.645
D)-1.645
Unlock Deck
Unlock for access to all 217 flashcards in this deck.
Unlock Deck
k this deck
75
THE NEXT QUESTIONS ARE BASED ON THE FOLLOWING INFORMATION:
A sales manager is interested in determining the relationship between the amount spent on advertising and total sales.The manager collects data for the past 24 months and runs a regression of sales on advertising expenditures.The results are presented below but,unfortunately,some values identified by asterisks are missing.
SUMMARY OUTPUT
In a regression problem,a coefficient of determination 0.90 indicates that:
A)90% of the y values are positive.
B)90% of the variation in y can be explained by the regression line.
C)90% of the x values are equal.
D)90% of the variation in x can be explained by the regression line.
Unlock Deck
Unlock for access to all 217 flashcards in this deck.
Unlock Deck
k this deck
76
THE NEXT QUESTIONS ARE BASED ON THE FOLLOWING INFORMATION:
A sales manager is interested in determining the relationship between the amount spent on advertising and total sales.The manager collects data for the past 24 months and runs a regression of sales on advertising expenditures.The results are presented below but,unfortunately,some values identified by asterisks are missing.
SUMMARY OUTPUT
A regression analysis between sales (in $1000)and advertising (in $100)resulted in the following least squares line: = 75 + 5x.This implies that if advertising is $800,then the predicted amount of sales (in dollars)is:
A)$4075
B)$115,000
C)$164,000
D)$179,000
A sales manager is interested in determining the relationship between the amount spent on advertising and total sales.The manager collects data for the past 24 months and runs a regression of sales on advertising expenditures.The results are presented below but,unfortunately,some values identified by asterisks are missing.
SUMMARY OUTPUT
A regression analysis between sales (in $1000)and advertising (in $100)resulted in the following least squares line:
= 75 + 5x.This implies that if advertising is $800,then the predicted amount of sales (in dollars)is:A)$4075
B)$115,000
C)$164,000
D)$179,000
Unlock Deck
Unlock for access to all 217 flashcards in this deck.
Unlock Deck
k this deck
77
THE NEXT QUESTIONS ARE BASED ON THE FOLLOWING INFORMATION:
A sample of 8 households was asked about their monthly income (x)and the number of hours they spend connected to the internet each month (y).The data yield the following statistics:
,
,
,
,
Which of the following is the value of the test statistic for testing H0 : β1 = 0 vs.H1 : β1 ≠ 0?
A)2.36
B)3.01
C)2.48
D)2.71
Unlock Deck
Unlock for access to all 217 flashcards in this deck.
Unlock Deck
k this deck
78
THE NEXT QUESTIONS ARE BASED ON THE FOLLOWING INFORMATION:
A sales manager is interested in determining the relationship between the amount spent on advertising and total sales.The manager collects data for the past 24 months and runs a regression of sales on advertising expenditures.The results are presented below but,unfortunately,some values identified by asterisks are missing.
SUMMARY OUTPUT
What are the degrees of freedom for residuals?
A)21
B)22
C)23
D)24
Unlock Deck
Unlock for access to all 217 flashcards in this deck.
Unlock Deck
k this deck
79
THE NEXT QUESTIONS ARE BASED ON THE FOLLOWING INFORMATION:
A professor of statistics is interested in studying the relationship between the number of hours graduate students spent studying for his comprehensive final exam and the exam score.The results of the regression analysis of hours studied on exam scores are presented below.
The value of the coefficient of determination is:
A)0.696
B)0.834
C)211.6
D)3.924
Unlock Deck
Unlock for access to all 217 flashcards in this deck.
Unlock Deck
k this deck
80
THE NEXT QUESTIONS ARE BASED ON THE FOLLOWING INFORMATION:
A sales manager is interested in determining the relationship between the amount spent on advertising and total sales.The manager collects data for the past 24 months and runs a regression of sales on advertising expenditures.The results are presented below but,unfortunately,some values identified by asterisks are missing.
SUMMARY OUTPUT
Determine the regression coefficient of the y-intercept.
A)112.4
B)102.3
C)108.6
D)105.5
Unlock Deck
Unlock for access to all 217 flashcards in this deck.
Unlock Deck
k this deck
Unlock Deck
Unlock for access to all 217 flashcards in this deck.


