Deck 14: Structure Determination II
Full screen (f)
Question
Which of the following compounds would have a doublet peak in the 3350cm-1 range?
A)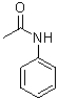
B)
C)
D)
A)
B)
C)
D)
Question
Question
What would be observed around 3350 cm-1 in the IR spectrum of the molecule shown below? 
A)no peak
B)a single peak
C)a double peak
D)a triple peak
A)no peak
B)a single peak
C)a double peak
D)a triple peak
Question
Question
Question
Which of the following molecules would be expected to generate the largest M+2 peak in a mass spectrum?
A)
B)
C)
D)
A)
B)
C)
D)
Question
What signal on an IR spectrum would be best utilized to monitor the following transformation? 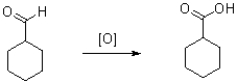
A)loss of signal around 1600 cm-1
B)gain of signal around 1600 cm-1
C)loss of a broad signal in the hydrogen region
D)gain of a broad signal in the hydrogen region
A)loss of signal around 1600 cm-1
B)gain of signal around 1600 cm-1
C)loss of a broad signal in the hydrogen region
D)gain of a broad signal in the hydrogen region
Question
Which of the following molecules would give the strongest signal in the triple bond region of an IR spectrum?
A)
B)
C)
D)
A)
B)
C)
D)
Question
Question
Which of the following compounds would have peaks in the 3300 cm-1 range?
A)
B)
C)
D)
A)
B)
C)
D)
Question
Question
Question
Question
Question
Question
Question
What signal on an IR spectrum would be best utilized to monitor the following transformation? 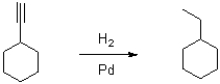
A)loss of signal at 3300 cm-1
B)gain of signal at 3300 cm-1
C)loss of signal at 2300 cm-1
D)gain of signal at 2300 cm-1
A)loss of signal at 3300 cm-1
B)gain of signal at 3300 cm-1
C)loss of signal at 2300 cm-1
D)gain of signal at 2300 cm-1
Question
Question
Question
Question
Question
Question
Question
Question
Question
Question
Question
Question
Question
Question
Question
Question
Question
Question
Question
Question
Question
Question
Question
Question
Question
Question
Question
Question
Question
Question
Question
Question
Question
Question
Question
Question
Question
Question
Question
Question
Question
Question
Question
Question
Question
Question
Question
Identify how IR spectroscopy could be used to monitor the following reaction. 
Question
Question
Identify how IR spectroscopy could be used to monitor the following reaction. 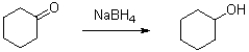

Unlock Deck
Sign up to unlock the cards in this deck!
Unlock Deck
Unlock Deck
1/66
Play
Full screen (f)
Deck 14: Structure Determination II
1
Which of the following compounds would have a doublet peak in the 3350cm-1 range?
A)
B)
C)
D)
A)
B)
C)
D)
2
Which of the following functional groups has the sharpest signal in the double bond region of an IR spectrum?
A)aldehyde
B)ketone
C)amide
D)alkene
A)aldehyde
B)ketone
C)amide
D)alkene
alkene
3
What would be observed around 3350 cm-1 in the IR spectrum of the molecule shown below?
A)no peak
B)a single peak
C)a double peak
D)a triple peak
A)no peak
B)a single peak
C)a double peak
D)a triple peak
a single peak
4
What does a peak with an odd mass/charge ratio represent?
A)an organic molecule containing any number of nitrogens
B)an organic molecule containing an even number of nitrogens
C)an organic molecule containing an odd number of nitrogens
D)an organic molecule containing no nitrogen atoms
A)an organic molecule containing any number of nitrogens
B)an organic molecule containing an even number of nitrogens
C)an organic molecule containing an odd number of nitrogens
D)an organic molecule containing no nitrogen atoms
Unlock Deck
Unlock for access to all 66 flashcards in this deck.
Unlock Deck
k this deck
5
A molecular ion has a m/z ratio of 143.What can be said about that molecule?
A)It contains an odd number of nitrogen atoms.
B)It contains an even number of nitrogen atoms.
C)It contains nitrogen atoms.
D)It contains no nitrogen atoms.
A)It contains an odd number of nitrogen atoms.
B)It contains an even number of nitrogen atoms.
C)It contains nitrogen atoms.
D)It contains no nitrogen atoms.
Unlock Deck
Unlock for access to all 66 flashcards in this deck.
Unlock Deck
k this deck
6
Which of the following molecules would be expected to generate the largest M+2 peak in a mass spectrum?
A)
B)
C)
D)
A)
B)
C)
D)
Unlock Deck
Unlock for access to all 66 flashcards in this deck.
Unlock Deck
k this deck
7
What signal on an IR spectrum would be best utilized to monitor the following transformation?
A)loss of signal around 1600 cm-1
B)gain of signal around 1600 cm-1
C)loss of a broad signal in the hydrogen region
D)gain of a broad signal in the hydrogen region
A)loss of signal around 1600 cm-1
B)gain of signal around 1600 cm-1
C)loss of a broad signal in the hydrogen region
D)gain of a broad signal in the hydrogen region
Unlock Deck
Unlock for access to all 66 flashcards in this deck.
Unlock Deck
k this deck
8
Which of the following molecules would give the strongest signal in the triple bond region of an IR spectrum?
A)
B)
C)
D)
A)
B)
C)
D)
Unlock Deck
Unlock for access to all 66 flashcards in this deck.
Unlock Deck
k this deck
9
Which of the following functional groups has the broadest signal in the hydrogen region of an IR spectrum?
A)carboxylic acid
B)alcohol
C)primary amine
D)secondary amine
A)carboxylic acid
B)alcohol
C)primary amine
D)secondary amine
Unlock Deck
Unlock for access to all 66 flashcards in this deck.
Unlock Deck
k this deck
10
Which of the following compounds would have peaks in the 3300 cm-1 range?
A)
B)
C)
D)
A)
B)
C)
D)
Unlock Deck
Unlock for access to all 66 flashcards in this deck.
Unlock Deck
k this deck
11
What functional group is represented by a broad peak at 3300 cm-1?
A)ester
B)ketone
C)aldehyde
D)carboxylic acid
A)ester
B)ketone
C)aldehyde
D)carboxylic acid
Unlock Deck
Unlock for access to all 66 flashcards in this deck.
Unlock Deck
k this deck
12
What represents the triple bond region on an IR spectrum?
A)3600-2700 cm-1
B)2700-1900 cm-1
C)1900-1500 cm-1
D)1500-500 cm-1
A)3600-2700 cm-1
B)2700-1900 cm-1
C)1900-1500 cm-1
D)1500-500 cm-1
Unlock Deck
Unlock for access to all 66 flashcards in this deck.
Unlock Deck
k this deck
13
What does a mass spectrum with a significant M + 2 peak represent?
A)a chlorine containing molecule
B)a nitrogen containing molecule
C)a fluorine containing molecule
D)a sulfur containing molecule
A)a chlorine containing molecule
B)a nitrogen containing molecule
C)a fluorine containing molecule
D)a sulfur containing molecule
Unlock Deck
Unlock for access to all 66 flashcards in this deck.
Unlock Deck
k this deck
14
What represents the fingerprint region on an IR spectrum?
A)3600-2700 cm-1
B)2700-1900 cm-1
C)1900-1500 cm-1
D)1500-500 cm-1
A)3600-2700 cm-1
B)2700-1900 cm-1
C)1900-1500 cm-1
D)1500-500 cm-1
Unlock Deck
Unlock for access to all 66 flashcards in this deck.
Unlock Deck
k this deck
15
What functional group is represented by a signal at 2220 cm-1 in an IR spectrum?
A)alkyne
B)alkene
C)carboxylic acid
D)amide
A)alkyne
B)alkene
C)carboxylic acid
D)amide
Unlock Deck
Unlock for access to all 66 flashcards in this deck.
Unlock Deck
k this deck
16
What does the base peak represent in a mass spectrum?
A)the peak representing the molecular ion
B)the peak with the largest intensity
C)the peak with the largest mass/charge ratio
D)the reference peak
A)the peak representing the molecular ion
B)the peak with the largest intensity
C)the peak with the largest mass/charge ratio
D)the reference peak
Unlock Deck
Unlock for access to all 66 flashcards in this deck.
Unlock Deck
k this deck
17
What signal on an IR spectrum would be best utilized to monitor the following transformation?
A)loss of signal at 3300 cm-1
B)gain of signal at 3300 cm-1
C)loss of signal at 2300 cm-1
D)gain of signal at 2300 cm-1
A)loss of signal at 3300 cm-1
B)gain of signal at 3300 cm-1
C)loss of signal at 2300 cm-1
D)gain of signal at 2300 cm-1
Unlock Deck
Unlock for access to all 66 flashcards in this deck.
Unlock Deck
k this deck
18
What does mass spectrometry separate molecules by?
A)mass
B)charge
C)mass / charge
D)charge / mass
A)mass
B)charge
C)mass / charge
D)charge / mass
Unlock Deck
Unlock for access to all 66 flashcards in this deck.
Unlock Deck
k this deck
19
What represents the hydrogen region on an IR spectrum?
A)3600-2700 cm-1
B)2700-1900 cm-1
C)1900-1500 cm-1
D)1500-500 cm-1
A)3600-2700 cm-1
B)2700-1900 cm-1
C)1900-1500 cm-1
D)1500-500 cm-1
Unlock Deck
Unlock for access to all 66 flashcards in this deck.
Unlock Deck
k this deck
20
What atom could be contained in a molecule that shows near equal intensities of an M+ and M + 2 peak?
A)O
B)N
C)Cl
D)Br
A)O
B)N
C)Cl
D)Br
Unlock Deck
Unlock for access to all 66 flashcards in this deck.
Unlock Deck
k this deck
21
What is represented by the 2700-1900 cm-1 region in an IR spectrum?
A)hydrogen region
B)triple bond region
C)double bond region
D)fingerprint region
A)hydrogen region
B)triple bond region
C)double bond region
D)fingerprint region
Unlock Deck
Unlock for access to all 66 flashcards in this deck.
Unlock Deck
k this deck
22
What is represented by the 500-1500 cm-1 region in an IR spectrum?
A)hydrogen region
B)triple bond region
C)double bond region
D)fingerprint region
A)hydrogen region
B)triple bond region
C)double bond region
D)fingerprint region
Unlock Deck
Unlock for access to all 66 flashcards in this deck.
Unlock Deck
k this deck
23
What region of an IR spectrum would indicate the presence of a nitro group?
A)3600-2700 cm-1
B)2700-1900 cm-1
C)1900-1500 cm-1
D)1500-500 cm-1
A)3600-2700 cm-1
B)2700-1900 cm-1
C)1900-1500 cm-1
D)1500-500 cm-1
Unlock Deck
Unlock for access to all 66 flashcards in this deck.
Unlock Deck
k this deck
24
The IR peak at 2250 cm-1 represents a cyano group stretching frequency.
Unlock Deck
Unlock for access to all 66 flashcards in this deck.
Unlock Deck
k this deck
25
What region of an IR spectrum would best distinguish between a ketone and an aldehyde?
A)hydrogen region
B)triple bond region
C)double bond region
D)fingerprint region
A)hydrogen region
B)triple bond region
C)double bond region
D)fingerprint region
Unlock Deck
Unlock for access to all 66 flashcards in this deck.
Unlock Deck
k this deck
26
A peak on a mass spectrum of an organic compound with an odd mass-to-charge ratio is indicative of a molecule with an odd number of nitrogens.
Unlock Deck
Unlock for access to all 66 flashcards in this deck.
Unlock Deck
k this deck
27
Low-resolution mass spectrometry can be used to distinguish different atomic isotopes.
Unlock Deck
Unlock for access to all 66 flashcards in this deck.
Unlock Deck
k this deck
28
Terminal alkynes show a stronger signal than internal alkynes on an IR spectrum around 2400 cm-1.
Unlock Deck
Unlock for access to all 66 flashcards in this deck.
Unlock Deck
k this deck
29
Hydroxyl groups show a sharp IR absorbance around 3400 cm-1.
Unlock Deck
Unlock for access to all 66 flashcards in this deck.
Unlock Deck
k this deck
30
What region of an IR spectrum would best distinguish between an ester and a carboxylic acid?
A)3600-2700 cm-1
B)2700-1900 cm-1
C)1900-1500 cm-1
D)1500-500 cm-1
A)3600-2700 cm-1
B)2700-1900 cm-1
C)1900-1500 cm-1
D)1500-500 cm-1
Unlock Deck
Unlock for access to all 66 flashcards in this deck.
Unlock Deck
k this deck
31
Cyano peaks show stronger signals than alkynes in IR spectrums.
Unlock Deck
Unlock for access to all 66 flashcards in this deck.
Unlock Deck
k this deck
32
What region of an IR spectrum would best distinguish between an alkyl ether and an aromatic ether?
A)hydrogen region
B)triple bond region
C)double bond region
D)fingerprint region
A)hydrogen region
B)triple bond region
C)double bond region
D)fingerprint region
Unlock Deck
Unlock for access to all 66 flashcards in this deck.
Unlock Deck
k this deck
33
IR peaks can be a result of bond stretching.
Unlock Deck
Unlock for access to all 66 flashcards in this deck.
Unlock Deck
k this deck
34
Which of the following best describes a carbonyl peak on an IR spectrum?
A)It displays a stronger signal than an alkene bond because it is more polar.
B)It displays a stronger signal than an alkene bond because it is less polar.
C)It displays a weaker signal than an alkene bond because it is more polar.
D)It displays a weaker signal than an alkene bond because it is less polar.
Unlock Deck
Unlock for access to all 66 flashcards in this deck.
Unlock Deck
k this deck
35
A compound with a large M+2 peak on a mass spectrum represents a nitrogen-containing molecule.
Unlock Deck
Unlock for access to all 66 flashcards in this deck.
Unlock Deck
k this deck
36
What region of an IR spectrum would best distinguish between a ketone and an aldehyde?
A)3600-2700 cm-1
B)2700-1900 cm-1
C)1900-1500 cm-1
D)1500-500 cm-1
A)3600-2700 cm-1
B)2700-1900 cm-1
C)1900-1500 cm-1
D)1500-500 cm-1
Unlock Deck
Unlock for access to all 66 flashcards in this deck.
Unlock Deck
k this deck
37
The base peak represents the peak on a mass spectrum with the highest relative intensity.
Unlock Deck
Unlock for access to all 66 flashcards in this deck.
Unlock Deck
k this deck
38
Symmetric bonds show large IR absorbances due to stretching vibrations.
Unlock Deck
Unlock for access to all 66 flashcards in this deck.
Unlock Deck
k this deck
39
What results from fragmentation of a molecular ion?
A)a neutral molecule and a neutral radical
B)a charged ion and a neutral radical
C)a neutral molecule and a charged radical
D)two charged ions
A)a neutral molecule and a neutral radical
B)a charged ion and a neutral radical
C)a neutral molecule and a charged radical
D)two charged ions
Unlock Deck
Unlock for access to all 66 flashcards in this deck.
Unlock Deck
k this deck
40
The base peak of a mass spectrum represents the atomic mass of the full ionized molecule.
Unlock Deck
Unlock for access to all 66 flashcards in this deck.
Unlock Deck
k this deck
41
High resolution mass spectrometry is required to differentiate between different isotopes.
Unlock Deck
Unlock for access to all 66 flashcards in this deck.
Unlock Deck
k this deck
42
The y-axis of an IR spectrum is _______________ .
Unlock Deck
Unlock for access to all 66 flashcards in this deck.
Unlock Deck
k this deck
43
C7H8 has 39 distinct vibrations.
Unlock Deck
Unlock for access to all 66 flashcards in this deck.
Unlock Deck
k this deck
44
The peak with the largest intensity on a mass spectrum represents the _______________ peak.
Unlock Deck
Unlock for access to all 66 flashcards in this deck.
Unlock Deck
k this deck
45
A mass spectrometer measures the _______________ of a molecule.
Unlock Deck
Unlock for access to all 66 flashcards in this deck.
Unlock Deck
k this deck
46
C2H2 has two distinct vibrations.
Unlock Deck
Unlock for access to all 66 flashcards in this deck.
Unlock Deck
k this deck
47
Molecular ions for mass spectrometry are generated from bombardment of the molecule by electrons.
Unlock Deck
Unlock for access to all 66 flashcards in this deck.
Unlock Deck
k this deck
48
Methanol has 12 distinct vibrations.
Unlock Deck
Unlock for access to all 66 flashcards in this deck.
Unlock Deck
k this deck
49
Alkene peaks are stronger than carbonyl peaks in IR spectrums.
Unlock Deck
Unlock for access to all 66 flashcards in this deck.
Unlock Deck
k this deck
50
The y-axis of an IR spectrum is percent absorbance.
Unlock Deck
Unlock for access to all 66 flashcards in this deck.
Unlock Deck
k this deck
51
Triple bonds are found at higher wave numbers than double bonds in an IR spectrum.
Unlock Deck
Unlock for access to all 66 flashcards in this deck.
Unlock Deck
k this deck
52
O-H stretching of alcohols shows a broad signal around 3300 cm-1.
Unlock Deck
Unlock for access to all 66 flashcards in this deck.
Unlock Deck
k this deck
53
The fingerprint region in an IR spectrum is found between 2800 cm-1 and 3500 cm-1.
Unlock Deck
Unlock for access to all 66 flashcards in this deck.
Unlock Deck
k this deck
54
Wavenumber is directly proportional to the energy of light absorbed.
Unlock Deck
Unlock for access to all 66 flashcards in this deck.
Unlock Deck
k this deck
55
1500-500 cm-1 on an IR spectrum represents the _______________ region.
Unlock Deck
Unlock for access to all 66 flashcards in this deck.
Unlock Deck
k this deck
56
Fragmentation of a molecule ion results in two charged species.
Unlock Deck
Unlock for access to all 66 flashcards in this deck.
Unlock Deck
k this deck
57
Molecular ion fragmentation in a mass spectrometer can give insight of a molecular structure.
Unlock Deck
Unlock for access to all 66 flashcards in this deck.
Unlock Deck
k this deck
58
The units of the x-axis of an IR spectrum is _______________ .
Unlock Deck
Unlock for access to all 66 flashcards in this deck.
Unlock Deck
k this deck
59
Fragmentation results in the generation of a radical species.
Unlock Deck
Unlock for access to all 66 flashcards in this deck.
Unlock Deck
k this deck
60
Wavenumber and wavelength are _______________ proportional.
Unlock Deck
Unlock for access to all 66 flashcards in this deck.
Unlock Deck
k this deck
61
_______________ alkynes show very weak signals in an IR spectrum.
Unlock Deck
Unlock for access to all 66 flashcards in this deck.
Unlock Deck
k this deck
62
2700-1900 cm-1 on an IR spectrum represents the _______________ region.
Unlock Deck
Unlock for access to all 66 flashcards in this deck.
Unlock Deck
k this deck
63
IR absorbance around 2300 cm-1 represents carbon-carbon bond_______________ of an alkyne.
Unlock Deck
Unlock for access to all 66 flashcards in this deck.
Unlock Deck
k this deck
64
Identify how IR spectroscopy could be used to monitor the following reaction.
Unlock Deck
Unlock for access to all 66 flashcards in this deck.
Unlock Deck
k this deck
65
3600-2700 cm-1 on an IR spectrum represents the ______________ region.
Unlock Deck
Unlock for access to all 66 flashcards in this deck.
Unlock Deck
k this deck
66
Identify how IR spectroscopy could be used to monitor the following reaction.
Unlock Deck
Unlock for access to all 66 flashcards in this deck.
Unlock Deck
k this deck
Unlock Deck
Unlock for access to all 66 flashcards in this deck.


