Deck 11: Monetary Policy
Full screen (f)
Question
Question
Question
Question
Question
Question
Question
Question
Question
Question
Question
Question
Question
Question
Question
Question
Question
Question
Question
Question
Question
Question
Question
Question
Question
Question
Question
Question
Question
Figure 11.1 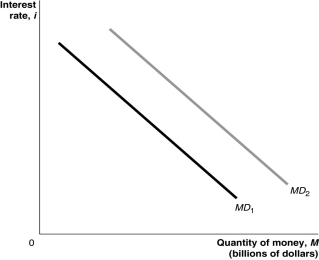 Alt text for Figure 11.1: In figure 11.1, a graph shows shift in the money demand curve.
Long description for Figure 11.1: The x-axis is labelled, quantity of money, M (billions of dollars).The y-axis is labelled, interest rate, i.2 lines are shown; MD1 and MD2.Line MD1 begins in the top left corner and slopes down to the end of the x-axis.Line MD2 follows the same slope as line MD1, but is plotted to the right.
Refer to Figure 11.1.In the figure, the money demand curve would move from MD1 to MD2 if
A)real GDP increased.
B)the price level decreased.
C)the interest rate increased.
D)the Bank of Canada sold government of Canada securities.
E)population fell.
Alt text for Figure 11.1: In figure 11.1, a graph shows shift in the money demand curve.Long description for Figure 11.1: The x-axis is labelled, quantity of money, M (billions of dollars).The y-axis is labelled, interest rate, i.2 lines are shown; MD1 and MD2.Line MD1 begins in the top left corner and slopes down to the end of the x-axis.Line MD2 follows the same slope as line MD1, but is plotted to the right.
Refer to Figure 11.1.In the figure, the money demand curve would move from MD1 to MD2 if
A)real GDP increased.
B)the price level decreased.
C)the interest rate increased.
D)the Bank of Canada sold government of Canada securities.
E)population fell.
Question
Question
Question
Question
Question
Question
Question
Question
Question
Question
Question
Question
Question
Question
Question
Question
Figure 11.3 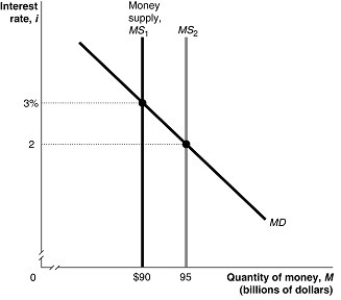 Alt text for Figure 11.3: In figure 11.3, a graph shows shift in money supply.
Long description for Figure 11.3: The x-axis is labelled, quantity of money, M (billions of dollars), with values $90 and 95 marked.The y-axis is labelled, interest rate, i, with values 2 and 3% marked.3 lines are shown; MS1, MS2, and MD.Line MD begins in the top left corner and slopes down to the end of the x-axis.Line Money, supply MS1, is perpendicular to the x-axis, and begins from the value $90.Line MS2 is perpendicular to the x-axis, and begins from the value 95, to the right of line MS1.Line MD meets line MS1 at point ($90, 3%), approximately 3 quarters of the way along both lines.Line MD meets line MS2 at point (95, 2), almost half way along both lines.These points of intersection are connected to their respective coordinates on the y-axis using dotted lines.
Refer to Figure 11.3.In the figure above, when the money supply shifts from MS1 to MS2, at the interest rate of 3 percent households and firms will
A)buy Canada bonds.
B)sell Canada bonds.
C)neither buy nor sell Canada bonds.
D)want to hold more money.
E)increase their savings.
Alt text for Figure 11.3: In figure 11.3, a graph shows shift in money supply.Long description for Figure 11.3: The x-axis is labelled, quantity of money, M (billions of dollars), with values $90 and 95 marked.The y-axis is labelled, interest rate, i, with values 2 and 3% marked.3 lines are shown; MS1, MS2, and MD.Line MD begins in the top left corner and slopes down to the end of the x-axis.Line Money, supply MS1, is perpendicular to the x-axis, and begins from the value $90.Line MS2 is perpendicular to the x-axis, and begins from the value 95, to the right of line MS1.Line MD meets line MS1 at point ($90, 3%), approximately 3 quarters of the way along both lines.Line MD meets line MS2 at point (95, 2), almost half way along both lines.These points of intersection are connected to their respective coordinates on the y-axis using dotted lines.
Refer to Figure 11.3.In the figure above, when the money supply shifts from MS1 to MS2, at the interest rate of 3 percent households and firms will
A)buy Canada bonds.
B)sell Canada bonds.
C)neither buy nor sell Canada bonds.
D)want to hold more money.
E)increase their savings.
Question
Question
Question
Question
Question
Figure 11.2 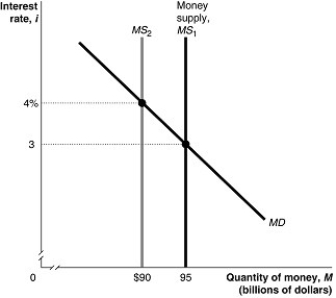 Alt text for Figure 11.2: In figure 11.2, a graph shows shift in money supply.
Long description for Figure 11.2: The x-axis is labelled, quantity of money, M (billions of dollars), with values $90 and 95 marked.The y-axis is labelled, interest rate, i, with values 3 and 4% marked.3 lines are shown; MS1, MS2, and MD.Line MD begins at the top left corner and slopes down toward the end of the x-axis.Line Money supply MS1 is perpendicular to the x-axis, from point 95.Line MS2 is perpendicular to the x-axis, and begins from the value $90, to the left of line MS1.Line MD meets line MS1 at point (95, 3), half way along both lines.Line MD meets line MS2 at point ($90, 4%), approximately 3 quarters of the way along both lines.These points of intersection are connected to their respective coordinates on the y-axis using dotted lines.
Refer to Figure 11.2.In the figure above, when the money supply shifts from MS1 to MS2, at the interest rate of 3 percent households and firms will
A)buy Canada bonds.
B)sell Canada bonds.
C)neither buy nor sell Canada bonds.
D)want to hold less money.
E)increase their purchases of durable goods.
Alt text for Figure 11.2: In figure 11.2, a graph shows shift in money supply.Long description for Figure 11.2: The x-axis is labelled, quantity of money, M (billions of dollars), with values $90 and 95 marked.The y-axis is labelled, interest rate, i, with values 3 and 4% marked.3 lines are shown; MS1, MS2, and MD.Line MD begins at the top left corner and slopes down toward the end of the x-axis.Line Money supply MS1 is perpendicular to the x-axis, from point 95.Line MS2 is perpendicular to the x-axis, and begins from the value $90, to the left of line MS1.Line MD meets line MS1 at point (95, 3), half way along both lines.Line MD meets line MS2 at point ($90, 4%), approximately 3 quarters of the way along both lines.These points of intersection are connected to their respective coordinates on the y-axis using dotted lines.
Refer to Figure 11.2.In the figure above, when the money supply shifts from MS1 to MS2, at the interest rate of 3 percent households and firms will
A)buy Canada bonds.
B)sell Canada bonds.
C)neither buy nor sell Canada bonds.
D)want to hold less money.
E)increase their purchases of durable goods.
Question
Question
Question
Question
Question
Question
Question
Question
Question
Question
Question
Question
Question
Question
Question
Figure 11.4 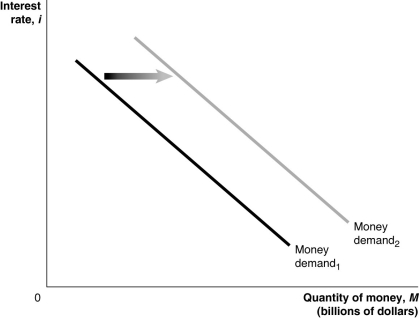 Alt text for Figure 11.4: In figure 11.4, a graph shows shift in money demand curve.
Long description for 11.4: The x-axis is labelled, quantity of money, M (billions of dollars).The y-axis is labelled, interest rate, i.2 lines are shown; Money demand 1 and Money demand 2.Line Money, demand 1, begins in the top left corner and slopes down to the end of the x-axis.Line Money, demand 2, follows the same slope as line Money, demand 1, but is plotted to the right.The area between the lines Money, demand 1, and Money, demand 2, is indicated by a right pointing arrow.
Refer to Figure 11.4.In the figure above, the money demand curve would move from Money demand1 to Money demand2 if
A)real GDP decreased.
B)the price level increased.
C)the interest rate increased.
D)the Bank of Canada sold government securities.
E)households expected lower incomes in the future.
Alt text for Figure 11.4: In figure 11.4, a graph shows shift in money demand curve.Long description for 11.4: The x-axis is labelled, quantity of money, M (billions of dollars).The y-axis is labelled, interest rate, i.2 lines are shown; Money demand 1 and Money demand 2.Line Money, demand 1, begins in the top left corner and slopes down to the end of the x-axis.Line Money, demand 2, follows the same slope as line Money, demand 1, but is plotted to the right.The area between the lines Money, demand 1, and Money, demand 2, is indicated by a right pointing arrow.
Refer to Figure 11.4.In the figure above, the money demand curve would move from Money demand1 to Money demand2 if
A)real GDP decreased.
B)the price level increased.
C)the interest rate increased.
D)the Bank of Canada sold government securities.
E)households expected lower incomes in the future.
Question
Question
Question
Question
Question
Question
Question
Figure 11.5 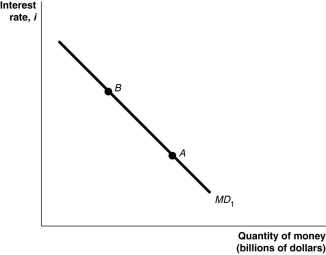 Alt text for Figure 11.5: In figure 11.5, a graph shows movement in money demand curve.
Long description for Figure 11.5: The x-axis is labelled, quantity of money, M (billions of dollars).The y-axis is labelled, interest rate, i.Line MD1 begins in the top left corner and slopes down to the bottom center.Points A and B are marked along line MD1.Point A is close to the bottom of the line, and point B is close to the top of the line.
Refer to Figure 11.5.In the figure above, a movement from point A to point B would be caused by
A)a decrease in real GDP.
B)an increase in the price level.
C)a decrease in the price level.
D)an increase in the interest rate.
E)a decrease in the interest rate.
Alt text for Figure 11.5: In figure 11.5, a graph shows movement in money demand curve.Long description for Figure 11.5: The x-axis is labelled, quantity of money, M (billions of dollars).The y-axis is labelled, interest rate, i.Line MD1 begins in the top left corner and slopes down to the bottom center.Points A and B are marked along line MD1.Point A is close to the bottom of the line, and point B is close to the top of the line.
Refer to Figure 11.5.In the figure above, a movement from point A to point B would be caused by
A)a decrease in real GDP.
B)an increase in the price level.
C)a decrease in the price level.
D)an increase in the interest rate.
E)a decrease in the interest rate.
Question
Question
Question
Question
Question
Question
Figure 11.7 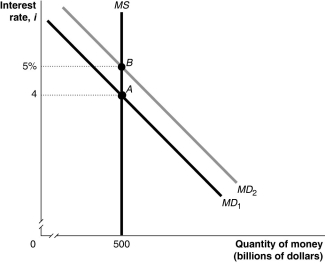 Alt text for Figure 11.7: In figure 11.7, a graph shows movement in the money market.
Long description for Figure 11.7: The x-axis is labelled, quantity of money, M (billions of dollars), with value 500 marked.The y-axis is labelled, interest rate, i, with values 4 and 5% marked.3 lines are shown; MD1, MD2, and MS.Line MD1 begins in the top left corner and slopes down to the end of the x-axis.Line MD2 follows the same slope as line MD1, but is plotted to the right.Line MS is perpendicular to the x-axis, and begins from the value 500.Line MD1 meets line MS at point A (500, 4), a little more than half way along both lines.Line MD2 meets line MS at point B (500, 5%), approximately 3 quarters of the way along both lines.These points of intersection are connected to their respective coordinates on the y-axis using dotted lines.
Refer to Figure 11.7.In the figure above, the movement from point A to point B in the money market would be caused by
A)an increase in the price level.
B)a decrease in real GDP.
C)an open market sale of Canada bonds by the Bank of Canada.
D)an increase in the desired reserve ratio by commercial banks.
E)the Bank of Canada making more loans to commercial banks.
Alt text for Figure 11.7: In figure 11.7, a graph shows movement in the money market.Long description for Figure 11.7: The x-axis is labelled, quantity of money, M (billions of dollars), with value 500 marked.The y-axis is labelled, interest rate, i, with values 4 and 5% marked.3 lines are shown; MD1, MD2, and MS.Line MD1 begins in the top left corner and slopes down to the end of the x-axis.Line MD2 follows the same slope as line MD1, but is plotted to the right.Line MS is perpendicular to the x-axis, and begins from the value 500.Line MD1 meets line MS at point A (500, 4), a little more than half way along both lines.Line MD2 meets line MS at point B (500, 5%), approximately 3 quarters of the way along both lines.These points of intersection are connected to their respective coordinates on the y-axis using dotted lines.
Refer to Figure 11.7.In the figure above, the movement from point A to point B in the money market would be caused by
A)an increase in the price level.
B)a decrease in real GDP.
C)an open market sale of Canada bonds by the Bank of Canada.
D)an increase in the desired reserve ratio by commercial banks.
E)the Bank of Canada making more loans to commercial banks.
Question
Figure 11.6 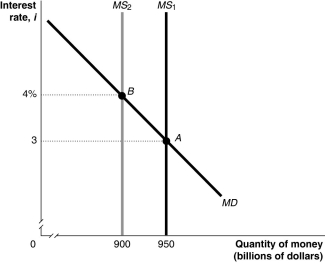 Alt text for Figure 11.6: In figure 11.6, a graph shows movement in the money market.
Long description for Figure 11.6: The x-axis is labelled, quantity of money, M (billions of dollars), with values 900 and 950 marked.The y-axis is labelled, interest rate, i, with values 3 and 4% marked.3 lines are shown; MS1, MS2, and MD.Line MD begins in the top left corner and slopes down to the end of the x-axis.Line MS1 is perpendicular to the x-axis, and begins from the value 950.Line MS2 is perpendicular to the x-axis, and begins from the value 900, to the left of line MS1.Line MD intersects line MS1 at point A (950, 3), approximately 3 quarters of the way along both lines.Line MD meets line MS2 at point B (900, 4%), more than half way along both lines.These points of intersection are connected to their respective coordinates on the y-axis using dotted lines.
Refer to Figure 11.6.In the figure above, the movement from point A to point B in the money market would be caused by
A)an increase in the price level.
B)a decrease in real GDP.
C)an open market sale of Canada bonds by the Bank of Canada.
D)a decrease in the desired reserve ratio by commercial banks.
E)an increase in the willingness of commercial banks to make risky loans.
Alt text for Figure 11.6: In figure 11.6, a graph shows movement in the money market.Long description for Figure 11.6: The x-axis is labelled, quantity of money, M (billions of dollars), with values 900 and 950 marked.The y-axis is labelled, interest rate, i, with values 3 and 4% marked.3 lines are shown; MS1, MS2, and MD.Line MD begins in the top left corner and slopes down to the end of the x-axis.Line MS1 is perpendicular to the x-axis, and begins from the value 950.Line MS2 is perpendicular to the x-axis, and begins from the value 900, to the left of line MS1.Line MD intersects line MS1 at point A (950, 3), approximately 3 quarters of the way along both lines.Line MD meets line MS2 at point B (900, 4%), more than half way along both lines.These points of intersection are connected to their respective coordinates on the y-axis using dotted lines.
Refer to Figure 11.6.In the figure above, the movement from point A to point B in the money market would be caused by
A)an increase in the price level.
B)a decrease in real GDP.
C)an open market sale of Canada bonds by the Bank of Canada.
D)a decrease in the desired reserve ratio by commercial banks.
E)an increase in the willingness of commercial banks to make risky loans.
Question

Unlock Deck
Sign up to unlock the cards in this deck!
Unlock Deck
Unlock Deck
1/281
Play
Full screen (f)
Deck 11: Monetary Policy
1
One of the monetary policy goals of the Bank of Canada is price stability.
True
2
The turmoil in financial markets that began in 2007 led the Bank of Canada to put new emphasis on
A)fighting inflation.
B)increasing employment.
C)increasing economic growth.
D)increasing regulation of commercial banks.
E)increasing financial market stability.
A)fighting inflation.
B)increasing employment.
C)increasing economic growth.
D)increasing regulation of commercial banks.
E)increasing financial market stability.
increasing financial market stability.
3
Monetary policy is conducted by the federal Department of Finance.
False
4
The Bank of Canada focuses on which of the following as their main goal of monetary policy?
A)high employment
B)price stability
C)economic growth
D)stability of financial markets
E)balanced budgets
A)high employment
B)price stability
C)economic growth
D)stability of financial markets
E)balanced budgets
Unlock Deck
Unlock for access to all 281 flashcards in this deck.
Unlock Deck
k this deck
5
What is a symmetric inflation targeting, and what does it mean for the Bank of Canada?
Unlock Deck
Unlock for access to all 281 flashcards in this deck.
Unlock Deck
k this deck
6
Monetary policy refers to the actions the Bank of Canada takes to manage
A)the money supply and income tax rates to pursue its economic objectives.
B)the money supply and interest rates to pursue its economic objectives.
C)income tax rates and interest rates to pursue its economic objectives.
D)government spending and income tax rates to pursue its economic objectives.
E)the money supply to meet its budgetary objectives.
Unlock Deck
Unlock for access to all 281 flashcards in this deck.
Unlock Deck
k this deck
7
Monetary policy refers to the actions the
A)Prime Minister and Parliament take to manage the money supply and interest rates to pursue their economic objectives.
B)Bank of Canada takes to manage the money supply and interest rates to pursue its macroeconomic policy objectives.
C)Prime Minister and Parliament take to manage government spending and taxes to pursue their economic objectives.
D)Bank of Canada takes to manage government spending and taxes to pursue its economic objectives.
E)Commercial bank decisions determining when and to whom to make loans.
Unlock Deck
Unlock for access to all 281 flashcards in this deck.
Unlock Deck
k this deck
8
The Bank of Canada does not regulate financial institutions, but it does act as the "lender of last resort" by lending to commercial banks when they are temporarily short of funds.The goal of the Bank of Canada filling this role is to
A)reduce the rate of inflation.
B)stimulate economic growth.
C)reduce unemployment.
D)reassure financial markets and promote financial stability.
E)reduce the current account deficit.
A)reduce the rate of inflation.
B)stimulate economic growth.
C)reduce unemployment.
D)reassure financial markets and promote financial stability.
E)reduce the current account deficit.
Unlock Deck
Unlock for access to all 281 flashcards in this deck.
Unlock Deck
k this deck
9
Central banks around the world have pursued historically low interest rates in an effort to
A)redistribute wealth from lenders to borrowers.
B)reduce government interest payment on past borrowing thus allowing more to be spent on social programs.
C)provide governments with a justification for running large budget deficits.
D)to encourage consumers to spend more and thus shift aggregate demand to the right.
E)to reduce the incomes of capitalists.
Unlock Deck
Unlock for access to all 281 flashcards in this deck.
Unlock Deck
k this deck
10
The Bank of Canada system's four monetary policy goals are
A)low government budget deficits, low current account deficits, high employment, and a high foreign exchange value of the dollar.
B)rate of bank failures, high reserve ratios, price stability, and economic growth.
C)price stability, high employment, economic growth, and stability of financial markets and institutions.
D)price stability, low government budget deficits, low current account deficits, and low rate of bank failures.
E)price stability, high levels of retirement savings, economic growth, and financial market stability.
Unlock Deck
Unlock for access to all 281 flashcards in this deck.
Unlock Deck
k this deck
11
If the probability of losing your job remains ________, a recession would be a good time to purchase a home because the Bank of Canada usually ________ interest rates during this time.
A)low; lowers
B)low; raises
C)high; lowers
D)high; raises
E)low; does not change
A)low; lowers
B)low; raises
C)high; lowers
D)high; raises
E)low; does not change
Unlock Deck
Unlock for access to all 281 flashcards in this deck.
Unlock Deck
k this deck
12
The main goal of monetary policy for the Bank of Canada recently has been to maintain high employment in labour markets.
Unlock Deck
Unlock for access to all 281 flashcards in this deck.
Unlock Deck
k this deck
13
Since World War II, the Bank of Canada has not been involved in carrying out monetary policy.
Unlock Deck
Unlock for access to all 281 flashcards in this deck.
Unlock Deck
k this deck
14
When the Bank of Canada Act was passed in 1934, it was stated that the main responsibility is to conduct monetary policy to
A)prevent bank panics.
B)promote price stability.
C)promote the best interests of economic life of Canada.
D)keep employment high.
E)promote good governance in Canada.
A)prevent bank panics.
B)promote price stability.
C)promote the best interests of economic life of Canada.
D)keep employment high.
E)promote good governance in Canada.
Unlock Deck
Unlock for access to all 281 flashcards in this deck.
Unlock Deck
k this deck
15
Which of the following are goals of monetary policy?
A)maximizing the value of the dollar relative to other currencies, economic growth, and high employment
B)price stability, maximizing the value of the dollar relative to other currencies, and high employment
C)price stability, economic growth, and high employment
D)price stability, economic growth, and maximizing the value of the dollar relative to other currencies
E)price stability, high employment, economic growth, and encourage financial literacy
Unlock Deck
Unlock for access to all 281 flashcards in this deck.
Unlock Deck
k this deck
16
The Bank of Canada seeks to promote stability of financial markets because
A)they want to lift the self-esteem of workers.
B)it was a principle mandated in the Royal Commission of 1933, which directly led to the founding of the Bank of Canada.
C)resources are lost when there is not efficient matching of savers and borrowers.
D)unstable markets result in increased efficiency.
E)stable financial markets are key to growing concentrations of wealth.
Unlock Deck
Unlock for access to all 281 flashcards in this deck.
Unlock Deck
k this deck
17
Why would businesses watch the bank of Canada for signs of changing interest rates?
A)Changes in the Bank of Canada's key policy rate determine the cost of the labour.
B)Many consumers borrow heavily to finance durable products, sales of these goods are likely to rise when the Bank of Canada lowers the interest rate.
C)Changes in Bank of Canada policy determine the federal income tax rate.
D)Changes in the Bank of Canada's key policy rate are good indicators of federal government spending decisions.
E)Many consumers base their expectations of future income on the Bank of Canada's policy announcements.
Unlock Deck
Unlock for access to all 281 flashcards in this deck.
Unlock Deck
k this deck
18
Inflation rates during the years 1979-1981 were the highest Canada has ever experienced post-1950.
Unlock Deck
Unlock for access to all 281 flashcards in this deck.
Unlock Deck
k this deck
19
List the Bank of Canada's four main monetary goals.
Unlock Deck
Unlock for access to all 281 flashcards in this deck.
Unlock Deck
k this deck
20
The goals of monetary policy tend to be interrelated.For example, when the Bank of Canada pursues the goal of ________, it also can achieve the goal of ________ simultaneously.
A)high employment; economic growth
B)high employment; lowering government spending
C)economic growth; a low current account deficit
D)stability of financial markets; a low current account deficit
E)price stability; low budget deficits
A)high employment; economic growth
B)high employment; lowering government spending
C)economic growth; a low current account deficit
D)stability of financial markets; a low current account deficit
E)price stability; low budget deficits
Unlock Deck
Unlock for access to all 281 flashcards in this deck.
Unlock Deck
k this deck
21
An increase in the price level causes
A)the money demand curve to shift to the left.
B)the money demand curve to shift to the right.
C)a movement up along the money demand curve.
D)a movement down along the money demand curve.
E)the money demand curve to become steeper.
A)the money demand curve to shift to the left.
B)the money demand curve to shift to the right.
C)a movement up along the money demand curve.
D)a movement down along the money demand curve.
E)the money demand curve to become steeper.
Unlock Deck
Unlock for access to all 281 flashcards in this deck.
Unlock Deck
k this deck
22
The Bank of Canada can directly affect its monetary policy ________, which then affect its monetary policy ________.
A)goals; targets
B)goals; tools
C)targets; goals
D)targets; tools
E)goals; levers
A)goals; targets
B)goals; tools
C)targets; goals
D)targets; tools
E)goals; levers
Unlock Deck
Unlock for access to all 281 flashcards in this deck.
Unlock Deck
k this deck
23
An increase in real GDP can shift
A)money demand to the right and decrease the equilibrium interest rate.
B)money demand to the right and increase the equilibrium interest rate.
C)money demand to the left and decrease the equilibrium interest rate.
D)money demand to the left and increase the equilibrium interest rate.
E)money demand to the right and leave the equilibrium interest rate unchanged.
Unlock Deck
Unlock for access to all 281 flashcards in this deck.
Unlock Deck
k this deck
24
The money demand curve has a
A)negative slope because an increase in the interest rate decreases the quantity of money demanded.
B)positive slope because an increase in the interest rate increases the quantity of money demanded.
C)negative slope because an increase in the price level decreases the quantity of money demanded.
D)positive slope because an increase in the price level increases the quantity of money demanded.
E)positive slope because an increase in the interest rate increases the value of future savings.
Unlock Deck
Unlock for access to all 281 flashcards in this deck.
Unlock Deck
k this deck
25
Which of the following will lead to a decrease in the equilibrium interest rate in the economy?
A)an increase in the price level
B)a sale of government of Canada securities by the Bank of Canada
C)a decrease in GDP
D)an increase in the discount rate
E)an increase in the reserve requirement
A)an increase in the price level
B)a sale of government of Canada securities by the Bank of Canada
C)a decrease in GDP
D)an increase in the discount rate
E)an increase in the reserve requirement
Unlock Deck
Unlock for access to all 281 flashcards in this deck.
Unlock Deck
k this deck
26
Maintaining a strong dollar in international currency markets is not one of the four monetary policy goals of the Bank of Canada listed in the textbook.
Unlock Deck
Unlock for access to all 281 flashcards in this deck.
Unlock Deck
k this deck
27
When the Bank of Canada decreases the money supply, at the previous equilibrium interest rate households and firms will now want to
A)buy government of Canada securities.
B)sell government of Canada securities.
C)neither buy nor sell government of Canada securities.
D)hold less money.
E)increase their purchases of durable goods.
A)buy government of Canada securities.
B)sell government of Canada securities.
C)neither buy nor sell government of Canada securities.
D)hold less money.
E)increase their purchases of durable goods.
Unlock Deck
Unlock for access to all 281 flashcards in this deck.
Unlock Deck
k this deck
28
An increase in the demand for government of Canada securities will
A)increase the price of government of Canada securities.
B)increase the interest rate on government of Canada securities.
C)increase the opportunity cost of holding money vs.government of Canada securities.
D)eventually cause households to hold less money.
E)an increase in government debt.
A)increase the price of government of Canada securities.
B)increase the interest rate on government of Canada securities.
C)increase the opportunity cost of holding money vs.government of Canada securities.
D)eventually cause households to hold less money.
E)an increase in government debt.
Unlock Deck
Unlock for access to all 281 flashcards in this deck.
Unlock Deck
k this deck
29
Figure 11.1 Alt text for Figure 11.1: In figure 11.1, a graph shows shift in the money demand curve.
Long description for Figure 11.1: The x-axis is labelled, quantity of money, M (billions of dollars).The y-axis is labelled, interest rate, i.2 lines are shown; MD1 and MD2.Line MD1 begins in the top left corner and slopes down to the end of the x-axis.Line MD2 follows the same slope as line MD1, but is plotted to the right.
Refer to Figure 11.1.In the figure, the money demand curve would move from MD1 to MD2 if
A)real GDP increased.
B)the price level decreased.
C)the interest rate increased.
D)the Bank of Canada sold government of Canada securities.
E)population fell.
Alt text for Figure 11.1: In figure 11.1, a graph shows shift in the money demand curve.Long description for Figure 11.1: The x-axis is labelled, quantity of money, M (billions of dollars).The y-axis is labelled, interest rate, i.2 lines are shown; MD1 and MD2.Line MD1 begins in the top left corner and slopes down to the end of the x-axis.Line MD2 follows the same slope as line MD1, but is plotted to the right.
Refer to Figure 11.1.In the figure, the money demand curve would move from MD1 to MD2 if
A)real GDP increased.
B)the price level decreased.
C)the interest rate increased.
D)the Bank of Canada sold government of Canada securities.
E)population fell.
Unlock Deck
Unlock for access to all 281 flashcards in this deck.
Unlock Deck
k this deck
30
Using the money demand and money supply model, an increase in money demand would cause the equilibrium interest rate to
A)increase.
B)decrease.
C)not change.
D)increase, then decrease.
A)increase.
B)decrease.
C)not change.
D)increase, then decrease.
Unlock Deck
Unlock for access to all 281 flashcards in this deck.
Unlock Deck
k this deck
31
An increase in the interest rate causes
A)a movement up along the money demand curve.
B)a movement down along the money demand curve.
C)the money demand curve to shift to the left.
D)the money demand curve to shift to the right.
E)the money demand curve to become steeper.
A)a movement up along the money demand curve.
B)a movement down along the money demand curve.
C)the money demand curve to shift to the left.
D)the money demand curve to shift to the right.
E)the money demand curve to become steeper.
Unlock Deck
Unlock for access to all 281 flashcards in this deck.
Unlock Deck
k this deck
32
An increase in the interest rate
A)decreases the opportunity cost of holding money.
B)increases the opportunity cost of holding money.
C)decreases the percentage yield of holding money.
D)increases the percentage yield of holding money.
E)increases the value of alternative assets.
A)decreases the opportunity cost of holding money.
B)increases the opportunity cost of holding money.
C)decreases the percentage yield of holding money.
D)increases the percentage yield of holding money.
E)increases the value of alternative assets.
Unlock Deck
Unlock for access to all 281 flashcards in this deck.
Unlock Deck
k this deck
33
Suppose that households became mistrustful of the banking system and decide to decrease their chequing accounts and increase their holdings of currency.Using the money demand and money supply model and assuming everything else is held constant, the equilibrium interest rate should
A)increase.
B)decrease.
C)not change.
D)increase, then decrease.
A)increase.
B)decrease.
C)not change.
D)increase, then decrease.
Unlock Deck
Unlock for access to all 281 flashcards in this deck.
Unlock Deck
k this deck
34
When the Bank of Canada increases the money supply, at the previous equilibrium interest rate households and firms will now have
A)more money than they want to hold.
B)less money than they want to hold.
C)the amount of money that they want to hold.
D)to sell Treasury bills.
E)increased purchasing power.
A)more money than they want to hold.
B)less money than they want to hold.
C)the amount of money that they want to hold.
D)to sell Treasury bills.
E)increased purchasing power.
Unlock Deck
Unlock for access to all 281 flashcards in this deck.
Unlock Deck
k this deck
35
Using the money demand and money supply model, an open market sale of government of Canada securities by the Bank of Canada would cause the equilibrium interest rate to
A)increase.
B)decrease.
C)not change.
D)increase, then decrease.
A)increase.
B)decrease.
C)not change.
D)increase, then decrease.
Unlock Deck
Unlock for access to all 281 flashcards in this deck.
Unlock Deck
k this deck
36
Given that it does not regulate financial institutions, how does the Bank of Canada promote stability of financial markets and institutions?
Unlock Deck
Unlock for access to all 281 flashcards in this deck.
Unlock Deck
k this deck
37
What problems can high inflation rates cause for the economy?
Unlock Deck
Unlock for access to all 281 flashcards in this deck.
Unlock Deck
k this deck
38
The Bank of Canada's two main ________ are the money supply and the interest rate.
A)monetary policy targets
B)policy tools
C)fiscal policy targets
D)fiscal tools
E)monetary policy goals
A)monetary policy targets
B)policy tools
C)fiscal policy targets
D)fiscal tools
E)monetary policy goals
Unlock Deck
Unlock for access to all 281 flashcards in this deck.
Unlock Deck
k this deck
39
Which of the following would cause the money demand curve to shift to the left?
A)an open market purchase of Government of Canada securities by the Bank of Canada
B)an increase in the interest rate
C)an increase in the price level
D)a decrease in real GDP
E)a growing population
A)an open market purchase of Government of Canada securities by the Bank of Canada
B)an increase in the interest rate
C)an increase in the price level
D)a decrease in real GDP
E)a growing population
Unlock Deck
Unlock for access to all 281 flashcards in this deck.
Unlock Deck
k this deck
40
Using the money demand and money supply model, an open market purchase of government of Canada securities by the Bank of Canada would cause the equilibrium interest rate to
A)increase.
B)decrease.
C)not change.
D)increase if the economy is in a recession.
A)increase.
B)decrease.
C)not change.
D)increase if the economy is in a recession.
Unlock Deck
Unlock for access to all 281 flashcards in this deck.
Unlock Deck
k this deck
41
If the Bank of Canada raises the overnight interest rate, this will ________ inflation and ________ real GDP in the short run.
A)reduce; raise
B)increase; lower
C)increase; raise
D)reduce; lower
A)reduce; raise
B)increase; lower
C)increase; raise
D)reduce; lower
Unlock Deck
Unlock for access to all 281 flashcards in this deck.
Unlock Deck
k this deck
42
Use the money demand and money supply model to show graphically and explain the effect on interest rates of the Bank of Canada's open market sale of government of Canada securities.
Unlock Deck
Unlock for access to all 281 flashcards in this deck.
Unlock Deck
k this deck
43
Use the money demand and money supply model to show graphically and briefly explain the effect on the interest rate if real GDP increases.
Unlock Deck
Unlock for access to all 281 flashcards in this deck.
Unlock Deck
k this deck
44
For purposes of monetary policy, the Bank of Canada has targeted the interest rate known as the
A)overnight interest rate.
B)Canada bond rate.
C)discount rate.
D)prime rate.
E)5 year fixed mortgage rate.
A)overnight interest rate.
B)Canada bond rate.
C)discount rate.
D)prime rate.
E)5 year fixed mortgage rate.
Unlock Deck
Unlock for access to all 281 flashcards in this deck.
Unlock Deck
k this deck
45
Figure 11.3 Alt text for Figure 11.3: In figure 11.3, a graph shows shift in money supply.
Long description for Figure 11.3: The x-axis is labelled, quantity of money, M (billions of dollars), with values $90 and 95 marked.The y-axis is labelled, interest rate, i, with values 2 and 3% marked.3 lines are shown; MS1, MS2, and MD.Line MD begins in the top left corner and slopes down to the end of the x-axis.Line Money, supply MS1, is perpendicular to the x-axis, and begins from the value $90.Line MS2 is perpendicular to the x-axis, and begins from the value 95, to the right of line MS1.Line MD meets line MS1 at point ($90, 3%), approximately 3 quarters of the way along both lines.Line MD meets line MS2 at point (95, 2), almost half way along both lines.These points of intersection are connected to their respective coordinates on the y-axis using dotted lines.
Refer to Figure 11.3.In the figure above, when the money supply shifts from MS1 to MS2, at the interest rate of 3 percent households and firms will
A)buy Canada bonds.
B)sell Canada bonds.
C)neither buy nor sell Canada bonds.
D)want to hold more money.
E)increase their savings.
Alt text for Figure 11.3: In figure 11.3, a graph shows shift in money supply.Long description for Figure 11.3: The x-axis is labelled, quantity of money, M (billions of dollars), with values $90 and 95 marked.The y-axis is labelled, interest rate, i, with values 2 and 3% marked.3 lines are shown; MS1, MS2, and MD.Line MD begins in the top left corner and slopes down to the end of the x-axis.Line Money, supply MS1, is perpendicular to the x-axis, and begins from the value $90.Line MS2 is perpendicular to the x-axis, and begins from the value 95, to the right of line MS1.Line MD meets line MS1 at point ($90, 3%), approximately 3 quarters of the way along both lines.Line MD meets line MS2 at point (95, 2), almost half way along both lines.These points of intersection are connected to their respective coordinates on the y-axis using dotted lines.
Refer to Figure 11.3.In the figure above, when the money supply shifts from MS1 to MS2, at the interest rate of 3 percent households and firms will
A)buy Canada bonds.
B)sell Canada bonds.
C)neither buy nor sell Canada bonds.
D)want to hold more money.
E)increase their savings.
Unlock Deck
Unlock for access to all 281 flashcards in this deck.
Unlock Deck
k this deck
46
A monetary policy target is a variable that
A)the Bank of Canada can affect directly.
B)equals one of the Bank of Canada's main policy goals.
C)the Bank of Canada has no ability to change.
D)the Bank of Canada cannot affect directly.
E)the Bank of Canada can influence only with the help of the federal government.
A)the Bank of Canada can affect directly.
B)equals one of the Bank of Canada's main policy goals.
C)the Bank of Canada has no ability to change.
D)the Bank of Canada cannot affect directly.
E)the Bank of Canada can influence only with the help of the federal government.
Unlock Deck
Unlock for access to all 281 flashcards in this deck.
Unlock Deck
k this deck
47
A monetary policy target is a variable that the Bank of Canada can affect directly, which then affects one or more of the Bank of Canada's policy goals.
Unlock Deck
Unlock for access to all 281 flashcards in this deck.
Unlock Deck
k this deck
48
Does the money demand curve have a positive slope or a negative slope? Why does it have this slope? Explain why an increase in the variable on the vertical axis of the money demand curve causes either an increase or a decrease in the variable on the horizontal axis of the money demand curve.
Unlock Deck
Unlock for access to all 281 flashcards in this deck.
Unlock Deck
k this deck
49
The Bank of Canada can simultaneously reduce the inflation rate and stimulate growth through lowering interest rates.
Unlock Deck
Unlock for access to all 281 flashcards in this deck.
Unlock Deck
k this deck
50
Figure 11.2 Alt text for Figure 11.2: In figure 11.2, a graph shows shift in money supply.
Long description for Figure 11.2: The x-axis is labelled, quantity of money, M (billions of dollars), with values $90 and 95 marked.The y-axis is labelled, interest rate, i, with values 3 and 4% marked.3 lines are shown; MS1, MS2, and MD.Line MD begins at the top left corner and slopes down toward the end of the x-axis.Line Money supply MS1 is perpendicular to the x-axis, from point 95.Line MS2 is perpendicular to the x-axis, and begins from the value $90, to the left of line MS1.Line MD meets line MS1 at point (95, 3), half way along both lines.Line MD meets line MS2 at point ($90, 4%), approximately 3 quarters of the way along both lines.These points of intersection are connected to their respective coordinates on the y-axis using dotted lines.
Refer to Figure 11.2.In the figure above, when the money supply shifts from MS1 to MS2, at the interest rate of 3 percent households and firms will
A)buy Canada bonds.
B)sell Canada bonds.
C)neither buy nor sell Canada bonds.
D)want to hold less money.
E)increase their purchases of durable goods.
Alt text for Figure 11.2: In figure 11.2, a graph shows shift in money supply.Long description for Figure 11.2: The x-axis is labelled, quantity of money, M (billions of dollars), with values $90 and 95 marked.The y-axis is labelled, interest rate, i, with values 3 and 4% marked.3 lines are shown; MS1, MS2, and MD.Line MD begins at the top left corner and slopes down toward the end of the x-axis.Line Money supply MS1 is perpendicular to the x-axis, from point 95.Line MS2 is perpendicular to the x-axis, and begins from the value $90, to the left of line MS1.Line MD meets line MS1 at point (95, 3), half way along both lines.Line MD meets line MS2 at point ($90, 4%), approximately 3 quarters of the way along both lines.These points of intersection are connected to their respective coordinates on the y-axis using dotted lines.
Refer to Figure 11.2.In the figure above, when the money supply shifts from MS1 to MS2, at the interest rate of 3 percent households and firms will
A)buy Canada bonds.
B)sell Canada bonds.
C)neither buy nor sell Canada bonds.
D)want to hold less money.
E)increase their purchases of durable goods.
Unlock Deck
Unlock for access to all 281 flashcards in this deck.
Unlock Deck
k this deck
51
The Bank of Canada's two main monetary policy targets are
A)the money supply and the inflation rate.
B)the money supply and the interest rate.
C)the interest rate and real GDP.
D)the inflation rate and financial market stability.
E)the inflation rate and real GDP growth.
A)the money supply and the inflation rate.
B)the money supply and the interest rate.
C)the interest rate and real GDP.
D)the inflation rate and financial market stability.
E)the inflation rate and real GDP growth.
Unlock Deck
Unlock for access to all 281 flashcards in this deck.
Unlock Deck
k this deck
52
The monetary policy target the Bank of Canada focuses primarily on today is
A)the unemployment rate.
B)M1.
C)the inflation rate.
D)the overnight interest rate.
E)M2.
A)the unemployment rate.
B)M1.
C)the inflation rate.
D)the overnight interest rate.
E)M2.
Unlock Deck
Unlock for access to all 281 flashcards in this deck.
Unlock Deck
k this deck
53
The Bank of Canada can directly lower the inflation rate.
Unlock Deck
Unlock for access to all 281 flashcards in this deck.
Unlock Deck
k this deck
54
Changes in the overnight interest rate usually result in
A)changes in both short-term and long-term interest rates with more of an effect on short-term interest rates.
B)changes in both short-term and long-term interest rates with more of an effect on long-term interest rates.
C)changes in both short-term and long-term interest rates with equal effect on both.
D)no change in both short-term and long-term interest rates.
E)changes in the short-term real interest rate but not the short-term nominal interest rate.
Unlock Deck
Unlock for access to all 281 flashcards in this deck.
Unlock Deck
k this deck
55
The money demand curve has a negative slope because
A)lower interest rates cause households and firms to switch from money to financial assets.
B)lower interest rates cause households and firms to switch from financial assets to money.
C)lower interest rates cause households and firms to switch from money to stocks.
D)lower interest rates cause households and firms to switch from money to bonds.
E)lower interest rates cause households and firms to take more risks.
Unlock Deck
Unlock for access to all 281 flashcards in this deck.
Unlock Deck
k this deck
56
Which of the following is true?
A)The money market model is essentially a model that determines the short-term nominal rate of interest.
B)The money market model is essentially a model that determines the short-term real rate of interest.
C)The loanable funds model is essentially a model that determines the short-term real rate of interest.
D)The loanable funds model is essentially a model that determines the long-term nominal rate of interest.
E)The money market model is essentially a model that determines the long-term nominal rate of interest.
Unlock Deck
Unlock for access to all 281 flashcards in this deck.
Unlock Deck
k this deck
57
The Bank of Canada can increase the overnight interest rate by
A)selling Canada bonds, which increases bank reserves.
B)buying Canada bonds, which increases bank reserves.
C)selling Canada bonds, which decreases bank reserves.
D)buying Canada bonds, which decreases bank reserves.
A)selling Canada bonds, which increases bank reserves.
B)buying Canada bonds, which increases bank reserves.
C)selling Canada bonds, which decreases bank reserves.
D)buying Canada bonds, which decreases bank reserves.
Unlock Deck
Unlock for access to all 281 flashcards in this deck.
Unlock Deck
k this deck
58
The interest rate that banks charge other banks for overnight loans is the
A)prime rate.
B)discount rate.
C)overnight interest rate.
D)Canada bond rate.
A)prime rate.
B)discount rate.
C)overnight interest rate.
D)Canada bond rate.
Unlock Deck
Unlock for access to all 281 flashcards in this deck.
Unlock Deck
k this deck
59
Use the money demand and money supply model to show the money market in equilibrium with an interest rate of 5 percent and the quantity of money of $80 billion.Suppose the Bank of Canada increases the money supply to $85 billion.At the previous equilibrium interest rate of 5 percent, will households and firms now be holding more money or less money than they want to hold, and will they be buying or selling short-term financial assets? At the new equilibrium interest rate, households and firms will desire to hold the entire $85 billion of the money supply.What causes households and firms to want to hold the additional $5 billion of the money supply?
Unlock Deck
Unlock for access to all 281 flashcards in this deck.
Unlock Deck
k this deck
60
The money demand curve, against possible levels of interest rates, has a
A)positive slope.
B)negative slope.
C)zero slope.
D)an infinite slope.
E)positive slope for low levels of money demand, and a negative slope for high levels of money demand.
A)positive slope.
B)negative slope.
C)zero slope.
D)an infinite slope.
E)positive slope for low levels of money demand, and a negative slope for high levels of money demand.
Unlock Deck
Unlock for access to all 281 flashcards in this deck.
Unlock Deck
k this deck
61
A decrease in real GDP can
A)shift money demand to the right and decrease the interest rate.
B)shift money demand to the right and increase the interest rate.
C)shift money demand to the left and decrease the interest rate.
D)shift money demand to the left and increase the interest rate.
E)cause the money demand curve to become steeper and increase the interest rate.
Unlock Deck
Unlock for access to all 281 flashcards in this deck.
Unlock Deck
k this deck
62
The money market model is concerned with ________ and the loanable funds market model is concerned with ________.
A)short-term real interest rates; long-term nominal interest rates
B)long-term nominal interest rates; long-term real interest rates
C)short-term real interest rates; long-term real interest rates
D)short-term nominal interest rates; long-term real interest rates
E)long-term real interest rates; long-term nominal interest rates
Unlock Deck
Unlock for access to all 281 flashcards in this deck.
Unlock Deck
k this deck
63
Increases in the price level
A)increase the opportunity cost of holding money.
B)decrease the opportunity cost of holding money.
C)increase the quantity of money needed for buying and selling.
D)decrease the quantity of money needed for buying and selling.
E)decreases the quantity of money needed as a unit of account.
A)increase the opportunity cost of holding money.
B)decrease the opportunity cost of holding money.
C)increase the quantity of money needed for buying and selling.
D)decrease the quantity of money needed for buying and selling.
E)decreases the quantity of money needed as a unit of account.
Unlock Deck
Unlock for access to all 281 flashcards in this deck.
Unlock Deck
k this deck
64
Suppose the Bank of Canada decreases the money supply.In response, households and firms will ________ short term assets and this will drive ________ interest rates.
A)buy; up
B)buy; down
C)sell; up
D)sell; down
A)buy; up
B)buy; down
C)sell; up
D)sell; down
Unlock Deck
Unlock for access to all 281 flashcards in this deck.
Unlock Deck
k this deck
65
Figure 11.4 Alt text for Figure 11.4: In figure 11.4, a graph shows shift in money demand curve.
Long description for 11.4: The x-axis is labelled, quantity of money, M (billions of dollars).The y-axis is labelled, interest rate, i.2 lines are shown; Money demand 1 and Money demand 2.Line Money, demand 1, begins in the top left corner and slopes down to the end of the x-axis.Line Money, demand 2, follows the same slope as line Money, demand 1, but is plotted to the right.The area between the lines Money, demand 1, and Money, demand 2, is indicated by a right pointing arrow.
Refer to Figure 11.4.In the figure above, the money demand curve would move from Money demand1 to Money demand2 if
A)real GDP decreased.
B)the price level increased.
C)the interest rate increased.
D)the Bank of Canada sold government securities.
E)households expected lower incomes in the future.
Alt text for Figure 11.4: In figure 11.4, a graph shows shift in money demand curve.Long description for 11.4: The x-axis is labelled, quantity of money, M (billions of dollars).The y-axis is labelled, interest rate, i.2 lines are shown; Money demand 1 and Money demand 2.Line Money, demand 1, begins in the top left corner and slopes down to the end of the x-axis.Line Money, demand 2, follows the same slope as line Money, demand 1, but is plotted to the right.The area between the lines Money, demand 1, and Money, demand 2, is indicated by a right pointing arrow.
Refer to Figure 11.4.In the figure above, the money demand curve would move from Money demand1 to Money demand2 if
A)real GDP decreased.
B)the price level increased.
C)the interest rate increased.
D)the Bank of Canada sold government securities.
E)households expected lower incomes in the future.
Unlock Deck
Unlock for access to all 281 flashcards in this deck.
Unlock Deck
k this deck
66
Buying a house during a recession may be a good idea if your job is secure because the Bank of Canada often
A)raises interest rates during recessions.
B)lowers interest rates during recessions.
C)lowers income taxes during recessions.
D)sells Canada bonds to help the housing market.
E)housing prices often rise during recessions.
A)raises interest rates during recessions.
B)lowers interest rates during recessions.
C)lowers income taxes during recessions.
D)sells Canada bonds to help the housing market.
E)housing prices often rise during recessions.
Unlock Deck
Unlock for access to all 281 flashcards in this deck.
Unlock Deck
k this deck
67
Suppose the Bank of Canada increases the money supply.Which of the following is true?
A)At the original interest rate, the quantity of money demanded is equal to the quantity of money supplied.
B)At the original interest rate, the quantity of money demanded is less than the quantity of money supplied.
C)At the original interest rate, the quantity of money demanded is greater than the quantity of money supplied.
D)The interest rate must rise for the money market to clear.
E)The supply of money must fall in the future to restore equilibrium.
Unlock Deck
Unlock for access to all 281 flashcards in this deck.
Unlock Deck
k this deck
68
Which of the following correctly describes a monetary target the Bank of Canada has focused on?
A)The Bank of Canada has used M1+ and M1++ as targets since 1993.
B)The Bank of Canada has focused on M1+ as a target after deregulation of the financial markets.
C)The Bank of Canada uses the overnight interest rate to target the interest rate.
D)After 1980 and before the 1990s, the Bank of Canada focused on interest rate targets.
E)The Bank of Canada has focused on the growth of M2, rather than the level of M2.
Unlock Deck
Unlock for access to all 281 flashcards in this deck.
Unlock Deck
k this deck
69
The money supply curve is vertical if
A)banks and the Bank of Canada jointly determine the money supply.
B)the Bank of Canada is able to completely determine the money supply.
C)banks and households determine the money supply.
D)households and the Bank of Canada jointly determine the money supply.
E)the supply of money increases as the interest rate increases.
Unlock Deck
Unlock for access to all 281 flashcards in this deck.
Unlock Deck
k this deck
70
The rate of interest banks charge other banks for overnight loans of reserves is the
A)discount rate.
B)prime rate.
C)overnight interest rate.
D)real rate.
E)daily nominal rate.
A)discount rate.
B)prime rate.
C)overnight interest rate.
D)real rate.
E)daily nominal rate.
Unlock Deck
Unlock for access to all 281 flashcards in this deck.
Unlock Deck
k this deck
71
When the price of a financial asset ________ its interest rate will ________.
A)rises; rise
B)falls; fall
C)falls; rise
D)rises; remain the same
A)rises; rise
B)falls; fall
C)falls; rise
D)rises; remain the same
Unlock Deck
Unlock for access to all 281 flashcards in this deck.
Unlock Deck
k this deck
72
Figure 11.5 Alt text for Figure 11.5: In figure 11.5, a graph shows movement in money demand curve.
Long description for Figure 11.5: The x-axis is labelled, quantity of money, M (billions of dollars).The y-axis is labelled, interest rate, i.Line MD1 begins in the top left corner and slopes down to the bottom center.Points A and B are marked along line MD1.Point A is close to the bottom of the line, and point B is close to the top of the line.
Refer to Figure 11.5.In the figure above, a movement from point A to point B would be caused by
A)a decrease in real GDP.
B)an increase in the price level.
C)a decrease in the price level.
D)an increase in the interest rate.
E)a decrease in the interest rate.
Alt text for Figure 11.5: In figure 11.5, a graph shows movement in money demand curve.Long description for Figure 11.5: The x-axis is labelled, quantity of money, M (billions of dollars).The y-axis is labelled, interest rate, i.Line MD1 begins in the top left corner and slopes down to the bottom center.Points A and B are marked along line MD1.Point A is close to the bottom of the line, and point B is close to the top of the line.
Refer to Figure 11.5.In the figure above, a movement from point A to point B would be caused by
A)a decrease in real GDP.
B)an increase in the price level.
C)a decrease in the price level.
D)an increase in the interest rate.
E)a decrease in the interest rate.
Unlock Deck
Unlock for access to all 281 flashcards in this deck.
Unlock Deck
k this deck
73
Ceteris paribus, an increase in the money supply will lower short-term interest rates.
Unlock Deck
Unlock for access to all 281 flashcards in this deck.
Unlock Deck
k this deck
74
If the Bank of Canada buys Canada bonds, this will
A)shift the money supply curve to the right.
B)shift the money supply curve to the left.
C)shift the money demand curve to the right.
D)shift the money demand curve to the left.
E)cause the money demand curve to become steeper.
A)shift the money supply curve to the right.
B)shift the money supply curve to the left.
C)shift the money demand curve to the right.
D)shift the money demand curve to the left.
E)cause the money demand curve to become steeper.
Unlock Deck
Unlock for access to all 281 flashcards in this deck.
Unlock Deck
k this deck
75
The overnight interest rate
A)is determined administratively by the Bank of Canada.
B)is determined by the supply of and demand for bank reserves.
C)is determined directly by household demand for funds.
D)is determined directly by firm demand for funds.
E)is determined the demand for loanable funds.
A)is determined administratively by the Bank of Canada.
B)is determined by the supply of and demand for bank reserves.
C)is determined directly by household demand for funds.
D)is determined directly by firm demand for funds.
E)is determined the demand for loanable funds.
Unlock Deck
Unlock for access to all 281 flashcards in this deck.
Unlock Deck
k this deck
76
An increase in the money supply will
A)increase the interest rate.
B)decrease the interest rate.
C)have no effect on the interest rate.
D)decrease the equilibrium quantity of money in the economy.
E)cause a future rise in the interest rate.
A)increase the interest rate.
B)decrease the interest rate.
C)have no effect on the interest rate.
D)decrease the equilibrium quantity of money in the economy.
E)cause a future rise in the interest rate.
Unlock Deck
Unlock for access to all 281 flashcards in this deck.
Unlock Deck
k this deck
77
An increase in real GDP
A)increases the buying and selling of goods and increases the demand for money as a medium of exchange.
B)increases the buying and selling of goods and decreases the demand for money as a medium of exchange.
C)decreases the buying and selling of goods and increases the demand for money as a medium of exchange.
D)decreases the buying and selling of goods and decreases the demand for money as a store of value.
E)increases the buying and selling of goods and decreases the demand for money as unit of account.
Unlock Deck
Unlock for access to all 281 flashcards in this deck.
Unlock Deck
k this deck
78
Figure 11.7 Alt text for Figure 11.7: In figure 11.7, a graph shows movement in the money market.
Long description for Figure 11.7: The x-axis is labelled, quantity of money, M (billions of dollars), with value 500 marked.The y-axis is labelled, interest rate, i, with values 4 and 5% marked.3 lines are shown; MD1, MD2, and MS.Line MD1 begins in the top left corner and slopes down to the end of the x-axis.Line MD2 follows the same slope as line MD1, but is plotted to the right.Line MS is perpendicular to the x-axis, and begins from the value 500.Line MD1 meets line MS at point A (500, 4), a little more than half way along both lines.Line MD2 meets line MS at point B (500, 5%), approximately 3 quarters of the way along both lines.These points of intersection are connected to their respective coordinates on the y-axis using dotted lines.
Refer to Figure 11.7.In the figure above, the movement from point A to point B in the money market would be caused by
A)an increase in the price level.
B)a decrease in real GDP.
C)an open market sale of Canada bonds by the Bank of Canada.
D)an increase in the desired reserve ratio by commercial banks.
E)the Bank of Canada making more loans to commercial banks.
Alt text for Figure 11.7: In figure 11.7, a graph shows movement in the money market.Long description for Figure 11.7: The x-axis is labelled, quantity of money, M (billions of dollars), with value 500 marked.The y-axis is labelled, interest rate, i, with values 4 and 5% marked.3 lines are shown; MD1, MD2, and MS.Line MD1 begins in the top left corner and slopes down to the end of the x-axis.Line MD2 follows the same slope as line MD1, but is plotted to the right.Line MS is perpendicular to the x-axis, and begins from the value 500.Line MD1 meets line MS at point A (500, 4), a little more than half way along both lines.Line MD2 meets line MS at point B (500, 5%), approximately 3 quarters of the way along both lines.These points of intersection are connected to their respective coordinates on the y-axis using dotted lines.
Refer to Figure 11.7.In the figure above, the movement from point A to point B in the money market would be caused by
A)an increase in the price level.
B)a decrease in real GDP.
C)an open market sale of Canada bonds by the Bank of Canada.
D)an increase in the desired reserve ratio by commercial banks.
E)the Bank of Canada making more loans to commercial banks.
Unlock Deck
Unlock for access to all 281 flashcards in this deck.
Unlock Deck
k this deck
79
Figure 11.6 Alt text for Figure 11.6: In figure 11.6, a graph shows movement in the money market.
Long description for Figure 11.6: The x-axis is labelled, quantity of money, M (billions of dollars), with values 900 and 950 marked.The y-axis is labelled, interest rate, i, with values 3 and 4% marked.3 lines are shown; MS1, MS2, and MD.Line MD begins in the top left corner and slopes down to the end of the x-axis.Line MS1 is perpendicular to the x-axis, and begins from the value 950.Line MS2 is perpendicular to the x-axis, and begins from the value 900, to the left of line MS1.Line MD intersects line MS1 at point A (950, 3), approximately 3 quarters of the way along both lines.Line MD meets line MS2 at point B (900, 4%), more than half way along both lines.These points of intersection are connected to their respective coordinates on the y-axis using dotted lines.
Refer to Figure 11.6.In the figure above, the movement from point A to point B in the money market would be caused by
A)an increase in the price level.
B)a decrease in real GDP.
C)an open market sale of Canada bonds by the Bank of Canada.
D)a decrease in the desired reserve ratio by commercial banks.
E)an increase in the willingness of commercial banks to make risky loans.
Alt text for Figure 11.6: In figure 11.6, a graph shows movement in the money market.Long description for Figure 11.6: The x-axis is labelled, quantity of money, M (billions of dollars), with values 900 and 950 marked.The y-axis is labelled, interest rate, i, with values 3 and 4% marked.3 lines are shown; MS1, MS2, and MD.Line MD begins in the top left corner and slopes down to the end of the x-axis.Line MS1 is perpendicular to the x-axis, and begins from the value 950.Line MS2 is perpendicular to the x-axis, and begins from the value 900, to the left of line MS1.Line MD intersects line MS1 at point A (950, 3), approximately 3 quarters of the way along both lines.Line MD meets line MS2 at point B (900, 4%), more than half way along both lines.These points of intersection are connected to their respective coordinates on the y-axis using dotted lines.
Refer to Figure 11.6.In the figure above, the movement from point A to point B in the money market would be caused by
A)an increase in the price level.
B)a decrease in real GDP.
C)an open market sale of Canada bonds by the Bank of Canada.
D)a decrease in the desired reserve ratio by commercial banks.
E)an increase in the willingness of commercial banks to make risky loans.
Unlock Deck
Unlock for access to all 281 flashcards in this deck.
Unlock Deck
k this deck
80
The overnight interest rate is
A)the interest rate the Bank of Canada charges investment banks, trusts, credit unions, and caisses populaires.
B)the interest rate a bank charges its best customers.
C)the interest rate banks charge each other for overnight loans.
D)the interest rate on a Canada bond.
E)the interest rate charged on credit card borrowing if payments are made before they are due.
Unlock Deck
Unlock for access to all 281 flashcards in this deck.
Unlock Deck
k this deck
Unlock Deck
Unlock for access to all 281 flashcards in this deck.


