Deck 14: Introduction to Linear Regression and Correlation Analysis
Full screen (f)
Question
Question
Question
Question
Question
Question
Question
Question
Question
Question
Question
Question
Question
Question
Question
Question
Question
Question
Question
Question
Question
Question
Question
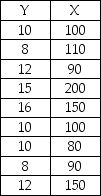
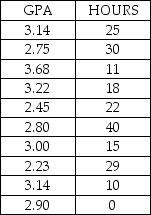
State University recently randomly sampled ten students and analyzed grade point average (GPA)and number of hours worked off-campus per week.The following data were observed:
 If the university wished to test the claim that the correlation between hours worked and GPA is negative,the following null and alternative hypotheses would be appropriate:
H0 : ρ < 0.0
Ha : ρ ≥ 0.0
If the university wished to test the claim that the correlation between hours worked and GPA is negative,the following null and alternative hypotheses would be appropriate:H0 : ρ < 0.0
Ha : ρ ≥ 0.0
Question
Question
Question
Question
State University recently randomly sampled ten students and analyzed grade point average (GPA)and number of hours worked off-campus per week.The following data were observed:
 The test statistic for testing whether the two variables are significantly correlated is approximately z = 1.56.
The test statistic for testing whether the two variables are significantly correlated is approximately z = 1.56. Question
Question
Question
You are given the following sample data for two variables:
 Based upon these sample data,and testing at the 0.05 level of significance,the critical value for testing whether the population correlation coefficient is equal to zero is t = 2.2622.
Based upon these sample data,and testing at the 0.05 level of significance,the critical value for testing whether the population correlation coefficient is equal to zero is t = 2.2622. Question
State University recently randomly sampled ten students and analyzed grade point average (GPA)and number of hours worked off-campus per week.The following data were observed:
 In this study the independent variable is the number of hours worked off campus per week.
In this study the independent variable is the number of hours worked off campus per week. Question
Question
Question
Question
Question
Question
State University recently randomly sampled ten students and analyzed grade point average (GPA)and number of hours worked off-campus per week.The following data were observed:
 The correlation between these two variables is approximately -.461
The correlation between these two variables is approximately -.461 Question
Question
You are given the following sample data for two variables:
 The sample correlation coefficient for these data is approximately r = 0.755.
The sample correlation coefficient for these data is approximately r = 0.755. Question
Question
Given a regression equation of  = 16 + 2.3x we would expect that an increase in x of 2.0 would lead to an average increase of y of 4.6.
= 16 + 2.3x we would expect that an increase in x of 2.0 would lead to an average increase of y of 4.6. Question
Question
State University recently randomly sampled seven students and analyzed grade point average (GPA)and number of hours worked off-campus per week.The following data were observed:
 A regression model with HOURS as the independent variable has an R-square equal to approximately .46.
A regression model with HOURS as the independent variable has an R-square equal to approximately .46. Question
In a study of 30 customers' utility bills in which the monthly bill was the dependent variable and the number of square feet in the house is the independent variable,the resulting regression model is  = 23.40 + 0.4x.Based on this model,the expected utility bill for a customer with a home with 2,300 square feet is approximately $92.00.
= 23.40 + 0.4x.Based on this model,the expected utility bill for a customer with a home with 2,300 square feet is approximately $92.00. Question
Question
A study was recently done in which the following regression output was generated using Excel.
SUMMARY OUTPUT Given this output,we would reject the null hypothesis that the population regression slope coefficient is equal to zero at the alpha = 0.05 level.
SUMMARY OUTPUT
Given this output,we would reject the null hypothesis that the population regression slope coefficient is equal to zero at the alpha = 0.05 level. Question
The following regression model has been computed based on a sample of twenty observations:  = 34.2 + 19.3x.The first observations in the sample for y and x were 300 and 18,respectively.Given this,the residual value for the first observation is approximately 81.6.
= 34.2 + 19.3x.The first observations in the sample for y and x were 300 and 18,respectively.Given this,the residual value for the first observation is approximately 81.6. Question
Question
Question
In a study of 30 customers' utility bills in which the monthly bill was the dependent variable and the number of square feet in the house is the independent variable,the resulting regression model is  = 23.40 + 0.4x.Given this,the sample correlation coefficient is known to be positive.
= 23.40 + 0.4x.Given this,the sample correlation coefficient is known to be positive. Question
Question
Question
You are given the following sample data for two variables:
 The regression model based on these sample data explains approximately 75 percent of the variation in the dependent variable.
The regression model based on these sample data explains approximately 75 percent of the variation in the dependent variable. Question
A study was recently done in which the following regression output was generated using Excel.
SUMMARY OUTPUT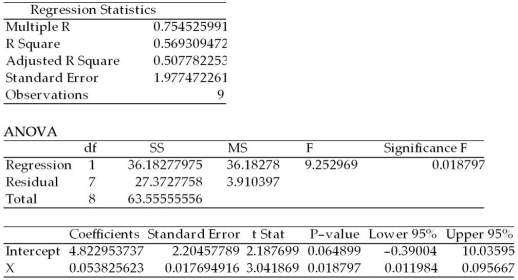 Given this,we know that approximately 57 percent of the variation in the y variable is explained by the x variable.
SUMMARY OUTPUT
Given this,we know that approximately 57 percent of the variation in the y variable is explained by the x variable. Question
Assume that we have found a regression equation of  = 3.6 - 2.4x,and that the coefficient of determination is 0.72,then the correlation of x and y must be about 0.849.
= 3.6 - 2.4x,and that the coefficient of determination is 0.72,then the correlation of x and y must be about 0.849. Question
In a study of 30 customers' utility bills in which the monthly bill was the dependent variable and the number of square feet in the house is the independent variable,the resulting regression model is  = 23.40 + 0.04x.Given this model,for a customer with a 2,000 square foot house and a monthly utility bill equal to $100.00,the residual from the regression model is approximately -$3.40.
= 23.40 + 0.04x.Given this model,for a customer with a 2,000 square foot house and a monthly utility bill equal to $100.00,the residual from the regression model is approximately -$3.40. Question
The following regression model has been computed based on a sample of twenty observations:  = 34.2 + 19.3x.Given this model,the predicted value for y when x = 40 is 806.2.
= 34.2 + 19.3x.Given this model,the predicted value for y when x = 40 is 806.2. Question
Question
Question
Question
A manufacturing company is interested in predicting the number of defects that will be produced each hour on the assembly line.The managers believe that there is a relationship between the defect rate and the production rate per hour.The managers believe that they can use production rate to predict the number of defects.The following data were collected for 10 randomly selected hours.
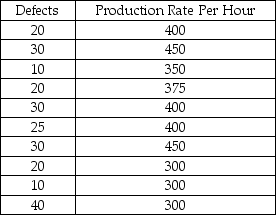 Given these sample data,the simple linear regression model for predicting the number of defects is approximately
  = 5.67 + 0.048x.
Given these sample data,the simple linear regression model for predicting the number of defects is approximately = 5.67 + 0.048x. Question
Question
Question
Question
A study was recently performed by the Internal Revenue Service to determine how much tip income waiters and waitresses should make based on the size of the bill at each table.A random sample of bills and resulting tips were collected and the following regression results were observed:
SUMMARY OUTPUT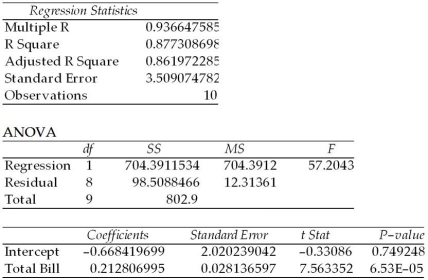 Given this output,the upper limit for the 95 percent confidence interval estimate for the true regression slope coefficient is approximately 0.28.
SUMMARY OUTPUT
Given this output,the upper limit for the 95 percent confidence interval estimate for the true regression slope coefficient is approximately 0.28. Question
State University recently randomly sampled seven students and analyzed grade point average (GPA)and number of hours worked off-campus per week.The following data were observed:
 In testing the significance of the regression slope coefficient for the independent variable,HOURS,the calculated test statistic is approximately t = -1.47.
In testing the significance of the regression slope coefficient for the independent variable,HOURS,the calculated test statistic is approximately t = -1.47. Question
Question
Question
Question
A study was recently performed by the Internal Revenue Service to determine how much tip income waiters and waitresses should make based on the size of the bill at each table.A random sample of bills and resulting tips were collected and the following regression results were observed:
SUMMARY OUTPUT Given this output,the point estimate for the average tip per dollar amount of the bill is approximately $0.21.
SUMMARY OUTPUT
Given this output,the point estimate for the average tip per dollar amount of the bill is approximately $0.21. Question
Question
Question
Question
Question
Question
Question
Question
Given the following regression equation,the predicted value for y when x = 0.5 is about 4.57 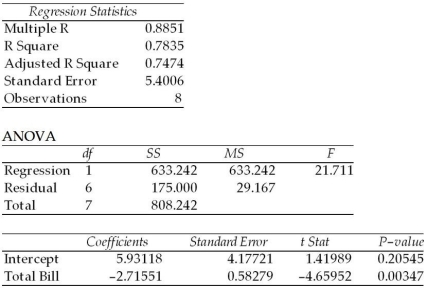
Question
Question

Unlock Deck
Sign up to unlock the cards in this deck!
Unlock Deck
Unlock Deck
1/139
Play
Full screen (f)
Deck 14: Introduction to Linear Regression and Correlation Analysis
1
Both a scatter plot and the correlation coefficient can distinguish between a curvilinear and a linear relationship.
False
2
If the correlation coefficient for two variables is computed to be a -0.70,the scatter plot will show the data to be downward sloping from left to right.
True
3
A bank is interested in determining whether its customers' checking balances are linearly related to their savings balances.A sample of n = 20 customers was selected and the correlation was calculated to be +0.40.If the bank is interested in testing to see whether there is a significant linear relationship between the two variables using a significance level of .05,the correct null and alternative hypotheses to test are:
H0 : r = 0.0
Ha : r ≠ 0.0
H0 : r = 0.0
Ha : r ≠ 0.0
False
4
A scatter plot is useful for identifying a linear relationship between the independent and dependent variable,but it is not particularly useful if the relationship is curvilinear.
Unlock Deck
Unlock for access to all 139 flashcards in this deck.
Unlock Deck
k this deck
5
Two variables have a correlation coefficient that is very close to zero.This means that there is no relationship between the two variables.
Unlock Deck
Unlock for access to all 139 flashcards in this deck.
Unlock Deck
k this deck
6
A study was recently conducted by Major League Baseball to determine whether there is a correlation between attendance at games and the record of home team's opponent.In this study,the dependent variable would be the record of the home team's opponent.
Unlock Deck
Unlock for access to all 139 flashcards in this deck.
Unlock Deck
k this deck
7
A dependent variable is the variable that we wish to predict or explain in a regression model.
Unlock Deck
Unlock for access to all 139 flashcards in this deck.
Unlock Deck
k this deck
8
A research study has stated that the taxes paid by individuals is correlated at a .78 value with the age of the individual.Given this,the scatter plot would show points that would fall on straight line on a slope equal to .78.
Unlock Deck
Unlock for access to all 139 flashcards in this deck.
Unlock Deck
k this deck
9
When constructing a scatter plot,the dependent variable is placed on the vertical axis and the independent variable is placed on the horizontal axis.
Unlock Deck
Unlock for access to all 139 flashcards in this deck.
Unlock Deck
k this deck
10
A bank is interested in determining whether its customers' checking balances are linearly related to their savings balances.A sample of n = 20 customers was selected and the correlation was calculated to be +0.40.If the bank is interested in testing to see whether there is a significant linear relationship between the two variables using a significance level of 0.05,the value of the test statistic is approximately t = 1.8516.
Unlock Deck
Unlock for access to all 139 flashcards in this deck.
Unlock Deck
k this deck
11
A cellular phone service provider believes that there is negative correlation between the minutes used by its customers and the age of the customer.To test this,the following would be the appropriate null and alternative hypotheses:
H0 : ρ = 0.0
Ha : ρ ≠ 0.0
H0 : ρ = 0.0
Ha : ρ ≠ 0.0
Unlock Deck
Unlock for access to all 139 flashcards in this deck.
Unlock Deck
k this deck
12
In developing a scatter plot,the decision maker has the option of connecting the points or not.
Unlock Deck
Unlock for access to all 139 flashcards in this deck.
Unlock Deck
k this deck
13
The scatter plot is a two dimensional graph that is used to graphically represent the relationship between two variables.
Unlock Deck
Unlock for access to all 139 flashcards in this deck.
Unlock Deck
k this deck
14
When a correlation is found between a pair of variables,this always means that there is a direct cause and effect relationship between the variables.
Unlock Deck
Unlock for access to all 139 flashcards in this deck.
Unlock Deck
k this deck
15
A perfect correlation between two variables will always produce a correlation coefficient of +1.0
Unlock Deck
Unlock for access to all 139 flashcards in this deck.
Unlock Deck
k this deck
16
The difference between a scatter plot and a scatter diagram is that the scatter plot has the independent variable on the x-axis while the independent variable is on the Y-axis in a scatter diagram.
Unlock Deck
Unlock for access to all 139 flashcards in this deck.
Unlock Deck
k this deck
17
In conducting a hypothesis test for a correlation,the correct probability distribution to use is the F distribution.
Unlock Deck
Unlock for access to all 139 flashcards in this deck.
Unlock Deck
k this deck
18
A correlation coefficient computed from a sample of data values selected from a population is called a statistic and is subject to sampling error.
Unlock Deck
Unlock for access to all 139 flashcards in this deck.
Unlock Deck
k this deck
19
If two variables are related in a positive linear manner,the scatter plot will show points on the x,y space that are generally moving from the lower left to the upper right.
Unlock Deck
Unlock for access to all 139 flashcards in this deck.
Unlock Deck
k this deck
20
A correlation of -0.9 indicates a weak linear relationship between the variables.
Unlock Deck
Unlock for access to all 139 flashcards in this deck.
Unlock Deck
k this deck
21
In developing a simple linear regression model it is assumed that the distribution of error terms will be normally distributed for all levels of x.
Unlock Deck
Unlock for access to all 139 flashcards in this deck.
Unlock Deck
k this deck
22
If two variables are uncorrelated,the sample correlation coefficient will be r = 0.00.
Unlock Deck
Unlock for access to all 139 flashcards in this deck.
Unlock Deck
k this deck
23
State University recently randomly sampled ten students and analyzed grade point average (GPA)and number of hours worked off-campus per week.The following data were observed:
If the university wished to test the claim that the correlation between hours worked and GPA is negative,the following null and alternative hypotheses would be appropriate:
H0 : ρ < 0.0
Ha : ρ ≥ 0.0
If the university wished to test the claim that the correlation between hours worked and GPA is negative,the following null and alternative hypotheses would be appropriate:H0 : ρ < 0.0
Ha : ρ ≥ 0.0
Unlock Deck
Unlock for access to all 139 flashcards in this deck.
Unlock Deck
k this deck
24
In a simple regression model,the slope coefficient represents the average change in the independent variable for a one-unit change in the dependent variable.
Unlock Deck
Unlock for access to all 139 flashcards in this deck.
Unlock Deck
k this deck
25
When the correlation coefficient for the two variables was -0.23,it implies that the two variables are not correlated because the correlation coefficient cannot be negative.
Unlock Deck
Unlock for access to all 139 flashcards in this deck.
Unlock Deck
k this deck
26
The fact that teachers' salaries in Wisconsin are correlated with egg prices in Texas means that the two variables are spuriously correlated since a change in one variable could not cause the change in the other.
Unlock Deck
Unlock for access to all 139 flashcards in this deck.
Unlock Deck
k this deck
27
State University recently randomly sampled ten students and analyzed grade point average (GPA)and number of hours worked off-campus per week.The following data were observed:
The test statistic for testing whether the two variables are significantly correlated is approximately z = 1.56.
The test statistic for testing whether the two variables are significantly correlated is approximately z = 1.56. Unlock Deck
Unlock for access to all 139 flashcards in this deck.
Unlock Deck
k this deck
28
Given a sample of size n = 15 and a sample correlation of r = 0.7,the value of the test statistic for conducting a hypothesis test of the correlation is t = 3.53.
Unlock Deck
Unlock for access to all 139 flashcards in this deck.
Unlock Deck
k this deck
29
Given a sample correlation r = -0.5 and a sample size of n = 30,the test statistic for testing whether the two variables are significantly correlated is approximately t = -3.055.
Unlock Deck
Unlock for access to all 139 flashcards in this deck.
Unlock Deck
k this deck
30
You are given the following sample data for two variables:
Based upon these sample data,and testing at the 0.05 level of significance,the critical value for testing whether the population correlation coefficient is equal to zero is t = 2.2622.
Based upon these sample data,and testing at the 0.05 level of significance,the critical value for testing whether the population correlation coefficient is equal to zero is t = 2.2622. Unlock Deck
Unlock for access to all 139 flashcards in this deck.
Unlock Deck
k this deck
31
State University recently randomly sampled ten students and analyzed grade point average (GPA)and number of hours worked off-campus per week.The following data were observed:
In this study the independent variable is the number of hours worked off campus per week.
In this study the independent variable is the number of hours worked off campus per week. Unlock Deck
Unlock for access to all 139 flashcards in this deck.
Unlock Deck
k this deck
32
If a set of data contains no values of x that are equal to zero,then the regression coefficient,b0,has no particular meaning.
Unlock Deck
Unlock for access to all 139 flashcards in this deck.
Unlock Deck
k this deck
33
If the correlation between two variables is known to be statistically significant at the 0.05 level,then the regression slope coefficient will also be significant at the 0.05 level.
Unlock Deck
Unlock for access to all 139 flashcards in this deck.
Unlock Deck
k this deck
34
If two variables are spuriously correlated,it means that the correlation coefficient between them is near zero.
Unlock Deck
Unlock for access to all 139 flashcards in this deck.
Unlock Deck
k this deck
35
In conducting a hypothesis test on the correlation between a pair of variables,we assume that each variable is normally and independently distributed.
Unlock Deck
Unlock for access to all 139 flashcards in this deck.
Unlock Deck
k this deck
36
If two variables are highly correlated,it not only means that they are linearly related,it also means that a change in one variable will cause a change in the other variable.
Unlock Deck
Unlock for access to all 139 flashcards in this deck.
Unlock Deck
k this deck
37
State University recently randomly sampled ten students and analyzed grade point average (GPA)and number of hours worked off-campus per week.The following data were observed:
The correlation between these two variables is approximately -.461
The correlation between these two variables is approximately -.461 Unlock Deck
Unlock for access to all 139 flashcards in this deck.
Unlock Deck
k this deck
38
In a university statistics course a correlation of -0.8 was found between numbers of classes missed and course grade.This means that the fewer classes students missed,the higher the grade.
Unlock Deck
Unlock for access to all 139 flashcards in this deck.
Unlock Deck
k this deck
39
You are given the following sample data for two variables:
The sample correlation coefficient for these data is approximately r = 0.755.
The sample correlation coefficient for these data is approximately r = 0.755. Unlock Deck
Unlock for access to all 139 flashcards in this deck.
Unlock Deck
k this deck
40
When a pair of variables has a positive correlation,the slope in the regression equation will always be positive.
Unlock Deck
Unlock for access to all 139 flashcards in this deck.
Unlock Deck
k this deck
41
Given a regression equation of = 16 + 2.3x we would expect that an increase in x of 2.0 would lead to an average increase of y of 4.6.
= 16 + 2.3x we would expect that an increase in x of 2.0 would lead to an average increase of y of 4.6. Unlock Deck
Unlock for access to all 139 flashcards in this deck.
Unlock Deck
k this deck
42
The standard error of the estimate for a simple linear regression model measures the variation in the slope coefficient from sample to sample.
Unlock Deck
Unlock for access to all 139 flashcards in this deck.
Unlock Deck
k this deck
43
State University recently randomly sampled seven students and analyzed grade point average (GPA)and number of hours worked off-campus per week.The following data were observed:
A regression model with HOURS as the independent variable has an R-square equal to approximately .46.
A regression model with HOURS as the independent variable has an R-square equal to approximately .46. Unlock Deck
Unlock for access to all 139 flashcards in this deck.
Unlock Deck
k this deck
44
In a study of 30 customers' utility bills in which the monthly bill was the dependent variable and the number of square feet in the house is the independent variable,the resulting regression model is = 23.40 + 0.4x.Based on this model,the expected utility bill for a customer with a home with 2,300 square feet is approximately $92.00.
= 23.40 + 0.4x.Based on this model,the expected utility bill for a customer with a home with 2,300 square feet is approximately $92.00. Unlock Deck
Unlock for access to all 139 flashcards in this deck.
Unlock Deck
k this deck
45
If it is known that a simple linear regression model explains 56 percent of the variation in the dependent variable and that the slope on the regression equation is negative,then we also know that the correlation between x and y is approximately -0.75.
Unlock Deck
Unlock for access to all 139 flashcards in this deck.
Unlock Deck
k this deck
46
A study was recently done in which the following regression output was generated using Excel.
SUMMARY OUTPUT Given this output,we would reject the null hypothesis that the population regression slope coefficient is equal to zero at the alpha = 0.05 level.
SUMMARY OUTPUT
Given this output,we would reject the null hypothesis that the population regression slope coefficient is equal to zero at the alpha = 0.05 level. Unlock Deck
Unlock for access to all 139 flashcards in this deck.
Unlock Deck
k this deck
47
The following regression model has been computed based on a sample of twenty observations: = 34.2 + 19.3x.The first observations in the sample for y and x were 300 and 18,respectively.Given this,the residual value for the first observation is approximately 81.6.
= 34.2 + 19.3x.The first observations in the sample for y and x were 300 and 18,respectively.Given this,the residual value for the first observation is approximately 81.6. Unlock Deck
Unlock for access to all 139 flashcards in this deck.
Unlock Deck
k this deck
48
The sum of the residuals in a least squares regression model will be zero only when the correlation between the x and y variables is statistically significant.
Unlock Deck
Unlock for access to all 139 flashcards in this deck.
Unlock Deck
k this deck
49
If the correlation of x and y is -0.65,then coefficient of determination is -0.4225.
Unlock Deck
Unlock for access to all 139 flashcards in this deck.
Unlock Deck
k this deck
50
In a study of 30 customers' utility bills in which the monthly bill was the dependent variable and the number of square feet in the house is the independent variable,the resulting regression model is = 23.40 + 0.4x.Given this,the sample correlation coefficient is known to be positive.
= 23.40 + 0.4x.Given this,the sample correlation coefficient is known to be positive. Unlock Deck
Unlock for access to all 139 flashcards in this deck.
Unlock Deck
k this deck
51
If the sample value of the intercept turns out to be an illogical value,this is acceptable as long as x = 0 is not within the range of the data.
Unlock Deck
Unlock for access to all 139 flashcards in this deck.
Unlock Deck
k this deck
52
The sign on the intercept coefficient in a simple regression model will always be the same as the sign on the correlation coefficient.
Unlock Deck
Unlock for access to all 139 flashcards in this deck.
Unlock Deck
k this deck
53
You are given the following sample data for two variables:
The regression model based on these sample data explains approximately 75 percent of the variation in the dependent variable.
The regression model based on these sample data explains approximately 75 percent of the variation in the dependent variable. Unlock Deck
Unlock for access to all 139 flashcards in this deck.
Unlock Deck
k this deck
54
A study was recently done in which the following regression output was generated using Excel.
SUMMARY OUTPUT Given this,we know that approximately 57 percent of the variation in the y variable is explained by the x variable.
SUMMARY OUTPUT
Given this,we know that approximately 57 percent of the variation in the y variable is explained by the x variable. Unlock Deck
Unlock for access to all 139 flashcards in this deck.
Unlock Deck
k this deck
55
Assume that we have found a regression equation of = 3.6 - 2.4x,and that the coefficient of determination is 0.72,then the correlation of x and y must be about 0.849.
= 3.6 - 2.4x,and that the coefficient of determination is 0.72,then the correlation of x and y must be about 0.849. Unlock Deck
Unlock for access to all 139 flashcards in this deck.
Unlock Deck
k this deck
56
In a study of 30 customers' utility bills in which the monthly bill was the dependent variable and the number of square feet in the house is the independent variable,the resulting regression model is = 23.40 + 0.04x.Given this model,for a customer with a 2,000 square foot house and a monthly utility bill equal to $100.00,the residual from the regression model is approximately -$3.40.
= 23.40 + 0.04x.Given this model,for a customer with a 2,000 square foot house and a monthly utility bill equal to $100.00,the residual from the regression model is approximately -$3.40. Unlock Deck
Unlock for access to all 139 flashcards in this deck.
Unlock Deck
k this deck
57
The following regression model has been computed based on a sample of twenty observations: = 34.2 + 19.3x.Given this model,the predicted value for y when x = 40 is 806.2.
= 34.2 + 19.3x.Given this model,the predicted value for y when x = 40 is 806.2. Unlock Deck
Unlock for access to all 139 flashcards in this deck.
Unlock Deck
k this deck
58
If the correlation between the dependent variable and the independent variable is negative,the standard error of the regression slope coefficient in a simple linear regression model will also be negative.
Unlock Deck
Unlock for access to all 139 flashcards in this deck.
Unlock Deck
k this deck
59
In a simple regression model,if the regression model is deemed to be statistically significant,it means that the regression slope coefficient is significantly greater than zero.
Unlock Deck
Unlock for access to all 139 flashcards in this deck.
Unlock Deck
k this deck
60
Given a sample of data for use in simple linear regression,the values for the slope and the intercept are chosen to minimize the sum of squared errors.
Unlock Deck
Unlock for access to all 139 flashcards in this deck.
Unlock Deck
k this deck
61
A manufacturing company is interested in predicting the number of defects that will be produced each hour on the assembly line.The managers believe that there is a relationship between the defect rate and the production rate per hour.The managers believe that they can use production rate to predict the number of defects.The following data were collected for 10 randomly selected hours.
Given these sample data,the simple linear regression model for predicting the number of defects is approximately = 5.67 + 0.048x.
Given these sample data,the simple linear regression model for predicting the number of defects is approximately = 5.67 + 0.048x. Unlock Deck
Unlock for access to all 139 flashcards in this deck.
Unlock Deck
k this deck
62
When the intercept in a regression equation is deemed not significantly different from 0,then in making predictions for y,0.0 should be used as the value of the intercept rather than the estimated intercept value.
Unlock Deck
Unlock for access to all 139 flashcards in this deck.
Unlock Deck
k this deck
63
In analyzing the relationship between two variables,a scatter plot can be used to detect which of the following?
A)A positive linear relationship
B)A curvilinear relationship
C)A negative linear relationship
D)All of the above
A)A positive linear relationship
B)A curvilinear relationship
C)A negative linear relationship
D)All of the above
Unlock Deck
Unlock for access to all 139 flashcards in this deck.
Unlock Deck
k this deck
64
If the R-squared value for a regression model is high,the regression model will necessarily provide accurate forecasts of the y variable.
Unlock Deck
Unlock for access to all 139 flashcards in this deck.
Unlock Deck
k this deck
65
A study was recently performed by the Internal Revenue Service to determine how much tip income waiters and waitresses should make based on the size of the bill at each table.A random sample of bills and resulting tips were collected and the following regression results were observed:
SUMMARY OUTPUT Given this output,the upper limit for the 95 percent confidence interval estimate for the true regression slope coefficient is approximately 0.28.
SUMMARY OUTPUT
Given this output,the upper limit for the 95 percent confidence interval estimate for the true regression slope coefficient is approximately 0.28. Unlock Deck
Unlock for access to all 139 flashcards in this deck.
Unlock Deck
k this deck
66
State University recently randomly sampled seven students and analyzed grade point average (GPA)and number of hours worked off-campus per week.The following data were observed:
In testing the significance of the regression slope coefficient for the independent variable,HOURS,the calculated test statistic is approximately t = -1.47.
In testing the significance of the regression slope coefficient for the independent variable,HOURS,the calculated test statistic is approximately t = -1.47. Unlock Deck
Unlock for access to all 139 flashcards in this deck.
Unlock Deck
k this deck
67
If a simple least squares regression model is developed based on a sample where the two variables are known to be positively correlated,the sign on the regression coefficient will be positive also.
Unlock Deck
Unlock for access to all 139 flashcards in this deck.
Unlock Deck
k this deck
68
When regression analysis is used for descriptive purposes,two of the main items of interest are whether the sign on the regression slope coefficient is positive or negative and whether the regression slope coefficient is significantly different from zero.
Unlock Deck
Unlock for access to all 139 flashcards in this deck.
Unlock Deck
k this deck
69
In a simple linear regression analysis,if the test statistic for testing the significance of the regression slope coefficient is 3.6,the F ratio from the analysis of variance table is known to be 12.96
Unlock Deck
Unlock for access to all 139 flashcards in this deck.
Unlock Deck
k this deck
70
A study was recently performed by the Internal Revenue Service to determine how much tip income waiters and waitresses should make based on the size of the bill at each table.A random sample of bills and resulting tips were collected and the following regression results were observed:
SUMMARY OUTPUT Given this output,the point estimate for the average tip per dollar amount of the bill is approximately $0.21.
SUMMARY OUTPUT
Given this output,the point estimate for the average tip per dollar amount of the bill is approximately $0.21. Unlock Deck
Unlock for access to all 139 flashcards in this deck.
Unlock Deck
k this deck
71
The values of the regression coefficients are found such the sum of the residuals is minimized.
Unlock Deck
Unlock for access to all 139 flashcards in this deck.
Unlock Deck
k this deck
72
If a simple least squares regression model is developed based on a sample where the two variables are known to be positively correlated,the sum of the residuals will be positive.
Unlock Deck
Unlock for access to all 139 flashcards in this deck.
Unlock Deck
k this deck
73
The prediction interval developed from a simple linear regression model will be at its narrowest point when the value of x used to predict y is equal to the mean value of x.
Unlock Deck
Unlock for access to all 139 flashcards in this deck.
Unlock Deck
k this deck
74
When calculating prediction intervals for predicted values of y based on a given x,all 95 percent prediction intervals will be of equal width.
Unlock Deck
Unlock for access to all 139 flashcards in this deck.
Unlock Deck
k this deck
75
A high coefficient of determination (R2)implies that the regression model will be a good predictor for future values of the dependent variable given the value of the independent variable.
Unlock Deck
Unlock for access to all 139 flashcards in this deck.
Unlock Deck
k this deck
76
If the R-square value for a simple linear regression model is .80,the correlation between the two variables is known to be .64.
Unlock Deck
Unlock for access to all 139 flashcards in this deck.
Unlock Deck
k this deck
77
A positive population slope of 12 (β1 = 12)means that a 1-unit increase in x causes an average 12-unit increase in y.
Unlock Deck
Unlock for access to all 139 flashcards in this deck.
Unlock Deck
k this deck
78
Given the following regression equation,the predicted value for y when x = 0.5 is about 4.57
Unlock Deck
Unlock for access to all 139 flashcards in this deck.
Unlock Deck
k this deck
79
In simple linear regression,the t-test for the slope and the F-test are both conducting the same hypothesis test.
Unlock Deck
Unlock for access to all 139 flashcards in this deck.
Unlock Deck
k this deck
80
A regression model that is deemed to have a regression slope coefficient that could be equal to zero should not be used for prediction since there is no established linear relationship between the x and y variable.
Unlock Deck
Unlock for access to all 139 flashcards in this deck.
Unlock Deck
k this deck
Unlock Deck
Unlock for access to all 139 flashcards in this deck.


