Deck 11: Quality Improvement Methods
Full screen (f)
Question
Question
Question
Question
The following figure shows a histogram. 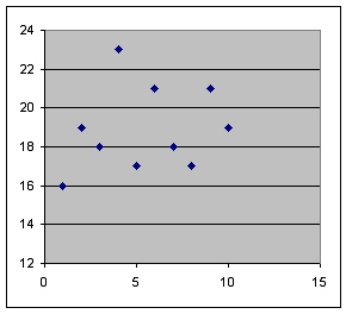
Question
Question
Question
Question
Question
Question
Question
Question
Question
Question
Question
Question
Question
Question
Question
Question
Question
Question
Question
Question
Question
Question
Question
Question
Question
Question
Question
Question
Question
Question
Question
Question
Question
Question
Question
Question
Question
Question
Question
Question
Question
Question
Question
Question
Question
Question
Question
Question
Question
Question
Question
Question
Question
Question
Question
Question
Question
Question
Question
Question
Question
Prepare a scatter diagram for the following data.

Question
Question
Question
Question
A continuous process cuts pipe into lengths of 79 inches.Five samples of six observations each have been taken,and the results are listed below.Calculate the standard deviation of the individual data points.

Question
A continuous process cuts pipe into lengths of 79 inches.Five samples of six observations each have been taken,and the results are listed below.Calculate the control limits for the R chart.

Question
A collection of defective metal castings were studied and classified as follows:

Question
Question
Question
Repeated samples of 150 ball point pen housings are inspected to determine if the housing is out of round or the printing is readable.If either condition exists,it is nonconforming.The following sample information was collected.

Question

Unlock Deck
Sign up to unlock the cards in this deck!
Unlock Deck
Unlock Deck
1/75
Play
Full screen (f)
Deck 11: Quality Improvement Methods
1
Once a quality improvement plan is implemented,the process is complete.
False
2
The purpose of FMEA is to take action to eliminate or reduce failures,starting with the highest-priority ones.
True
3
Fail-safing refers to investigating how a process might fail.
False
4
The following figure shows a histogram.
Unlock Deck
Unlock for access to all 75 flashcards in this deck.
Unlock Deck
k this deck
5
A less-than-appropriate sample size can lead to a lower probability of the two types of errors commonly associated with any statistical analysis.
Unlock Deck
Unlock for access to all 75 flashcards in this deck.
Unlock Deck
k this deck
6
A Pareto analysis suggests that 20 percent of the problems are produced by 80 percent of the causes.
Unlock Deck
Unlock for access to all 75 flashcards in this deck.
Unlock Deck
k this deck
7
A process capability analysis is focused on statistical variations present within a system.
Unlock Deck
Unlock for access to all 75 flashcards in this deck.
Unlock Deck
k this deck
8
A Type I error is a false negative.
Unlock Deck
Unlock for access to all 75 flashcards in this deck.
Unlock Deck
k this deck
9
When a percentage of measurements fall outside specification limits,the process is capable.
Unlock Deck
Unlock for access to all 75 flashcards in this deck.
Unlock Deck
k this deck
10
Deming's Plan Do Check Act cycle is a series of steps that are systematically implemented in a quality improvement plan.
Unlock Deck
Unlock for access to all 75 flashcards in this deck.
Unlock Deck
k this deck
11
Clearly defining the population of interest is a key step in developing a sampling plan.
Unlock Deck
Unlock for access to all 75 flashcards in this deck.
Unlock Deck
k this deck
12
Unless the companies are in the same industry,benchmarking should be avoided.
Unlock Deck
Unlock for access to all 75 flashcards in this deck.
Unlock Deck
k this deck
13
When implementing a quality improvement plan,it is important to understand the constraints that might prevent the organization from achieving its goals.
Unlock Deck
Unlock for access to all 75 flashcards in this deck.
Unlock Deck
k this deck
14
Critical evaluation of ideas is an important first step when brainstorming.
Unlock Deck
Unlock for access to all 75 flashcards in this deck.
Unlock Deck
k this deck
15
Customers are a source of quality improvement ideas.
Unlock Deck
Unlock for access to all 75 flashcards in this deck.
Unlock Deck
k this deck
16
A check sheet is a structured,prepared form for collecting and analyzing sampled observations.
Unlock Deck
Unlock for access to all 75 flashcards in this deck.
Unlock Deck
k this deck
17
A specific reason exists for special-cause variations.
Unlock Deck
Unlock for access to all 75 flashcards in this deck.
Unlock Deck
k this deck
18
When the cost of failure is high,a PDPC should be considered.
Unlock Deck
Unlock for access to all 75 flashcards in this deck.
Unlock Deck
k this deck
19
A cause-and-effect diagram is also known as a fishbone diagram.
Unlock Deck
Unlock for access to all 75 flashcards in this deck.
Unlock Deck
k this deck
20
An interrelationship diagram is used to break down broad categories into finer details.
Unlock Deck
Unlock for access to all 75 flashcards in this deck.
Unlock Deck
k this deck
21
Control limits are generally 3 standard deviations from the center line.
Unlock Deck
Unlock for access to all 75 flashcards in this deck.
Unlock Deck
k this deck
22
Which of the following is not a common source of customer feedback?
A)Customer satisfaction measurement efforts
B)Customer choice analysis
C)Customer panels
D)Blogs
E)Advertising agencies
A)Customer satisfaction measurement efforts
B)Customer choice analysis
C)Customer panels
D)Blogs
E)Advertising agencies
Unlock Deck
Unlock for access to all 75 flashcards in this deck.
Unlock Deck
k this deck
23
A quality circle is a way of getting feedback from what group?
A)Customers
B)Employees
C)Suppliers
D)Competitors
E)Supply chain members
A)Customers
B)Employees
C)Suppliers
D)Competitors
E)Supply chain members
Unlock Deck
Unlock for access to all 75 flashcards in this deck.
Unlock Deck
k this deck
24
Making the size of a gas pump nozzle different from that of a diesel pump nozzle is an example of what technique?
A)Mistake-proofing
B)Benchmarking
C)Sampling
D)Brainstorming
E)FMEA
A)Mistake-proofing
B)Benchmarking
C)Sampling
D)Brainstorming
E)FMEA
Unlock Deck
Unlock for access to all 75 flashcards in this deck.
Unlock Deck
k this deck
25
Which of the following actions is not part of the Deming improvement cycle?
A)Plan
B)Study
C)Do
D)Check
E)Act
A)Plan
B)Study
C)Do
D)Check
E)Act
Unlock Deck
Unlock for access to all 75 flashcards in this deck.
Unlock Deck
k this deck
26
Which of the following is a qualitative technique that provides a systematic method for generating a large number of creative problem solving ideas from many different individuals?
A)Quality circles
B)Brainstorming
C)Benchmarking
D)Customer satisfaction
E)Affinity diagrams
A)Quality circles
B)Brainstorming
C)Benchmarking
D)Customer satisfaction
E)Affinity diagrams
Unlock Deck
Unlock for access to all 75 flashcards in this deck.
Unlock Deck
k this deck
27
An R chart is used to track changes in the percentages of a specified attribute over time.
Unlock Deck
Unlock for access to all 75 flashcards in this deck.
Unlock Deck
k this deck
28
Using students from one class would provide a simple random sample for all university students.
Unlock Deck
Unlock for access to all 75 flashcards in this deck.
Unlock Deck
k this deck
29
The central limit theorem states that the shape of the distribution of averages for samples follows a Pareto distribution even if the original distribution was very different.
Unlock Deck
Unlock for access to all 75 flashcards in this deck.
Unlock Deck
k this deck
30
A single point outside of control limits is sufficient to determine a process is out of control.
Unlock Deck
Unlock for access to all 75 flashcards in this deck.
Unlock Deck
k this deck
31
Attribute data is collected by measuring something on a continuous scale.
Unlock Deck
Unlock for access to all 75 flashcards in this deck.
Unlock Deck
k this deck
32
If a quality improvement plan is implemented and then periodically evaluated and it is discovered that the plan did not show improvement,what should be done?
A)Earlier assumptions need to be reevaluated
B)Standardize for the future
C)Celebrate
D)Recap and summarize what was learned
E)Identify the gaps between actual and preferred situations
A)Earlier assumptions need to be reevaluated
B)Standardize for the future
C)Celebrate
D)Recap and summarize what was learned
E)Identify the gaps between actual and preferred situations
Unlock Deck
Unlock for access to all 75 flashcards in this deck.
Unlock Deck
k this deck
33
A tool that provides a systematic approach for identifying all possible failures in a design is described by what acronym?
A)PDPC
B)QFD
C)FMEA
D)DMAIC
E)CPK
A)PDPC
B)QFD
C)FMEA
D)DMAIC
E)CPK
Unlock Deck
Unlock for access to all 75 flashcards in this deck.
Unlock Deck
k this deck
34
Customer feedback is essential for developing any quality improvement plan.
Unlock Deck
Unlock for access to all 75 flashcards in this deck.
Unlock Deck
k this deck
35
A customer choice analysis has been an integral part of quality improvement efforts since the beginning of the quality movement.
Unlock Deck
Unlock for access to all 75 flashcards in this deck.
Unlock Deck
k this deck
36
Which of the following is not generally considered a driver for best practices?
A)Organizational culture
B)Employee skills
C)Recognition systems
D)Customer satisfaction
E)Training programs
A)Organizational culture
B)Employee skills
C)Recognition systems
D)Customer satisfaction
E)Training programs
Unlock Deck
Unlock for access to all 75 flashcards in this deck.
Unlock Deck
k this deck
37
Customer complaints are a key indicator of customer feedback.
Unlock Deck
Unlock for access to all 75 flashcards in this deck.
Unlock Deck
k this deck
38
When one idea branches into two or more subideas,each of which branches into further subideas,the appropriate problem-solving technique is what?
A)Interrelationship diagram
B)Affinity diagram
C)Pareto diagram
D)Tree diagram
E)Fishbone diagram
A)Interrelationship diagram
B)Affinity diagram
C)Pareto diagram
D)Tree diagram
E)Fishbone diagram
Unlock Deck
Unlock for access to all 75 flashcards in this deck.
Unlock Deck
k this deck
39
When only natural variations are present,an SPC chart will seldom show a point outside of control limits.
Unlock Deck
Unlock for access to all 75 flashcards in this deck.
Unlock Deck
k this deck
40
A structured process for comparing business practices is known as what?
A)Customer panels
B)Benchmarking
C)Quality circles
D)Brainstorming
E)Blogging
A)Customer panels
B)Benchmarking
C)Quality circles
D)Brainstorming
E)Blogging
Unlock Deck
Unlock for access to all 75 flashcards in this deck.
Unlock Deck
k this deck
41
Which of the following is a quantitative quality improvement tool?
A)Affinity diagrams
B)Tree diagrams
C)Process decision procharts
D)FMEA
E)SPC chart
A)Affinity diagrams
B)Tree diagrams
C)Process decision procharts
D)FMEA
E)SPC chart
Unlock Deck
Unlock for access to all 75 flashcards in this deck.
Unlock Deck
k this deck
42
Identify three sources of quality improvement ideas.
Unlock Deck
Unlock for access to all 75 flashcards in this deck.
Unlock Deck
k this deck
43
On a SPC chart,if a data point falls outside the control limits,the process is said to be what?
A)Random
B)Special
C)Capable
D)Out of control
E)Scattered
A)Random
B)Special
C)Capable
D)Out of control
E)Scattered
Unlock Deck
Unlock for access to all 75 flashcards in this deck.
Unlock Deck
k this deck
44
What term describes a process for which a prespecified percentage of measurements fall inside the specification limits?
A)Random
B)Special
C)Capable
D)Out of control
E)Scattered
A)Random
B)Special
C)Capable
D)Out of control
E)Scattered
Unlock Deck
Unlock for access to all 75 flashcards in this deck.
Unlock Deck
k this deck
45
If a process is capable of meeting defined tolerances 99.7 percent of the time,the Cpk will be what value?
A)-1.000
B)0
C)0.997
D)1.000
E)1.300
A)-1.000
B)0
C)0.997
D)1.000
E)1.300
Unlock Deck
Unlock for access to all 75 flashcards in this deck.
Unlock Deck
k this deck
46
Attribute data can be tracked on what type of control chart?
A)X bar chart
B)R chart
C)P chart
D)SPC chart
E)Counting chart
A)X bar chart
B)R chart
C)P chart
D)SPC chart
E)Counting chart
Unlock Deck
Unlock for access to all 75 flashcards in this deck.
Unlock Deck
k this deck
47
The first step in any sampling plan is to
A)Clearly define the population of interest
B)Pick a sample size
C)Bias the sample
D)Stratify the sample
E)Pick a quota sample
A)Clearly define the population of interest
B)Pick a sample size
C)Bias the sample
D)Stratify the sample
E)Pick a quota sample
Unlock Deck
Unlock for access to all 75 flashcards in this deck.
Unlock Deck
k this deck
48
Describe three sampling techniques.
Unlock Deck
Unlock for access to all 75 flashcards in this deck.
Unlock Deck
k this deck
49
Describe an SPC chart.
Unlock Deck
Unlock for access to all 75 flashcards in this deck.
Unlock Deck
k this deck
50
Which of the following tools illustrates that a few causes are responsible for the majority of the problems?
A)Check sheet
B)Ishikawa diagram
C)Pareto analysis
D)Control chart
E)Capability analysis
A)Check sheet
B)Ishikawa diagram
C)Pareto analysis
D)Control chart
E)Capability analysis
Unlock Deck
Unlock for access to all 75 flashcards in this deck.
Unlock Deck
k this deck
51
Which of the following is not a rule for determining if a process is out of control?
A)A single point is outside the control limits
B)Nine data points in a row are on the same side of the center line
C)Six points in a row are increasing
D)An obvious pattern persists
E)Three points are on the center line
A)A single point is outside the control limits
B)Nine data points in a row are on the same side of the center line
C)Six points in a row are increasing
D)An obvious pattern persists
E)Three points are on the center line
Unlock Deck
Unlock for access to all 75 flashcards in this deck.
Unlock Deck
k this deck
52
Identify five qualitative quality improvement tools.
Unlock Deck
Unlock for access to all 75 flashcards in this deck.
Unlock Deck
k this deck
53
Typical control limits are how many standard deviations from the mean?
A)0
B)1
C)2
D)3
E)6
A)0
B)1
C)2
D)3
E)6
Unlock Deck
Unlock for access to all 75 flashcards in this deck.
Unlock Deck
k this deck
54
If the upper tolerance limit for the capability index is 1.029 and the lower tolerance limit for the capability index is 1.496,the Cpk for the process is what value?
A)0.067
B)1.000
C)1.029
D)1.496
E)2.525
A)0.067
B)1.000
C)1.029
D)1.496
E)2.525
Unlock Deck
Unlock for access to all 75 flashcards in this deck.
Unlock Deck
k this deck
55
A scatter diagram is used to graph what?
A)Continuous data
B)Pareto data
C)Nonlinear data
D)Pairs of numerical data
E)Qualitative data
A)Continuous data
B)Pareto data
C)Nonlinear data
D)Pairs of numerical data
E)Qualitative data
Unlock Deck
Unlock for access to all 75 flashcards in this deck.
Unlock Deck
k this deck
56
If you conclude that a soda-filling machine is not filling bottles completely,based on the results of a sample,when the bottles actually contain the necessary amount of liquid,is an example of what type of error?
A)Type II error
B)Beta error
C)A false positive
D)Sampling error
E)Standard error
A)Type II error
B)Beta error
C)A false positive
D)Sampling error
E)Standard error
Unlock Deck
Unlock for access to all 75 flashcards in this deck.
Unlock Deck
k this deck
57
Which of the following summarizes a large number of observations in to a few data categories?
A)Bar chart
B)Histogram
C)Check sheet
D)Tree diagram
E)Scattergram
A)Bar chart
B)Histogram
C)Check sheet
D)Tree diagram
E)Scattergram
Unlock Deck
Unlock for access to all 75 flashcards in this deck.
Unlock Deck
k this deck
58
The central limit theorem states that the shape of the distribution of averages for samples follows what kind of distribution?
A)Attribute
B)Poisson
C)Binomial
D)Continuous
E)Normal
A)Attribute
B)Poisson
C)Binomial
D)Continuous
E)Normal
Unlock Deck
Unlock for access to all 75 flashcards in this deck.
Unlock Deck
k this deck
59
Briefly describe a Pareto analysis.
Unlock Deck
Unlock for access to all 75 flashcards in this deck.
Unlock Deck
k this deck
60
Control charts are effective at determining whether the variations that are present in a process are random variations or what?
A)Natural variation
B)Limited variation
C)Assignable variation
D)Controllable variation
E)Present variation
A)Natural variation
B)Limited variation
C)Assignable variation
D)Controllable variation
E)Present variation
Unlock Deck
Unlock for access to all 75 flashcards in this deck.
Unlock Deck
k this deck
61
Describe a Type I error and a Type II error.
Unlock Deck
Unlock for access to all 75 flashcards in this deck.
Unlock Deck
k this deck
62
A continuous process cuts pipe into lengths of 79 inches.Five samples of six observations each have been taken,and the results are listed below.Assuming that the standard deviation of the individual data points is 0.62 and the mean of the sample averages is 78.8,compute the control limits for the
Unlock Deck
Unlock for access to all 75 flashcards in this deck.
Unlock Deck
k this deck
63
Briefly describe the central limit theorem.
Unlock Deck
Unlock for access to all 75 flashcards in this deck.
Unlock Deck
k this deck
64
Provide three rules for identifying if a process is out of control,in addition to a single point being outside of the control limits.
Unlock Deck
Unlock for access to all 75 flashcards in this deck.
Unlock Deck
k this deck
65
Prepare a scatter diagram for the following data.
Unlock Deck
Unlock for access to all 75 flashcards in this deck.
Unlock Deck
k this deck
66
Air pressure must be in a tight range for the proper performance of aerosol air fresheners.Engineering specifications call for 50 psi of pressure with an upper tolerance of 55 psi and a lower tolerance of 45 psi.A sample from the previous week's production had an average 51 psi and a standard deviation of 1.5 psi.What is the capability of the process?
Unlock Deck
Unlock for access to all 75 flashcards in this deck.
Unlock Deck
k this deck
67
A machine shop needs the diameter of the castings it purchases between 1.000 inch and 1.060 inches to insure that the surface finish will be acceptable.A large sample of castings found the mean diameter was 1.025 inches with a standard deviation of 0.008 inches.Calculate the process capability index.
Unlock Deck
Unlock for access to all 75 flashcards in this deck.
Unlock Deck
k this deck
68
Describe the nine steps in benchmarking.
Unlock Deck
Unlock for access to all 75 flashcards in this deck.
Unlock Deck
k this deck
69
A continuous process cuts pipe into lengths of 79 inches.Five samples of six observations each have been taken,and the results are listed below.Calculate the standard deviation of the individual data points.
Unlock Deck
Unlock for access to all 75 flashcards in this deck.
Unlock Deck
k this deck
70
A continuous process cuts pipe into lengths of 79 inches.Five samples of six observations each have been taken,and the results are listed below.Calculate the control limits for the R chart.
Unlock Deck
Unlock for access to all 75 flashcards in this deck.
Unlock Deck
k this deck
71
A collection of defective metal castings were studied and classified as follows:
Unlock Deck
Unlock for access to all 75 flashcards in this deck.
Unlock Deck
k this deck
72
Describe the implications of having a Cpk equal to 1,less than 1,or greater than 1.
Unlock Deck
Unlock for access to all 75 flashcards in this deck.
Unlock Deck
k this deck
73
A continuous process cuts pipe into lengths of 79 inches.Five samples of six observations each have been taken,and the results are listed below.Calculate the
Unlock Deck
Unlock for access to all 75 flashcards in this deck.
Unlock Deck
k this deck
74
Repeated samples of 150 ball point pen housings are inspected to determine if the housing is out of round or the printing is readable.If either condition exists,it is nonconforming.The following sample information was collected.
Unlock Deck
Unlock for access to all 75 flashcards in this deck.
Unlock Deck
k this deck
75
In a control chart application,a study showed the overall mean of 15 samples consisting of 9 observations per sample as 30.0.The standard deviation of the individual data points was 1.87.The average range was 5.5.Calculate the appropriate control limits.
Unlock Deck
Unlock for access to all 75 flashcards in this deck.
Unlock Deck
k this deck
Unlock Deck
Unlock for access to all 75 flashcards in this deck.


