Deck 13: Correlation and Linear Regression
Full screen (f)
Question
Question
Question
In regression analysis,error is defined as (  - Y).
- Y).
- Y). Question
Question
Question
Question
Question
Question
Question
Question
Question
Question
Question
Question
Question
Question
Question
Question
Question
Question
Question
Question
Question
Question
Question
Question
Question
Question
Question
Question
Question
Question
Question
Question
Question
Question
Question
Question
Question
Question
Question
Question
Question
Assume the least squares equation is  = 10 + 20X. What does the value of 10 in the equation indicate?
A)When X = 0,Y = 10.
B)X increases by 10 for each unit increase in Y.
C)Y increases by 10 for each unit increase in X.
D)It is the error of estimation.
= 10 + 20X. What does the value of 10 in the equation indicate?A)When X = 0,Y = 10.
B)X increases by 10 for each unit increase in Y.
C)Y increases by 10 for each unit increase in X.
D)It is the error of estimation.
Question
A sales manager for an advertising agency believes there is a relationship between the number of contacts that a salesperson makes and the amount of sales dollars earned. A regression analysis shows the following results:  What is the slope of the linear equation?
A)−12.201
B)2.195
C)−1.860
D)12.505
What is the slope of the linear equation?A)−12.201
B)2.195
C)−1.860
D)12.505
Question
Question
Question
Question
What is the general form of the regression equation?
A) = ab
= ab
B) = a + (bX)
C) = (a + b)X
D) = abX
= abX
A)
= abB)
= a + (bX)C)
= (a + b)XD)
= abX Question
A sales manager for an advertising agency believes that there is a relationship between the number of contacts that a salesperson makes and the amount of sales dollars earned. A regression analysis shows the following results:  What is the Y-intercept of the linear equation?
A)−12.201
B)2.195
C)−1.860
D)12.505
What is the Y-intercept of the linear equation?A)−12.201
B)2.195
C)−1.860
D)12.505
Question
In the least squares equation,  = 10 + 20X,the value of 20 indicates ________.
A)the Y-intercept increases by 20 units for each unit increase in X
B)that Y increases by 20 units for each unit increase in X
C)that X increases by 20 units for each unit increase in Y
D)the error in prediction
= 10 + 20X,the value of 20 indicates ________.A)the Y-intercept increases by 20 units for each unit increase in X
B)that Y increases by 20 units for each unit increase in X
C)that X increases by 20 units for each unit increase in Y
D)the error in prediction
Question
Question
Question
Question
In the equation,  = a + bX,what is
  ?
?
A)It is the slope of the line.
B)It is the Y-intercept.
C)It is the predicted value of Y,given a specific X value.
D)It is the value of Y when X = 0.
= a + bX,what is ?A)It is the slope of the line.
B)It is the Y-intercept.
C)It is the predicted value of Y,given a specific X value.
D)It is the value of Y when X = 0.
Question
A sales manager for an advertising agency believes there is a relationship between the number of contacts that a salesperson makes and the amount of sales dollars earned. A regression analysis shows the following results:  What is the standard error of the slope?
A)0.176
B)6.560
C)−12.201
D)12.505
What is the standard error of the slope?A)0.176
B)6.560
C)−12.201
D)12.505
Question
Question
Question
Question
Given the least squares regression equation,  = 1,202 + 1,133X,when X = 3,what does
  equal?
A)5,734
B)8,000
C)4,601
D)4,050
= 1,202 + 1,133X,when X = 3,what does equal?A)5,734
B)8,000
C)4,601
D)4,050
Question
Question
Using the following information: 
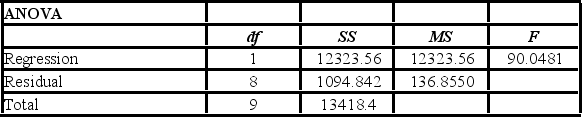 What is the standard error of the estimate?
A)136.8552
B)1094.842
C)11.6985
D)13418.4
What is the standard error of the estimate?A)136.8552
B)1094.842
C)11.6985
D)13418.4
Question
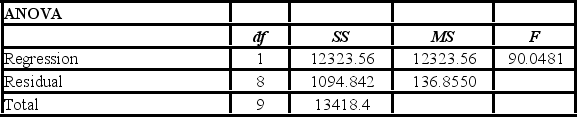
Using the following information: 
 The regression analysis can be summarized as follows:
A)No significant relationship exists between the variables.
B)A significant negative relationship exists between the variables.
C)A significant positive relationship exists between the variables.
D)For every unit increase in X,Y decreases by 12.8094.
The regression analysis can be summarized as follows:A)No significant relationship exists between the variables.
B)A significant negative relationship exists between the variables.
C)A significant positive relationship exists between the variables.
D)For every unit increase in X,Y decreases by 12.8094.
Question
A sales manager for an advertising agency believes there is a relationship between the number of contacts that a salesperson makes and the amount of sales dollars earned. A regression analysis shows the following results: 

 = 33.4.
  = 2,814.4. The 95% prediction interval for a particular person making 30 calls is ________.
A)55.8,51.5
B)51.4,55.9
C)46.7,60.6
D)31.1,76.2
= 33.4. = 2,814.4. The 95% prediction interval for a particular person making 30 calls is ________.A)55.8,51.5
B)51.4,55.9
C)46.7,60.6
D)31.1,76.2
Question
Using the following information: 
 If testing the hypothesis H0: ρ = 0,the computed t-statistic is ________.
A)9.49
B)8.84
C)8.18
D)Cannot be computed
If testing the hypothesis H0: ρ = 0,the computed t-statistic is ________.A)9.49
B)8.84
C)8.18
D)Cannot be computed
Question
Using the following information: 
 What is the coefficient of determination? Round the percentage to one decimal point.
A)91.8%
B)8.2%
C)90.0%
D)136.9%
What is the coefficient of determination? Round the percentage to one decimal point.A)91.8%
B)8.2%
C)90.0%
D)136.9%
Question
A sales manager for an advertising agency believes there is a relationship between the number of contacts that a salesperson makes and the amount of sales dollars earned. A regression ANOVA shows the following results:  What is the value of the coefficient of correlation?
A)+0.6317
B)+0.9754
C)−0.9754
D)+0.9513
What is the value of the coefficient of correlation?A)+0.6317
B)+0.9754
C)−0.9754
D)+0.9513
Question
A sales manager for an advertising agency believes there is a relationship between the number of contacts that a salesperson makes and the amount of sales dollars earned. A regression analysis shows the following results:  What is the regression equation?
A) = 2.195 − 12.201X
B) = −12.201 + 2.195X
C) = 12.201 + 2.195X
D) = 2.195 + 12.201X
What is the regression equation?A)
= 2.195 − 12.201XB)
= −12.201 + 2.195XC)
= 12.201 + 2.195XD)
= 2.195 + 12.201X Question
Question
Using the following information: 
 Estimate the value of
  when X = 4.
A)10.45
B)3.73
C)8.718
D)−4.092
Estimate the value of when X = 4.A)10.45
B)3.73
C)8.718
D)−4.092
Question
Consider the following regression analysis between sales (Y in $1,000)and social media advertising (X in dollars).  = 55,000 + 7X The regression equation implies that an ________.
A)increase of $7 in advertising is associated with an increase of $7,000 in sales
B)increase of $1 in advertising is associated with an increase of $7 in sales
C)increase of $1 in advertising is associated with an increase of $62,000 in sales
D)increase of $1 in advertising is associated with an increase of $7,000 in sales
= 55,000 + 7X The regression equation implies that an ________.A)increase of $7 in advertising is associated with an increase of $7,000 in sales
B)increase of $1 in advertising is associated with an increase of $7 in sales
C)increase of $1 in advertising is associated with an increase of $62,000 in sales
D)increase of $1 in advertising is associated with an increase of $7,000 in sales
Question
A regression analysis yields the following information:  = 2.21 + 1.49X; n = 10;
  = 166;
  = 32;
= 32;  = 134;
  = 31.6. Compute the 95% confidence interval when X = 4.
A)0.0,4.05
B)4.15,12.25
C)2.67,5.33
D)6.842,9.497
= 2.21 + 1.49X; n = 10; = 166; = 32; = 134; = 31.6. Compute the 95% confidence interval when X = 4.A)0.0,4.05
B)4.15,12.25
C)2.67,5.33
D)6.842,9.497
Question
Using the following information: 
 The regression equation is ________.
A) = 2.1794 − 12.8094X
B) = −12.8094 + 2.1794X
C)12.8094X = 2.1794
D)X = −12.8094 + 2.1794
The regression equation is ________.A)
= 2.1794 − 12.8094XB)
= −12.8094 + 2.1794XC)12.8094X = 2.1794
D)X = −12.8094 + 2.1794
Question
A regression analysis yields the following information:  = 2.21 + 1.49X; n = 10;
  = 166;
  = 32;
= 32;  = 134;
  = 31.6. Compute the 95% prediction interval when X = 4.
A)0.0,4.05
B)2.67,5.33
C)4.118,12.226
D)6.873,9.527
= 2.21 + 1.49X; n = 10; = 166; = 32; = 134; = 31.6. Compute the 95% prediction interval when X = 4.A)0.0,4.05
B)2.67,5.33
C)4.118,12.226
D)6.873,9.527
Question
A sales manager for an advertising agency believes there is a relationship between the number of contacts that a salesperson makes and the amount of sales dollars earned. A regression analysis shows the following results: 

 = 33.4.
  = 2814.4. Rounding to one decimal place,the 95% confidence interval for 30 calls is ________.
A)55.8,51.5
B)51.4,55.9
C)46.7,60.6
D)31.1,76.2
= 33.4. = 2814.4. Rounding to one decimal place,the 95% confidence interval for 30 calls is ________.A)55.8,51.5
B)51.4,55.9
C)46.7,60.6
D)31.1,76.2
Question
A sales manager for an advertising agency believes there is a relationship between the number of contacts that a salesperson makes and the amount of sales dollars earned. A regression ANOVA shows the following results:  What is the value of the coefficient of determination?
A)−0.9513
B)0.9754
C)0.6319
D)0.9513
What is the value of the coefficient of determination?A)−0.9513
B)0.9754
C)0.6319
D)0.9513
Question
Using the following information: 
 What is the correlation coefficient?
A)0.9184
B)0.9583
C)−0.9583
D)0.9004
What is the correlation coefficient?A)0.9184
B)0.9583
C)−0.9583
D)0.9004
Question
A sales manager for an advertising agency believes there is a relationship between the number of contacts that a salesperson makes and the amount of sales dollars earned. A regression ANOVA shows the following results:  What is the value of the standard error of estimate?
A)9.310
B)8.778
C)8.328
D)86.68
What is the value of the standard error of estimate?A)9.310
B)8.778
C)8.328
D)86.68
Question
Question
A sales manager for an advertising agency believes there is a relationship between the number of contacts that a salesperson makes and the amount of sales dollars earned. A regression analysis shows the following results:  What is the decision regarding the hypothesis if the p-value for the slope equals zero?
A)Fail to reject the null hypothesis.
B)Fail to reject the alternative hypothesis.
C)Reject the null hypothesis.
D)Reject the alternative hypothesis.
What is the decision regarding the hypothesis if the p-value for the slope equals zero?A)Fail to reject the null hypothesis.
B)Fail to reject the alternative hypothesis.
C)Reject the null hypothesis.
D)Reject the alternative hypothesis.

Unlock Deck
Sign up to unlock the cards in this deck!
Unlock Deck
Unlock Deck
1/84
Play
Full screen (f)
Deck 13: Correlation and Linear Regression
1
The values of a and b in the regression equation are called the regression coefficients.
True
2
An economist is interested in predicting the unemployment rate based on gross domestic product. Because the economist is interested in predicting unemployment,the independent variable is gross domestic product.
True
3
In regression analysis,error is defined as ( - Y).
- Y).False
4
The coefficient of determination is the square root of the coefficient of correlation.
Unlock Deck
Unlock for access to all 84 flashcards in this deck.
Unlock Deck
k this deck
5
What is the chart called when the paired data (the dependent and independent variables)are plotted?
A)A scatter diagram
B)A bar chart
C)A pie chart
D)A histogram
A)A scatter diagram
B)A bar chart
C)A pie chart
D)A histogram
Unlock Deck
Unlock for access to all 84 flashcards in this deck.
Unlock Deck
k this deck
6
What is the range of values for a coefficient of correlation?
A)0 to +1.0
B)−3 to +3 inclusive
C)−1.0 to +1.0 inclusive
D)Unlimited range
A)0 to +1.0
B)−3 to +3 inclusive
C)−1.0 to +1.0 inclusive
D)Unlimited range
Unlock Deck
Unlock for access to all 84 flashcards in this deck.
Unlock Deck
k this deck
7
What does a coefficient of correlation of 0.70 infer?
A)There is almost no correlation because 0.70 is close to 1.0.
B)Seventy percent of the variation in one variable is explained by the other variable.
C)The coefficient of determination is 0.49.
D)The coefficient of nondetermination is 0.30.
A)There is almost no correlation because 0.70 is close to 1.0.
B)Seventy percent of the variation in one variable is explained by the other variable.
C)The coefficient of determination is 0.49.
D)The coefficient of nondetermination is 0.30.
Unlock Deck
Unlock for access to all 84 flashcards in this deck.
Unlock Deck
k this deck
8
Because the coefficient of determination is expressed as a percent,its value is between 0% and 100%.
Unlock Deck
Unlock for access to all 84 flashcards in this deck.
Unlock Deck
k this deck
9
The regression equation is used to estimate a value of the dependent variable Y based on a selected value of the independent variable X.
Unlock Deck
Unlock for access to all 84 flashcards in this deck.
Unlock Deck
k this deck
10
One assumption underlying linear regression is that the X values are normally distributed.
Unlock Deck
Unlock for access to all 84 flashcards in this deck.
Unlock Deck
k this deck
11
The strength of the correlation between two variables depends on the sign of the coefficient of correlation.
Unlock Deck
Unlock for access to all 84 flashcards in this deck.
Unlock Deck
k this deck
12
The standard error of estimate measures the accuracy of a prediction.
Unlock Deck
Unlock for access to all 84 flashcards in this deck.
Unlock Deck
k this deck
13
In regression analysis,what is the predictor variable called?
A)Independent variable
B)Dependent variable
C)Correlation variable
D)Variable of determination
A)Independent variable
B)Dependent variable
C)Correlation variable
D)Variable of determination
Unlock Deck
Unlock for access to all 84 flashcards in this deck.
Unlock Deck
k this deck
14
The hypothesis to test the slope of a regression equation is H0: α = 0.
Unlock Deck
Unlock for access to all 84 flashcards in this deck.
Unlock Deck
k this deck
15
The coefficient of determination is the proportion of total variation in Y that is explained by X.
Unlock Deck
Unlock for access to all 84 flashcards in this deck.
Unlock Deck
k this deck
16
The least squares technique minimizes the sum of the squares of the vertical distances between the actual Y values and the predicted values of Y.
Unlock Deck
Unlock for access to all 84 flashcards in this deck.
Unlock Deck
k this deck
17
A scatter diagram is a graph that portrays the correlation between a dependent variable and an independent variable.
Unlock Deck
Unlock for access to all 84 flashcards in this deck.
Unlock Deck
k this deck
18
Correlation analysis is a statistical technique used to measure the strength of the relationship between two variables.
Unlock Deck
Unlock for access to all 84 flashcards in this deck.
Unlock Deck
k this deck
19
Which of the following statements regarding the coefficient of correlation is true?
A)It ranges from 0.0 to + 1.0 inclusive.
B)It describes the relationship between two variables.
C)A value of 0.00 indicates two variables are related.
D)It is calculated as the square of the slope.
A)It ranges from 0.0 to + 1.0 inclusive.
B)It describes the relationship between two variables.
C)A value of 0.00 indicates two variables are related.
D)It is calculated as the square of the slope.
Unlock Deck
Unlock for access to all 84 flashcards in this deck.
Unlock Deck
k this deck
20
A confidence interval can be determined for the mean value of Y for a given value of X.
Unlock Deck
Unlock for access to all 84 flashcards in this deck.
Unlock Deck
k this deck
21
If the coefficient of determination is 0.94,what can we say about the relationship between two variables?
A)The strength of the relationship is 0.94.
B)The direction of the relationship is positive.
C)Ninety-four percent of the total variation of the dependent variable is explained by the independent variable.
D)The direction of the relationship is negative.
A)The strength of the relationship is 0.94.
B)The direction of the relationship is positive.
C)Ninety-four percent of the total variation of the dependent variable is explained by the independent variable.
D)The direction of the relationship is negative.
Unlock Deck
Unlock for access to all 84 flashcards in this deck.
Unlock Deck
k this deck
22
In the regression equation,what does the letter Y represent?
A)The Y-intercept
B)The slope of the line
C)The independent variable
D)The dependent variable
A)The Y-intercept
B)The slope of the line
C)The independent variable
D)The dependent variable
Unlock Deck
Unlock for access to all 84 flashcards in this deck.
Unlock Deck
k this deck
23
What is the test statistic to test the significance of the slope in a regression equation?
A)z-statistic
B)F-statistic
C)t-statistic
D)π-statistic
A)z-statistic
B)F-statistic
C)t-statistic
D)π-statistic
Unlock Deck
Unlock for access to all 84 flashcards in this deck.
Unlock Deck
k this deck
24
If the correlation coefficient between two variables,X and Y,equals zero,what can be said of the variables X and Y?
A)The variables are not related.
B)The variables are dependent on each other.
C)The variables are highly related.
D)X causes Y.
A)The variables are not related.
B)The variables are dependent on each other.
C)The variables are highly related.
D)X causes Y.
Unlock Deck
Unlock for access to all 84 flashcards in this deck.
Unlock Deck
k this deck
25
What does the coefficient of determination equal if r = 0.89?
A)0.9412
B)0.0121
C)0.7921
D)0.1100
A)0.9412
B)0.0121
C)0.7921
D)0.1100
Unlock Deck
Unlock for access to all 84 flashcards in this deck.
Unlock Deck
k this deck
26
What is the null hypothesis to test the significance of the slope in a regression equation?
A)H0: β = 0
B)H0: β ≠ 0
C)H0: β ≤ 0
D)H0: β ≥ 0
A)H0: β = 0
B)H0: β ≠ 0
C)H0: β ≤ 0
D)H0: β ≥ 0
Unlock Deck
Unlock for access to all 84 flashcards in this deck.
Unlock Deck
k this deck
27
The regression equation is Ŷ = 29.29 − 0.96X,the sample size is 8,and the standard error of the slope is 0.22. What is the test statistic to test the significance of the slope?
A)z = −4.364
B)z = +4.364
C)t = −4.364
D)t = −0.960
A)z = −4.364
B)z = +4.364
C)t = −4.364
D)t = −0.960
Unlock Deck
Unlock for access to all 84 flashcards in this deck.
Unlock Deck
k this deck
28
The regression equation is Ŷ = 29.29 − 0.96X,the sample size is 8,and the standard error of the slope is 0.22. What is the critical value to test the significance of the slope at the 0.01 significance level?
A)z = +2.576
B)z = +3.707
C)t = +3.355
D)t = ±3.707
A)z = +2.576
B)z = +3.707
C)t = +3.355
D)t = ±3.707
Unlock Deck
Unlock for access to all 84 flashcards in this deck.
Unlock Deck
k this deck
29
If we reject the null hypothesis,H0: ρ = 0 ,what can we conclude about the population correlation coefficient?
A)It is zero.
B)It could be zero.
C)It is not zero.
D)It equals the computed sample correlation.
A)It is zero.
B)It could be zero.
C)It is not zero.
D)It equals the computed sample correlation.
Unlock Deck
Unlock for access to all 84 flashcards in this deck.
Unlock Deck
k this deck
30
If the correlation between two variables is close to one,the association between the variables is ________.
A)strong
B)moderate
C)weak
D)zero
A)strong
B)moderate
C)weak
D)zero
Unlock Deck
Unlock for access to all 84 flashcards in this deck.
Unlock Deck
k this deck
31
What is the range of values for the coefficient of determination?
A)−1 to +1 inclusive
B)−100% to +100% inclusive
C)−100% to 0% inclusive
D)0% to 100% inclusive
A)−1 to +1 inclusive
B)−100% to +100% inclusive
C)−100% to 0% inclusive
D)0% to 100% inclusive
Unlock Deck
Unlock for access to all 84 flashcards in this deck.
Unlock Deck
k this deck
32
The Pearson product-moment correlation coefficient,r,requires that variables be measured with ________.
A)an interval or ratio scale
B)an ordinal or ratio scale
C)a nominal or ordinal scale
D)a nominal or ratio scale
A)an interval or ratio scale
B)an ordinal or ratio scale
C)a nominal or ordinal scale
D)a nominal or ratio scale
Unlock Deck
Unlock for access to all 84 flashcards in this deck.
Unlock Deck
k this deck
33
A hypothesis test is conducted at the 0.05 level of significance to test whether or not the population correlation is zero. If the sample consists of 25 observations and the correlation coefficient is 0.60,what is the computed value of the test statistic? Round to two decimal places.
A)1.96
B)2.07
C)2.94
D)3.60
A)1.96
B)2.07
C)2.94
D)3.60
Unlock Deck
Unlock for access to all 84 flashcards in this deck.
Unlock Deck
k this deck
34
If r = 0.65,what does the coefficient of determination equal?
A)0.1945
B)0.4225
C)0.5778
D)0.8061
A)0.1945
B)0.4225
C)0.5778
D)0.8061
Unlock Deck
Unlock for access to all 84 flashcards in this deck.
Unlock Deck
k this deck
35
What is the alternate hypothesis to test the significance of the slope in a regression equation?
A)H1: β = 0
B)H1: β ≠ 0
C)H1: β ≤ 0
D)H1: β ≥ 0
A)H1: β = 0
B)H1: β ≠ 0
C)H1: β ≤ 0
D)H1: β ≥ 0
Unlock Deck
Unlock for access to all 84 flashcards in this deck.
Unlock Deck
k this deck
36
In the regression equation,what does the letter b represent?
A)The Y-intercept
B)The slope of the line
C)Any value of the independent variable that is selected
D)The value of Y when X = 0
A)The Y-intercept
B)The slope of the line
C)Any value of the independent variable that is selected
D)The value of Y when X = 0
Unlock Deck
Unlock for access to all 84 flashcards in this deck.
Unlock Deck
k this deck
37
Which value of r indicates a stronger correlation than 0.40?
A)−0.30
B)−0.80
C)+0.38
D)0
A)−0.30
B)−0.80
C)+0.38
D)0
Unlock Deck
Unlock for access to all 84 flashcards in this deck.
Unlock Deck
k this deck
38
In the regression equation,what does the letter a represent?
A)The Y-intercept
B)The slope of the line
C)Any value of the independent variable that is selected
D)An error
A)The Y-intercept
B)The slope of the line
C)Any value of the independent variable that is selected
D)An error
Unlock Deck
Unlock for access to all 84 flashcards in this deck.
Unlock Deck
k this deck
39
What are the degrees of freedom used to test the significance of the slope in a simple linear regression equation?
A)n − 1
B)n − 2
C)n − 1,n − 2
D)(n − 1)(n − 2)
A)n − 1
B)n − 2
C)n − 1,n − 2
D)(n − 1)(n − 2)
Unlock Deck
Unlock for access to all 84 flashcards in this deck.
Unlock Deck
k this deck
40
In the regression equation,what does the letter X represent?
A)The Y-intercept
B)The slope of the line
C)The independent variable
D)The dependent variable
A)The Y-intercept
B)The slope of the line
C)The independent variable
D)The dependent variable
Unlock Deck
Unlock for access to all 84 flashcards in this deck.
Unlock Deck
k this deck
41
Which of the following is the same between a confidence interval and a prediction interval?
A)The formulas are the same.
B)They both use the standard error of estimate.
C)They both provide a confidence interval for the mean.
D)A confidence interval and prediction interval are the same width.
A)The formulas are the same.
B)They both use the standard error of estimate.
C)They both provide a confidence interval for the mean.
D)A confidence interval and prediction interval are the same width.
Unlock Deck
Unlock for access to all 84 flashcards in this deck.
Unlock Deck
k this deck
42
Which of the following is true about the standard error of estimate?
A)It is a measure of the accuracy of the prediction.
B)It is based on squared vertical deviations between Y and X.
C)It can be negative.
D)It is calculated using the regression mean square.
A)It is a measure of the accuracy of the prediction.
B)It is based on squared vertical deviations between Y and X.
C)It can be negative.
D)It is calculated using the regression mean square.
Unlock Deck
Unlock for access to all 84 flashcards in this deck.
Unlock Deck
k this deck
43
A sales manager for an advertising agency believes that there is a relationship between the number of contacts that a salesperson makes and the amount of sales dollars earned. What is the independent variable?
A)Salesperson
B)Number of contacts
C)Amount of sales
D)Sales manager
A)Salesperson
B)Number of contacts
C)Amount of sales
D)Sales manager
Unlock Deck
Unlock for access to all 84 flashcards in this deck.
Unlock Deck
k this deck
44
Assume the least squares equation is = 10 + 20X. What does the value of 10 in the equation indicate?
A)When X = 0,Y = 10.
B)X increases by 10 for each unit increase in Y.
C)Y increases by 10 for each unit increase in X.
D)It is the error of estimation.
= 10 + 20X. What does the value of 10 in the equation indicate?A)When X = 0,Y = 10.
B)X increases by 10 for each unit increase in Y.
C)Y increases by 10 for each unit increase in X.
D)It is the error of estimation.
Unlock Deck
Unlock for access to all 84 flashcards in this deck.
Unlock Deck
k this deck
45
A sales manager for an advertising agency believes there is a relationship between the number of contacts that a salesperson makes and the amount of sales dollars earned. A regression analysis shows the following results: What is the slope of the linear equation?
A)−12.201
B)2.195
C)−1.860
D)12.505
What is the slope of the linear equation?A)−12.201
B)2.195
C)−1.860
D)12.505
Unlock Deck
Unlock for access to all 84 flashcards in this deck.
Unlock Deck
k this deck
46
The regression equation is Ŷ = 30 + 2.56X,the sample size is 14,and the standard error of the slope is 0.97. What is the critical value to test the significance of the slope at the 0.05 significance level?
A)z = ±1.96
B)t = ±2.179
C)t = ±2.145
D)t = +2.145
A)z = ±1.96
B)t = ±2.179
C)t = ±2.145
D)t = +2.145
Unlock Deck
Unlock for access to all 84 flashcards in this deck.
Unlock Deck
k this deck
47
Which of the following are true assumptions underlying linear regression? (1)For each value of X,there is a group of Y values that is normally distributed.
(2)The means of these normal distributions of Y values all lie on the regression line.
(3)The standard deviations of these normal distributions are equal.
A)Only (1)
B)Only (2)
C)Only (3)
D)All of them
(2)The means of these normal distributions of Y values all lie on the regression line.
(3)The standard deviations of these normal distributions are equal.
A)Only (1)
B)Only (2)
C)Only (3)
D)All of them
Unlock Deck
Unlock for access to all 84 flashcards in this deck.
Unlock Deck
k this deck
48
If all the plots on a scatter diagram lie on a straight line,what is the standard error of estimate?
A)−1
B)+1
C)0
D)Infinity
A)−1
B)+1
C)0
D)Infinity
Unlock Deck
Unlock for access to all 84 flashcards in this deck.
Unlock Deck
k this deck
49
What is the general form of the regression equation?
A) = ab
B) = a + (bX)
C) = (a + b)X
D) = abX
A)
= abB)
= a + (bX)C)
= (a + b)XD)
= abX Unlock Deck
Unlock for access to all 84 flashcards in this deck.
Unlock Deck
k this deck
50
A sales manager for an advertising agency believes that there is a relationship between the number of contacts that a salesperson makes and the amount of sales dollars earned. A regression analysis shows the following results: What is the Y-intercept of the linear equation?
A)−12.201
B)2.195
C)−1.860
D)12.505
What is the Y-intercept of the linear equation?A)−12.201
B)2.195
C)−1.860
D)12.505
Unlock Deck
Unlock for access to all 84 flashcards in this deck.
Unlock Deck
k this deck
51
In the least squares equation, = 10 + 20X,the value of 20 indicates ________.
A)the Y-intercept increases by 20 units for each unit increase in X
B)that Y increases by 20 units for each unit increase in X
C)that X increases by 20 units for each unit increase in Y
D)the error in prediction
= 10 + 20X,the value of 20 indicates ________.A)the Y-intercept increases by 20 units for each unit increase in X
B)that Y increases by 20 units for each unit increase in X
C)that X increases by 20 units for each unit increase in Y
D)the error in prediction
Unlock Deck
Unlock for access to all 84 flashcards in this deck.
Unlock Deck
k this deck
52
A sales manager for an advertising agency believes that there is a relationship between the number of contacts that a salesperson makes and the amount of sales dollars earned. What is the dependent variable?
A)Salesperson
B)Number of contacts
C)Amount of sales dollars
D)Sales manager
A)Salesperson
B)Number of contacts
C)Amount of sales dollars
D)Sales manager
Unlock Deck
Unlock for access to all 84 flashcards in this deck.
Unlock Deck
k this deck
53
Based on the regression equation,we can ________.
A)predict the value of the dependent variable given a value of the independent variable
B)predict the value of the independent variable given a value of the dependent variable
C)measure the association between two variables
D)measure cause and effect
A)predict the value of the dependent variable given a value of the independent variable
B)predict the value of the independent variable given a value of the dependent variable
C)measure the association between two variables
D)measure cause and effect
Unlock Deck
Unlock for access to all 84 flashcards in this deck.
Unlock Deck
k this deck
54
When comparing the 95% confidence and prediction intervals for a given regression analysis ________.
A)the confidence interval is wider than a prediction interval
B)the confidence interval is narrower than a prediction interval
C)there is no difference between confidence and prediction intervals
D)the prediction interval has a higher level of confidence
A)the confidence interval is wider than a prediction interval
B)the confidence interval is narrower than a prediction interval
C)there is no difference between confidence and prediction intervals
D)the prediction interval has a higher level of confidence
Unlock Deck
Unlock for access to all 84 flashcards in this deck.
Unlock Deck
k this deck
55
In the equation, = a + bX,what is ?
A)It is the slope of the line.
B)It is the Y-intercept.
C)It is the predicted value of Y,given a specific X value.
D)It is the value of Y when X = 0.
= a + bX,what is ?A)It is the slope of the line.
B)It is the Y-intercept.
C)It is the predicted value of Y,given a specific X value.
D)It is the value of Y when X = 0.
Unlock Deck
Unlock for access to all 84 flashcards in this deck.
Unlock Deck
k this deck
56
A sales manager for an advertising agency believes there is a relationship between the number of contacts that a salesperson makes and the amount of sales dollars earned. A regression analysis shows the following results: What is the standard error of the slope?
A)0.176
B)6.560
C)−12.201
D)12.505
What is the standard error of the slope?A)0.176
B)6.560
C)−12.201
D)12.505
Unlock Deck
Unlock for access to all 84 flashcards in this deck.
Unlock Deck
k this deck
57
In regression,the difference between the confidence interval and prediction interval formulas is ________.
A)the prediction interval is the square root of the confidence interval
B)the addition of 1 to the quantity under the radical sign
C)the prediction interval uses r2 and the confidence interval uses r
D)no difference
A)the prediction interval is the square root of the confidence interval
B)the addition of 1 to the quantity under the radical sign
C)the prediction interval uses r2 and the confidence interval uses r
D)no difference
Unlock Deck
Unlock for access to all 84 flashcards in this deck.
Unlock Deck
k this deck
58
The regression equation is Ŷ = 30 + 2.56X,the sample size is 14,and the standard error of the slope is 0.97. What is the test statistic to test the significance of the slope?
A)z = −2.560
B)z = +2.639
C)t = +2.560
D)t = +2.639
A)z = −2.560
B)z = +2.639
C)t = +2.560
D)t = +2.639
Unlock Deck
Unlock for access to all 84 flashcards in this deck.
Unlock Deck
k this deck
59
What is the variable used to predict another variable called?
A)Independent variable
B)Dependent variable
C)Important variable
D)Causal variable
A)Independent variable
B)Dependent variable
C)Important variable
D)Causal variable
Unlock Deck
Unlock for access to all 84 flashcards in this deck.
Unlock Deck
k this deck
60
Given the least squares regression equation, = 1,202 + 1,133X,when X = 3,what does equal?
A)5,734
B)8,000
C)4,601
D)4,050
= 1,202 + 1,133X,when X = 3,what does equal?A)5,734
B)8,000
C)4,601
D)4,050
Unlock Deck
Unlock for access to all 84 flashcards in this deck.
Unlock Deck
k this deck
61
The value of the correlation coefficient (r)________.
A)can be equal to the value of the coefficient of determination (r2)
B)can never be equal to the value of the coefficient of determination (r2)
C)can range from −2.0 to +2.0
D)is generally larger than the value of the coefficient of determination
A)can be equal to the value of the coefficient of determination (r2)
B)can never be equal to the value of the coefficient of determination (r2)
C)can range from −2.0 to +2.0
D)is generally larger than the value of the coefficient of determination
Unlock Deck
Unlock for access to all 84 flashcards in this deck.
Unlock Deck
k this deck
62
Using the following information: What is the standard error of the estimate?
A)136.8552
B)1094.842
C)11.6985
D)13418.4
What is the standard error of the estimate?A)136.8552
B)1094.842
C)11.6985
D)13418.4
Unlock Deck
Unlock for access to all 84 flashcards in this deck.
Unlock Deck
k this deck
63
Using the following information: The regression analysis can be summarized as follows:
A)No significant relationship exists between the variables.
B)A significant negative relationship exists between the variables.
C)A significant positive relationship exists between the variables.
D)For every unit increase in X,Y decreases by 12.8094.
The regression analysis can be summarized as follows:A)No significant relationship exists between the variables.
B)A significant negative relationship exists between the variables.
C)A significant positive relationship exists between the variables.
D)For every unit increase in X,Y decreases by 12.8094.
Unlock Deck
Unlock for access to all 84 flashcards in this deck.
Unlock Deck
k this deck
64
A sales manager for an advertising agency believes there is a relationship between the number of contacts that a salesperson makes and the amount of sales dollars earned. A regression analysis shows the following results: = 33.4. = 2,814.4. The 95% prediction interval for a particular person making 30 calls is ________.
A)55.8,51.5
B)51.4,55.9
C)46.7,60.6
D)31.1,76.2
= 33.4. = 2,814.4. The 95% prediction interval for a particular person making 30 calls is ________.A)55.8,51.5
B)51.4,55.9
C)46.7,60.6
D)31.1,76.2
Unlock Deck
Unlock for access to all 84 flashcards in this deck.
Unlock Deck
k this deck
65
Using the following information: If testing the hypothesis H0: ρ = 0,the computed t-statistic is ________.
A)9.49
B)8.84
C)8.18
D)Cannot be computed
If testing the hypothesis H0: ρ = 0,the computed t-statistic is ________.A)9.49
B)8.84
C)8.18
D)Cannot be computed
Unlock Deck
Unlock for access to all 84 flashcards in this deck.
Unlock Deck
k this deck
66
Using the following information: What is the coefficient of determination? Round the percentage to one decimal point.
A)91.8%
B)8.2%
C)90.0%
D)136.9%
What is the coefficient of determination? Round the percentage to one decimal point.A)91.8%
B)8.2%
C)90.0%
D)136.9%
Unlock Deck
Unlock for access to all 84 flashcards in this deck.
Unlock Deck
k this deck
67
A sales manager for an advertising agency believes there is a relationship between the number of contacts that a salesperson makes and the amount of sales dollars earned. A regression ANOVA shows the following results: What is the value of the coefficient of correlation?
A)+0.6317
B)+0.9754
C)−0.9754
D)+0.9513
What is the value of the coefficient of correlation?A)+0.6317
B)+0.9754
C)−0.9754
D)+0.9513
Unlock Deck
Unlock for access to all 84 flashcards in this deck.
Unlock Deck
k this deck
68
A sales manager for an advertising agency believes there is a relationship between the number of contacts that a salesperson makes and the amount of sales dollars earned. A regression analysis shows the following results: What is the regression equation?
A) = 2.195 − 12.201X
B) = −12.201 + 2.195X
C) = 12.201 + 2.195X
D) = 2.195 + 12.201X
What is the regression equation?A)
= 2.195 − 12.201XB)
= −12.201 + 2.195XC)
= 12.201 + 2.195XD)
= 2.195 + 12.201X Unlock Deck
Unlock for access to all 84 flashcards in this deck.
Unlock Deck
k this deck
69
Consider a regression analysis,where the correlation coefficient is 0.18. Then,the coefficient of determination is ________.
A)0.36
B)0.0324
C)0.424
D)1.16
A)0.36
B)0.0324
C)0.424
D)1.16
Unlock Deck
Unlock for access to all 84 flashcards in this deck.
Unlock Deck
k this deck
70
Using the following information: Estimate the value of when X = 4.
A)10.45
B)3.73
C)8.718
D)−4.092
Estimate the value of when X = 4.A)10.45
B)3.73
C)8.718
D)−4.092
Unlock Deck
Unlock for access to all 84 flashcards in this deck.
Unlock Deck
k this deck
71
Consider the following regression analysis between sales (Y in $1,000)and social media advertising (X in dollars). = 55,000 + 7X The regression equation implies that an ________.
A)increase of $7 in advertising is associated with an increase of $7,000 in sales
B)increase of $1 in advertising is associated with an increase of $7 in sales
C)increase of $1 in advertising is associated with an increase of $62,000 in sales
D)increase of $1 in advertising is associated with an increase of $7,000 in sales
= 55,000 + 7X The regression equation implies that an ________.A)increase of $7 in advertising is associated with an increase of $7,000 in sales
B)increase of $1 in advertising is associated with an increase of $7 in sales
C)increase of $1 in advertising is associated with an increase of $62,000 in sales
D)increase of $1 in advertising is associated with an increase of $7,000 in sales
Unlock Deck
Unlock for access to all 84 flashcards in this deck.
Unlock Deck
k this deck
72
A regression analysis yields the following information: = 2.21 + 1.49X; n = 10; = 166; = 32; = 134; = 31.6. Compute the 95% confidence interval when X = 4.
A)0.0,4.05
B)4.15,12.25
C)2.67,5.33
D)6.842,9.497
= 2.21 + 1.49X; n = 10; = 166; = 32; = 134; = 31.6. Compute the 95% confidence interval when X = 4.A)0.0,4.05
B)4.15,12.25
C)2.67,5.33
D)6.842,9.497
Unlock Deck
Unlock for access to all 84 flashcards in this deck.
Unlock Deck
k this deck
73
Using the following information: The regression equation is ________.
A) = 2.1794 − 12.8094X
B) = −12.8094 + 2.1794X
C)12.8094X = 2.1794
D)X = −12.8094 + 2.1794
The regression equation is ________.A)
= 2.1794 − 12.8094XB)
= −12.8094 + 2.1794XC)12.8094X = 2.1794
D)X = −12.8094 + 2.1794
Unlock Deck
Unlock for access to all 84 flashcards in this deck.
Unlock Deck
k this deck
74
A regression analysis yields the following information: = 2.21 + 1.49X; n = 10; = 166; = 32; = 134; = 31.6. Compute the 95% prediction interval when X = 4.
A)0.0,4.05
B)2.67,5.33
C)4.118,12.226
D)6.873,9.527
= 2.21 + 1.49X; n = 10; = 166; = 32; = 134; = 31.6. Compute the 95% prediction interval when X = 4.A)0.0,4.05
B)2.67,5.33
C)4.118,12.226
D)6.873,9.527
Unlock Deck
Unlock for access to all 84 flashcards in this deck.
Unlock Deck
k this deck
75
A sales manager for an advertising agency believes there is a relationship between the number of contacts that a salesperson makes and the amount of sales dollars earned. A regression analysis shows the following results: = 33.4. = 2814.4. Rounding to one decimal place,the 95% confidence interval for 30 calls is ________.
A)55.8,51.5
B)51.4,55.9
C)46.7,60.6
D)31.1,76.2
= 33.4. = 2814.4. Rounding to one decimal place,the 95% confidence interval for 30 calls is ________.A)55.8,51.5
B)51.4,55.9
C)46.7,60.6
D)31.1,76.2
Unlock Deck
Unlock for access to all 84 flashcards in this deck.
Unlock Deck
k this deck
76
A sales manager for an advertising agency believes there is a relationship between the number of contacts that a salesperson makes and the amount of sales dollars earned. A regression ANOVA shows the following results: What is the value of the coefficient of determination?
A)−0.9513
B)0.9754
C)0.6319
D)0.9513
What is the value of the coefficient of determination?A)−0.9513
B)0.9754
C)0.6319
D)0.9513
Unlock Deck
Unlock for access to all 84 flashcards in this deck.
Unlock Deck
k this deck
77
Using the following information: What is the correlation coefficient?
A)0.9184
B)0.9583
C)−0.9583
D)0.9004
What is the correlation coefficient?A)0.9184
B)0.9583
C)−0.9583
D)0.9004
Unlock Deck
Unlock for access to all 84 flashcards in this deck.
Unlock Deck
k this deck
78
A sales manager for an advertising agency believes there is a relationship between the number of contacts that a salesperson makes and the amount of sales dollars earned. A regression ANOVA shows the following results: What is the value of the standard error of estimate?
A)9.310
B)8.778
C)8.328
D)86.68
What is the value of the standard error of estimate?A)9.310
B)8.778
C)8.328
D)86.68
Unlock Deck
Unlock for access to all 84 flashcards in this deck.
Unlock Deck
k this deck
79
Consider a regression and correlation analysis where r2 = 1. We know that ________.
A)SSE must be greater than one
B)SSE must be greater than SS Total
C)SSE can take on any negative or positive value
D)SSE must equal to zero
A)SSE must be greater than one
B)SSE must be greater than SS Total
C)SSE can take on any negative or positive value
D)SSE must equal to zero
Unlock Deck
Unlock for access to all 84 flashcards in this deck.
Unlock Deck
k this deck
80
A sales manager for an advertising agency believes there is a relationship between the number of contacts that a salesperson makes and the amount of sales dollars earned. A regression analysis shows the following results: What is the decision regarding the hypothesis if the p-value for the slope equals zero?
A)Fail to reject the null hypothesis.
B)Fail to reject the alternative hypothesis.
C)Reject the null hypothesis.
D)Reject the alternative hypothesis.
What is the decision regarding the hypothesis if the p-value for the slope equals zero?A)Fail to reject the null hypothesis.
B)Fail to reject the alternative hypothesis.
C)Reject the null hypothesis.
D)Reject the alternative hypothesis.
Unlock Deck
Unlock for access to all 84 flashcards in this deck.
Unlock Deck
k this deck
Unlock Deck
Unlock for access to all 84 flashcards in this deck.


