Deck 16: The Distribution of Personal Earnings
Full screen (f)
Question
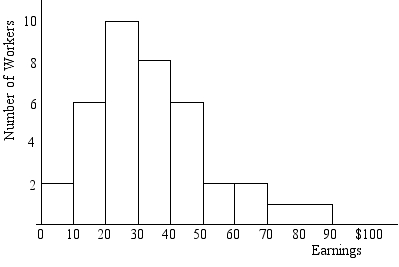
The mean of this distribution is:
A)10,000 workers
B)between $20,000 and $30,000
C)between $30,000 and $50,000
D)between $60,000 and $90,000
Question
The number of persons with annual earnings between $30,000 and $50,000 is:
A)7,000
B)8,000
C)14,000
D)20,000
Question
The number of persons with annual earnings between $50,000 and $70,000 is:
A)1,000
B)2,000
C)4,000
D)10,000
Question
Question
Question
Question
Question
Question
Question
The mode of this distribution is:
A)10,000 workers
B)between $20,000 and $30,000
C)between $30,000 and $40,000
D)between $40,000 and $50,000
Question
Question
Question
Question
Question
Question
Question
Question
Question
Question
Question
Question
Question
Question
Question
Question
Question
Question
Question
Question
Question
Question
Question
Question
Question
Question
Question
Question
Question

Unlock Deck
Sign up to unlock the cards in this deck!
Unlock Deck
Unlock Deck
1/39
Play
Full screen (f)
Deck 16: The Distribution of Personal Earnings
1
The mean of this distribution is:
A)10,000 workers
B)between $20,000 and $30,000
C)between $30,000 and $50,000
D)between $60,000 and $90,000
C
2
The number of persons with annual earnings between $30,000 and $50,000 is:
A)7,000
B)8,000
C)14,000
D)20,000
C
3
The number of persons with annual earnings between $50,000 and $70,000 is:
A)1,000
B)2,000
C)4,000
D)10,000
C
4
The mean annual earnings in 2010 for full-time workers in the U.S.was approximately:
A)$31,000
B)$35,000
C)$46,000
D)$54,000
A)$31,000
B)$35,000
C)$46,000
D)$54,000
Unlock Deck
Unlock for access to all 39 flashcards in this deck.
Unlock Deck
k this deck
5
If an increase in the sales tax reduces the earnings of low-income individuals relative to high-income individuals:
A)the Gini coefficient would fall
B)the Gini coefficient would rise
C)the Gini coefficient would not change
D)the Lorenz curve would shift closer to the diagonal
A)the Gini coefficient would fall
B)the Gini coefficient would rise
C)the Gini coefficient would not change
D)the Lorenz curve would shift closer to the diagonal
Unlock Deck
Unlock for access to all 39 flashcards in this deck.
Unlock Deck
k this deck
6
The median annual earnings in 2010 for full-time workers in the U.S.was approximately:
A)$35,000
B)$39,000
C)$42,000
D)$61,000
A)$35,000
B)$39,000
C)$42,000
D)$61,000
Unlock Deck
Unlock for access to all 39 flashcards in this deck.
Unlock Deck
k this deck
7
The U.S.earnings distribution is:
A)skewed toward lower earnings
B)skewed toward higher earnings
C)symmetrical
D)uniform
A)skewed toward lower earnings
B)skewed toward higher earnings
C)symmetrical
D)uniform
Unlock Deck
Unlock for access to all 39 flashcards in this deck.
Unlock Deck
k this deck
8
If all workers were to receive the same earnings:
A)the Gini coefficient of earnings would be 1
B)the Gini coefficient of earnings would be 0
C)the earnings distribution would have a normal bell-shaped appearance
D)the Lorenz curve would be skewed to the left
Question 15 and 16 refer to the diagram at right:
A)the Gini coefficient of earnings would be 1
B)the Gini coefficient of earnings would be 0
C)the earnings distribution would have a normal bell-shaped appearance
D)the Lorenz curve would be skewed to the left
Question 15 and 16 refer to the diagram at right:
Unlock Deck
Unlock for access to all 39 flashcards in this deck.
Unlock Deck
k this deck
9
The Gini coefficient measures:
A)the area under the Lorenz curve
B)the area above the Lorenz curve
C)twice the area between the Lorenz curve and the line of equality
D)half the area between the Lorenz curve and the line of equality
A)the area under the Lorenz curve
B)the area above the Lorenz curve
C)twice the area between the Lorenz curve and the line of equality
D)half the area between the Lorenz curve and the line of equality
Unlock Deck
Unlock for access to all 39 flashcards in this deck.
Unlock Deck
k this deck
10
The mode of this distribution is:
A)10,000 workers
B)between $20,000 and $30,000
C)between $30,000 and $40,000
D)between $40,000 and $50,000
Unlock Deck
Unlock for access to all 39 flashcards in this deck.
Unlock Deck
k this deck
11
An increase in earnings inequality would be shown by a:
A)shift from line A to line B
B)shift from lime B to line A
C)movement up to the right along line A
D)movement down to the left along line A
A)shift from line A to line B
B)shift from lime B to line A
C)movement up to the right along line A
D)movement down to the left along line A
Unlock Deck
Unlock for access to all 39 flashcards in this deck.
Unlock Deck
k this deck
12
The U.S.earnings distribution is:
A)best represented by a straight line Lorenz curve
B)not symmetrical around the mean earnings level
C)concentrated around a rightward mode
D)skewed to the left
A)best represented by a straight line Lorenz curve
B)not symmetrical around the mean earnings level
C)concentrated around a rightward mode
D)skewed to the left
Unlock Deck
Unlock for access to all 39 flashcards in this deck.
Unlock Deck
k this deck
13
refer to the following quintile earnings distribution data
-If one were to draw a Lorenz curve from the data,what point would be plotted corresponding to "40%" on the horizontal axis?
A)11%
B)15%
C)40%
D)60%
-If one were to draw a Lorenz curve from the data,what point would be plotted corresponding to "40%" on the horizontal axis?
A)11%
B)15%
C)40%
D)60%
Unlock Deck
Unlock for access to all 39 flashcards in this deck.
Unlock Deck
k this deck
14
Among the following industrial countries,income inequality is greatest in:
A)Germany
B)Italy
C)Canada
D)the U.S.
A)Germany
B)Italy
C)Canada
D)the U.S.
Unlock Deck
Unlock for access to all 39 flashcards in this deck.
Unlock Deck
k this deck
15
refer to the following quintile earnings distribution data
-The median of this distribution is in the:
A)second 20%
B)third 20%
C)fourth 20%
D)highest 20%
-The median of this distribution is in the:
A)second 20%
B)third 20%
C)fourth 20%
D)highest 20%
Unlock Deck
Unlock for access to all 39 flashcards in this deck.
Unlock Deck
k this deck
16
refer to the following quintile earnings distribution data
-If one were to draw a Lorenz curve from the data,what point would be plotted corresponding to "80%" on the horizontal axis?
A)11%
B)24%
C)45%
D)55%
-If one were to draw a Lorenz curve from the data,what point would be plotted corresponding to "80%" on the horizontal axis?
A)11%
B)24%
C)45%
D)55%
Unlock Deck
Unlock for access to all 39 flashcards in this deck.
Unlock Deck
k this deck
17
In 2010,the bottom 20% of all full-time workers in the U.S.received _____ of total earnings,while the top 20% received _____.
A)2%,61%
B)3%,74%
C)7%,45%
D)12%,37%
A)2%,61%
B)3%,74%
C)7%,45%
D)12%,37%
Unlock Deck
Unlock for access to all 39 flashcards in this deck.
Unlock Deck
k this deck
18
For the U.S.earnings distribution,the:
A)mode is less than the median
B)median is greater than the mean
C)mean is less than the median
D)mode is greater than the mean
A)mode is less than the median
B)median is greater than the mean
C)mean is less than the median
D)mode is greater than the mean
Unlock Deck
Unlock for access to all 39 flashcards in this deck.
Unlock Deck
k this deck
19
Which of the following is a true statement regarding the U.S.earnings distribution?
A)Because the distribution is skewed to the right,the mean exceeds the mode
B)Because the distribution is skewed to the right,the mode exceeds the mean
C)Because the distribution is skewed to the left,the mean exceeds the mode
D)Because the distribution is skewed to the left,the mode exceeds the median
Unlock Deck
Unlock for access to all 39 flashcards in this deck.
Unlock Deck
k this deck
20
If an increase in the minimum wage increases the earnings of low-income individuals relative to high-income individuals,this will cause the Lorenz curve of earnings to shift from:
A)A to B and the Gini coefficient will rise
B)A to B and the Gini coefficient will fall
C)B to A and the Gini coefficient will rise
D)B to A and the Gini coefficient will fall
A)A to B and the Gini coefficient will rise
B)A to B and the Gini coefficient will fall
C)B to A and the Gini coefficient will rise
D)B to A and the Gini coefficient will fall
Unlock Deck
Unlock for access to all 39 flashcards in this deck.
Unlock Deck
k this deck
21
Evidence indicates that most of the growth in earnings inequality since 1970 is:
A)within each age group and within each industry
B)within each age group and between industries
C)between age groups and within each industry
D)between age groups and between industries
A)within each age group and within each industry
B)within each age group and between industries
C)between age groups and within each industry
D)between age groups and between industries
Unlock Deck
Unlock for access to all 39 flashcards in this deck.
Unlock Deck
k this deck
22
The basic human capital model predicts that:
A)the greater are the differences in the quantity and quality of training,the greater is the inequality of earnings.
B)the greater the length and quality of one's formal training,the higher will be the investment costs and the lower will be expected earnings
C)the earnings distribution will be symmetric
D)the Gini coefficient will eventually become zero
Unlock Deck
Unlock for access to all 39 flashcards in this deck.
Unlock Deck
k this deck
23
Which one of the following is a true statement?
A)The earnings distribution for full-time workers is less skewed than the one for all workers
B)When fringe benefits are included,the earnings distribution narrows
C)The distribution of income is no different from the distribution of earnings
D)The Lorenz curve shows the extent of personal mobility within the distribution of earnings
Unlock Deck
Unlock for access to all 39 flashcards in this deck.
Unlock Deck
k this deck
24
Including fringe benefits with earnings,the Lorenz curve moves:
A)away from the diagonal and the Gini coefficient rises
B)away from the diagonal and the Gini coefficient falls
C)toward the diagonal and the Gini coefficient rises
D)toward the diagonal and the Gini coefficient falls
A)away from the diagonal and the Gini coefficient rises
B)away from the diagonal and the Gini coefficient falls
C)toward the diagonal and the Gini coefficient rises
D)toward the diagonal and the Gini coefficient falls
Unlock Deck
Unlock for access to all 39 flashcards in this deck.
Unlock Deck
k this deck
25
The distribution of earnings has become more unequal:
A)among women but not among men
B)in part due to the reduction in the college wage premium in the 1980s
C)in part due to greater import competition in the 1980s
D)in part due to a reduction in the number of young and inexperienced workers in the 1990s
A)among women but not among men
B)in part due to the reduction in the college wage premium in the 1980s
C)in part due to greater import competition in the 1980s
D)in part due to a reduction in the number of young and inexperienced workers in the 1990s
Unlock Deck
Unlock for access to all 39 flashcards in this deck.
Unlock Deck
k this deck
26
If the various elements of innate ability are positively correlated and interact with one another multiplicatively rather than additively to determine earnings,then:
A)the distribution of earnings will tend to be more skewed to the right
B)the distribution of earnings will tend to be more skewed to the left
C)the distribution of earnings will shift to the left
D)the total demand for training will tend to fall
A)the distribution of earnings will tend to be more skewed to the right
B)the distribution of earnings will tend to be more skewed to the left
C)the distribution of earnings will shift to the left
D)the total demand for training will tend to fall
Unlock Deck
Unlock for access to all 39 flashcards in this deck.
Unlock Deck
k this deck
27
Family background influences an individual's earnings:
A)directly,but not through any indirect effects on human capital decisions
B)directly,and indirectly through greater investments in human capital
C)indirectly through greater investments in human capital,but not directly
D)directly,and indirectly through its impact on discrimination
A)directly,but not through any indirect effects on human capital decisions
B)directly,and indirectly through greater investments in human capital
C)indirectly through greater investments in human capital,but not directly
D)directly,and indirectly through its impact on discrimination
Unlock Deck
Unlock for access to all 39 flashcards in this deck.
Unlock Deck
k this deck
28
(World of Work 16-2)Compared to the private sector,the public sector earnings distribution tends to be:
A)more unequal because government workers tend to be employed in service occupations
B)more unequal because government pay scales are generally higher
C)less unequal because of the relatively large number of management positions in government
D)less unequal because blue-collar employees are generally paid more and white-collar employees are generally paid less than their private-sector counterparts
Unlock Deck
Unlock for access to all 39 flashcards in this deck.
Unlock Deck
k this deck
29
If earnings inequality continues to increase,the Lorenz curve will shift:
A)away from the diagonal and the Gini coefficient will rise
B)away from the diagonal and the Gini coefficient will fall
C)toward the diagonal and the Gini coefficient will rise
D)towards the diagonal and the Gini coefficient will fall
A)away from the diagonal and the Gini coefficient will rise
B)away from the diagonal and the Gini coefficient will fall
C)toward the diagonal and the Gini coefficient will rise
D)towards the diagonal and the Gini coefficient will fall
Unlock Deck
Unlock for access to all 39 flashcards in this deck.
Unlock Deck
k this deck
30
Which of the following is not an explanation advanced to explain the increase in earnings inequality?
A)Deindustrialization
B)Import competition and the decline of unionism
C)Demographic changes
D)A decreased demand for skilled labor
A)Deindustrialization
B)Import competition and the decline of unionism
C)Demographic changes
D)A decreased demand for skilled labor
Unlock Deck
Unlock for access to all 39 flashcards in this deck.
Unlock Deck
k this deck
31
Which of the following factors does not help explain why the earnings distribution is skewed to the right?
A)Family background
B)Discrimination
C)The impact of ability on human capital decisions
D)Churning within the distribution
A)Family background
B)Discrimination
C)The impact of ability on human capital decisions
D)Churning within the distribution
Unlock Deck
Unlock for access to all 39 flashcards in this deck.
Unlock Deck
k this deck
32
If persons of greater ability also tend to invest more in human capital,then the impact of human capital on earnings will be:
A)understated
B)overstated
C)unaffected
D)a direct impact
A)understated
B)overstated
C)unaffected
D)a direct impact
Unlock Deck
Unlock for access to all 39 flashcards in this deck.
Unlock Deck
k this deck
33
(World of Work 16-1)Research by Solon on intergenerational mobility across countries indicates that:
A)countries with greater earnings inequality tend to have less intergenerational earnings mobility
B)less developed countries tend to have greater intergenerational earnings mobility
C)countries with higher returns to investment in human capital have greater intergenerational earnings mobility
D)intergenerational earnings mobility is greater in the U.S.than in the United Kingdom
Unlock Deck
Unlock for access to all 39 flashcards in this deck.
Unlock Deck
k this deck
34
According to empirical evidence,there is _____ life-cycle mobility within the earnings distribution.Therefore,the distribution of annual earnings is _____ unequal than the distribution of lifetime earnings.
A)little; more
B)little; less
C)substantial; more
D)substantial; less
A)little; more
B)little; less
C)substantial; more
D)substantial; less
Unlock Deck
Unlock for access to all 39 flashcards in this deck.
Unlock Deck
k this deck
35
Those persons with greater amounts of formal education tend to have:
A)less on-the-job training,which increases the skewness of the earnings distribution
B)less on-the-job training,which decreases the skewness of the earnings distribution
C)more on-the-job training,which increases the skewness of the earnings distribution
D)more on-the-job training,which decreases the skewness of the earnings distribution
Unlock Deck
Unlock for access to all 39 flashcards in this deck.
Unlock Deck
k this deck
36
The multifactor explanation of the distribution of earnings typically excludes:
A)innate ability
B)family background
C)non-monetary returns to training
D)risk-taking and chance
A)innate ability
B)family background
C)non-monetary returns to training
D)risk-taking and chance
Unlock Deck
Unlock for access to all 39 flashcards in this deck.
Unlock Deck
k this deck
37
Discrimination contributes to earnings inequality through:
A)pay discrimination only
B)pay discrimination and occupational segregation only
C)pay discrimination,occupational segregation,and human capital discrimination
D)chance and risk taking,which reduce the Gini coefficient
A)pay discrimination only
B)pay discrimination and occupational segregation only
C)pay discrimination,occupational segregation,and human capital discrimination
D)chance and risk taking,which reduce the Gini coefficient
Unlock Deck
Unlock for access to all 39 flashcards in this deck.
Unlock Deck
k this deck
38
The 90-10 wage ratio for workers over the period 1973 - present shows that:
A)inequality increased among both men and women
B)inequality increased among men but decreased among women
C)inequality increased among women but decreased among men
D)inequality decreased among both men and women
A)inequality increased among both men and women
B)inequality increased among men but decreased among women
C)inequality increased among women but decreased among men
D)inequality decreased among both men and women
Unlock Deck
Unlock for access to all 39 flashcards in this deck.
Unlock Deck
k this deck
39
Econometric studies that hold other factors constant show that:
A)there is a positive relationship between education and earnings
B)there is no relationship between education and earnings
C)there is no relationship between the quality of education and earnings
D)formal schooling explains most of the differences in individual earnings
A)there is a positive relationship between education and earnings
B)there is no relationship between education and earnings
C)there is no relationship between the quality of education and earnings
D)formal schooling explains most of the differences in individual earnings
Unlock Deck
Unlock for access to all 39 flashcards in this deck.
Unlock Deck
k this deck
Unlock Deck
Unlock for access to all 39 flashcards in this deck.


