Deck 6: Multiple Linear Regression Analysis
Full screen (f)
Question
Question
Figure:
Suppose you regress the self-reported number of cigarettes smoked per day on Age,Family Size,and Years of Education and that you get the results in Figure 6.2.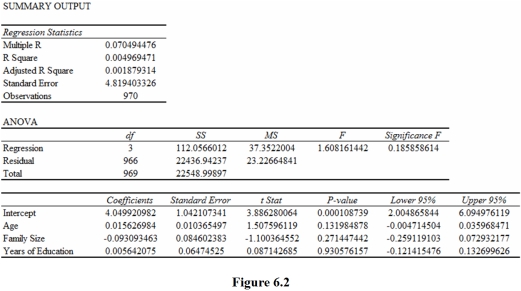
Based on the estimates in Figure 6.2,you should conclude that,holding all other independent variables constant,each additional year of age is estimated to be associated with
A)a statistically significant increase of 1.56 percent in cigarettes smoked per day.
B)a statistically insignificant increase of 1.56 percent in cigarettes smoked per day.
C)a statistically significant increase of 0.0156 cigarettes smoked per day.
D)a statistically insignificant increase of 0.0156 cigarettes smoked per day.
Question
Question
Question
The numerator of the appropriate test statistic for testing for the joint significance of a subset of independent variables is
A)
B)
C)
D)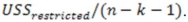
A)
B)
C)
D)
Question
Question
Figure:
Suppose you regress the number of medals won by countries in the 1996,2000,2004,and 2008 Olympics on GDP Per Capita (Thousands),Population (Millions),and Olympic Year and that you get the results in Figure 6.1.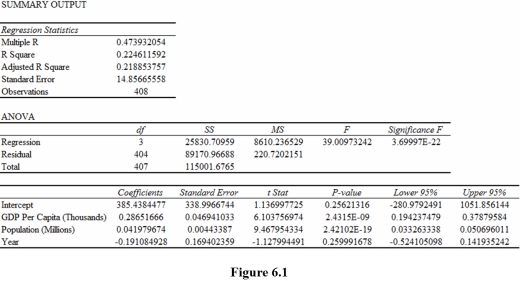
Based on the estimates in Figure 6.1,you should conclude that,holding all other independent variables constant,a $1,000 increase in GDP Per Capita is estimated to
A)increase Total Medals Won by a statistically significant 0.2865 because 0 is not included in the 95% confidence interval.
B)increase Total Medals Won by a statistically insignificant 0.2865 because 0 is included in the 95% confidence interval.
C)increase Total Medals Won by a statistically insignificant 0.2865 because 0.2865 is included in the 95% confidence interval.
D)increase Total Medals Won by a statistically significant 0.2865 because 0.2865 is included in the 95% confidence interval.
Question
Question
Figure
Suppose that in the course of testing whether Age and Family Size are jointly significant,you estimate the results in Figure 6.3.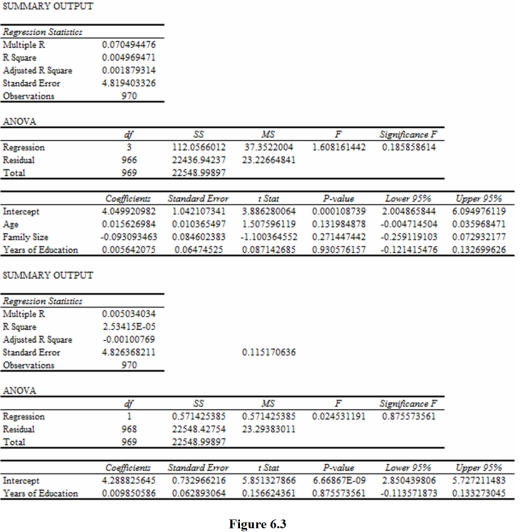
When testing for the joint significance of Age and Family Size (Figure 6.3),the
Is
A)22,548.428.
B)23.294.
C)22,436.942.
D)23.227.
Suppose that in the course of testing whether Age and Family Size are jointly significant,you estimate the results in Figure 6.3.
When testing for the joint significance of Age and Family Size (Figure 6.3),the
Is
A)22,548.428.
B)23.294.
C)22,436.942.
D)23.227.
Question
Figure:
Suppose you regress the self-reported number of cigarettes smoked per day on Age,Family Size,and Years of Education and that you get the results in Figure 6.2.
Based on the estimates in Figure 6.2,you should conclude that,holding all other independent variables constant,each additional family member is estimated to be associated with
A)a statistically significant decrease of 0.093 cigarettes smoked per day.
B)a statistically insignificant decrease of 0.093 cigarettes smoked per day.
C)a statistically significant increase of 0.093 cigarettes smoked per day.
D)a statistically insignificant increase of 0.093 cigarettes smoked per day.
Question
Suppose you wish to know whether Age and Family Size are jointly significant in the model 
The appropriate null hypothesis for this test is
A)H0: β0 = β1 = β2 = β3 = 0.
B)H0: β1 = β2 = 0.
C)H0: β1 = 0.
D)H0: β2 = 0.
The appropriate null hypothesis for this test is
A)H0: β0 = β1 = β2 = β3 = 0.
B)H0: β1 = β2 = 0.
C)H0: β1 = 0.
D)H0: β2 = 0.
Question
Question
Question
Question
Question
The denominator of the appropriate test statistic for testing for the joint significance of a subset of independent variables is
A)
B)
C)
D)
A)
B)
C)
D)
Question
Figure:
Suppose you regress the number of medals won by countries in the 1996,2000,2004,and 2008 Olympics on GDP Per Capita (Thousands),Population (Millions),and Olympic Year and that you get the results in Figure 6.1.
Based on the estimates in Figure 6.1,you should conclude that,holding all other independent variables constant,Olympic Year is estimated to have
A)a statistically significant positive effect on Total Medals Won because -1.128 < .05.
B)a statistically insignificant positive effect on Total Medals Won because |-1.128| > .05.
C)a statistically significant positive effect on Total Medals Won because |-1.128| < 1.96.
D)a statistically insignificant positive effect on Total Medals Won because |-1.128| < 1.96.
Question
Figure:
Suppose you regress the number of medals won by countries in the 1996,2000,2004,and 2008 Olympics on GDP Per Capita (Thousands),Population (Millions),and Olympic Year and that you get the results in Figure 6.1.
Based on the estimates in Figure 6.1,you should conclude that a 1 million increase in population is estimated to be associated with
A)a statistically significant .042 increase in population.
B)a statistically significant .042 increase in the total number of medals won,holding all other independent variables constant.
C)a statistically insignificant .042 increase in the total number of medals won.
D)a statistically insignificant .042 increase in the total number of medals won,holding all other independent variables constant.
Question
Figure:
Suppose you regress the number of medals won by countries in the 1996,2000,2004,and 2008 Olympics on GDP Per Capita (Thousands),Population (Millions),and Olympic Year and that you get the results in Figure 6.1.
Based on the estimates in Figure 6.1,you should conclude that
A)the regression function is overall statistically significant because 3.6997E - 22 < .05.
B)the regression function is overall statistically insignificant because 3.6997E - 22 < .05.
C)the regression function is overall statistically insignificant because .4739 > .05.
D)the regression function is overall statistically significant because 2.4135E - 09 < 0.05.
Question
Figure
Suppose that in the course of testing whether Age and Family Size are jointly significant,you estimate the results in Figure 6.3.
When testing for the joint significance of Age and Family Size (Figure 6.3),the
Is
A)22,548.428.
B)23.294.
C)22,436.942.
D)23.227.
Suppose that in the course of testing whether Age and Family Size are jointly significant,you estimate the results in Figure 6.3.
When testing for the joint significance of Age and Family Size (Figure 6.3),the
Is
A)22,548.428.
B)23.294.
C)22,436.942.
D)23.227.
Question
Figure
Suppose that in the course of testing whether Age and Family Size are jointly significant,you estimate the results in Figure 6.3.
Chow tests are based on comparing the
A)sum of the unexplained sums of squares added together from separate regressions to the unexplained sum of squares for the pooled regression.
B)unexplained sums of squares from separate regressions to each other.
C)sum of the explained sums of squares from separate regressions to the explained sum of squares for the pooled regression.
D)explained sums of squares from separate regressions to each other.
Question
Question
Question
Figure:
Suppose that in the course of testing whether salary functions differ for males and females,you estimate the pooled and male and female results in Figure 6.4.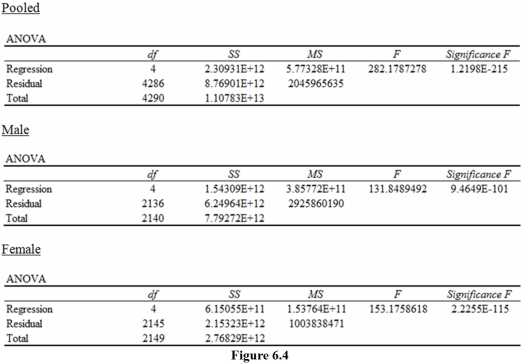
The appropriate critical value for the Chow test in Figure 6.4 is
A)1.927.
B)2.032.
C)2.463.
D)2.978.
Suppose that in the course of testing whether salary functions differ for males and females,you estimate the pooled and male and female results in Figure 6.4.
The appropriate critical value for the Chow test in Figure 6.4 is
A)1.927.
B)2.032.
C)2.463.
D)2.978.
Question
Question
Question
Figure:
Suppose that in the course of testing whether salary functions differ for males and females,you estimate the pooled and male and female results in Figure 6.4.
Based on the results in Figure 6.4,you should
A)reject the null hypothesis.
B)fail to reject the null hypothesis.
C)reject the alternative hypothesis.
D)fail to reject the alternative hypothesis.
Question
Question
Figure:
Suppose that in the course of testing whether salary functions differ for males and females,you estimate the pooled and male and female results in Figure 6.4.
Based on the results of you the Chow test in Figure 6.4 you should
A)focus on the pooled sample results.
B)focus on the male and female subsample results.
C)collect more data that does not fail the Chow test.
D)focus on the male results only.
Question
Figure
Suppose that in the course of testing whether Age and Family Size are jointly significant,you estimate the results in Figure 6.3.
When testing for the joint significance of Age and Family Size (Figure 6.3),the appropriate test statistic is
A)37.162.
B)0.115.
C)23.227.
D)1.600.
Suppose that in the course of testing whether Age and Family Size are jointly significant,you estimate the results in Figure 6.3.
When testing for the joint significance of Age and Family Size (Figure 6.3),the appropriate test statistic is
A)37.162.
B)0.115.
C)23.227.
D)1.600.
Question
Question
Question
Figure
Suppose that in the course of testing whether Age and Family Size are jointly significant,you estimate the results in Figure 6.3.
When testing for the joint significance of Age and Family Size (Figure 6.3),you should
A)reject the null hypothesis because 1.600 < 2.61.
B)fail to reject the null hypothesis because 1.600 < 2.61.
C)reject the null hypothesis because 1.600 < 8.53.
D)fail to reject the null hypothesis because 1.600 < 8.53.
Question
Question
Figure
Suppose that in the course of testing whether Age and Family Size are jointly significant,you estimate the results in Figure 6.3.
Chow tests are used to determine whether
A)an estimated slope coefficient is different for different subsamples of the data.
B)a subset of independent variables is jointly significant.
C)estimated sample regression functions are different for two different subsamples of the data.
D)a subset of estimated slope coefficients is jointly significant for two different subsamples of the data.
Question
Question
Figure
Suppose that in the course of testing whether Age and Family Size are jointly significant,you estimate the results in Figure 6.3.
When testing for the joint significance of Age and Family Size (Figure 6.3),you should
A)reject the null hypothesis and conclude that β2 = β3 = 0.
B)fail to reject the null hypothesis because and conclude that β2 = β3 = 0.
C)reject the null hypothesis and conclude that at least one of β2 or β3 is not equal to 0.
D)fail to reject the null hypothesis and conclude that at least one of β2 or β3 is not equal to 0.
Question
The test statistic for this Chow test is
A)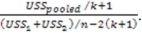
B)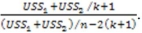
C)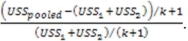
D)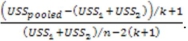
A)
B)
C)
D)
Question
Figure:
Suppose that in the course of testing whether salary functions differ for males and females,you estimate the pooled and male and female results in Figure 6.4.
The tests statistic for the Chow test in Figure 6.4 is
A)0.0436.
B)9.327.
C)18.654.
D)37.307.
Suppose that in the course of testing whether salary functions differ for males and females,you estimate the pooled and male and female results in Figure 6.4.
The tests statistic for the Chow test in Figure 6.4 is
A)0.0436.
B)9.327.
C)18.654.
D)37.307.
Question
Question
A researcher is interested in estimating how the test scores of elementary schools is related to average class size,parents education level (in years),and percent of English learners at the school.The researcher obtains a sample of 200 California public schools and obtains the following results with standard errors are in parentheses 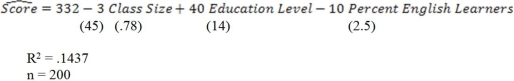
a)The F-statistic for this regression is 48.32.Test the overall significance of the regression model at the 5% level.What are the hypothesis,critical value,rejection rule and decision.
b)Perform a t-test of for the individual significance for the slopes.
c)Comment on the economic significance of the coefficient estimates.
d)If you are interested in sending your child to a school with high test scores what would factors would you look for?
Question
A researcher is interested in estimating how the test scores of elementary schools is related to average class size,parents education level (in years),and percent of English learners at the school.The researcher obtains a sample of 200 California public schools and obtains the following results 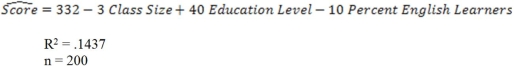
a)Interpret the coefficient estimates.Are these results consistent with what you expected?
b)Are there any omitted variables in this regression? If so,list them.
c)Interpret the R-squared.Is the value of the R-squared high as you expected?
d)Calculate the Adjusted R-squared and comment on what it means.
e)Predict the test score for a school with average class sizes of 28,an education level of 14 years,and 3% English learners.
f)Design an experiment to determine how class size affects test scores.How would the results from that experiment differ from the results presented above?
Question
Question
Suppose you are interested in determining the factors that determine the number of crimes committed on campus.To this end,you collect data from 75 colleges on number of crimes per students enrolled,number of police officers per students,unemployment rate,tuition,and the percentage of male students.You run a regression and obtain the following results 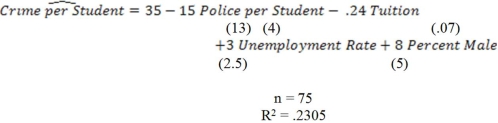
a)Which of the coefficient estimates are statistically significant at the 5% level?
b)You run an additional regression in order to jointly test if two coefficients are equal to 0.State the hypothesis,calculate the test statistic,state the regression rule,and state your decision.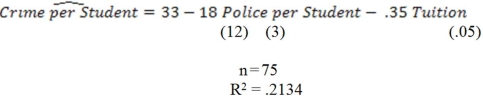
a)Which of the coefficient estimates are statistically significant at the 5% level?
b)You run an additional regression in order to jointly test if two coefficients are equal to 0.State the hypothesis,calculate the test statistic,state the regression rule,and state your decision.

Unlock Deck
Sign up to unlock the cards in this deck!
Unlock Deck
Unlock Deck
1/44
Play
Full screen (f)
Deck 6: Multiple Linear Regression Analysis
1
Omitted variable bias occurs when
A)always occurs when performing multiple linear regression analysis.
B)always occurs when performing simple linear regression analysis.
C)independent variables that should be included in the analysis are not included and those independent variables are related to the variables in the regression model.
D)independent variables that should not be included in the analysis are included in the analysis.
C
2
Figure:
Suppose you regress the self-reported number of cigarettes smoked per day on Age,Family Size,and Years of Education and that you get the results in Figure 6.2.
Based on the estimates in Figure 6.2,you should conclude that,holding all other independent variables constant,each additional year of age is estimated to be associated with
A)a statistically significant increase of 1.56 percent in cigarettes smoked per day.
B)a statistically insignificant increase of 1.56 percent in cigarettes smoked per day.
C)a statistically significant increase of 0.0156 cigarettes smoked per day.
D)a statistically insignificant increase of 0.0156 cigarettes smoked per day.
D
3
Omitted variable bias is a problem because
A)it causes perfect multicollinearity.
B)it causes the model to no longer be linear in the parameters.
C)it prevents the model from being able to be estimated by ordinary least squares.
D)it prevents correctly estimating marginal effects.
A)it causes perfect multicollinearity.
B)it causes the model to no longer be linear in the parameters.
C)it prevents the model from being able to be estimated by ordinary least squares.
D)it prevents correctly estimating marginal effects.
D
4
The "holding all other independent variables constant" condition is important
A)to ensure that we are correctly estimating marginal effects.
B)because it comes at the end of every definition in economics.
C)because economists want to know how a change in the dependent variable affects the independent variable.
D)to ensure that the error term is correlated with the independent variables.
Unlock Deck
Unlock for access to all 44 flashcards in this deck.
Unlock Deck
k this deck
5
The numerator of the appropriate test statistic for testing for the joint significance of a subset of independent variables is
A)
B)
C)
D)
A)
B)
C)
D)
Unlock Deck
Unlock for access to all 44 flashcards in this deck.
Unlock Deck
k this deck
6
Suppose you wish to know whether Age and Family Size are jointly significant in the model
The Restricted Model for testing the joint significance of the two variables?
A)
B)
C)
D)None of the above.
The Restricted Model for testing the joint significance of the two variables?
A)
B)
C)
D)None of the above.
Unlock Deck
Unlock for access to all 44 flashcards in this deck.
Unlock Deck
k this deck
7
Figure:
Suppose you regress the number of medals won by countries in the 1996,2000,2004,and 2008 Olympics on GDP Per Capita (Thousands),Population (Millions),and Olympic Year and that you get the results in Figure 6.1.
Based on the estimates in Figure 6.1,you should conclude that,holding all other independent variables constant,a $1,000 increase in GDP Per Capita is estimated to
A)increase Total Medals Won by a statistically significant 0.2865 because 0 is not included in the 95% confidence interval.
B)increase Total Medals Won by a statistically insignificant 0.2865 because 0 is included in the 95% confidence interval.
C)increase Total Medals Won by a statistically insignificant 0.2865 because 0.2865 is included in the 95% confidence interval.
D)increase Total Medals Won by a statistically significant 0.2865 because 0.2865 is included in the 95% confidence interval.
Unlock Deck
Unlock for access to all 44 flashcards in this deck.
Unlock Deck
k this deck
8
In multiple linear regression analysis,the number of independent variables should be
A)more than 5.
B)guided by economic theory.
C)enough to guarantee that statistical significance is achieved.
D)as large as possible.
A)more than 5.
B)guided by economic theory.
C)enough to guarantee that statistical significance is achieved.
D)as large as possible.
Unlock Deck
Unlock for access to all 44 flashcards in this deck.
Unlock Deck
k this deck
9
Figure
Suppose that in the course of testing whether Age and Family Size are jointly significant,you estimate the results in Figure 6.3.
When testing for the joint significance of Age and Family Size (Figure 6.3),the
Is
A)22,548.428.
B)23.294.
C)22,436.942.
D)23.227.
Suppose that in the course of testing whether Age and Family Size are jointly significant,you estimate the results in Figure 6.3.
When testing for the joint significance of Age and Family Size (Figure 6.3),the
Is
A)22,548.428.
B)23.294.
C)22,436.942.
D)23.227.
Unlock Deck
Unlock for access to all 44 flashcards in this deck.
Unlock Deck
k this deck
10
Figure:
Suppose you regress the self-reported number of cigarettes smoked per day on Age,Family Size,and Years of Education and that you get the results in Figure 6.2.
Based on the estimates in Figure 6.2,you should conclude that,holding all other independent variables constant,each additional family member is estimated to be associated with
A)a statistically significant decrease of 0.093 cigarettes smoked per day.
B)a statistically insignificant decrease of 0.093 cigarettes smoked per day.
C)a statistically significant increase of 0.093 cigarettes smoked per day.
D)a statistically insignificant increase of 0.093 cigarettes smoked per day.
Unlock Deck
Unlock for access to all 44 flashcards in this deck.
Unlock Deck
k this deck
11
Suppose you wish to know whether Age and Family Size are jointly significant in the model
The appropriate null hypothesis for this test is
A)H0: β0 = β1 = β2 = β3 = 0.
B)H0: β1 = β2 = 0.
C)H0: β1 = 0.
D)H0: β2 = 0.
The appropriate null hypothesis for this test is
A)H0: β0 = β1 = β2 = β3 = 0.
B)H0: β1 = β2 = 0.
C)H0: β1 = 0.
D)H0: β2 = 0.
Unlock Deck
Unlock for access to all 44 flashcards in this deck.
Unlock Deck
k this deck
12
Multiple linear regression analysis determines the
A)true value of the population slope coefficient.
B)linear relationship between the dependent variable and exactly one independent variable.
C)linear relationship between the dependent variable and many independent variables.
D)true value of the population intercept.
A)true value of the population slope coefficient.
B)linear relationship between the dependent variable and exactly one independent variable.
C)linear relationship between the dependent variable and many independent variables.
D)true value of the population intercept.
Unlock Deck
Unlock for access to all 44 flashcards in this deck.
Unlock Deck
k this deck
13
Tests of joint significance are based on comparing
A)the explained sum of squares from the unrestricted regression to the explained sum of squares from the restricted regression.
B)the explained sum of squares from the unrestricted regression to the unexplained sum of squares from the unrestricted regression.
C)the unexplained sum of squares from the restricted regression to the explained sum of squares from the restricted regression.
D)the unexplained sum of squares from the unrestricted regression to the unexplained sum of squares from the restricted regression.
Unlock Deck
Unlock for access to all 44 flashcards in this deck.
Unlock Deck
k this deck
14
The intuition behind a test of joint significance is that if a subset of variables is jointly significant,then
A)the unexplained sum of squares should be much larger in the restricted regression than in the unrestricted regression.
B)the unexplained sum of squares should be much smaller in the restricted regression than in the unrestricted regression.
C)the explained sum of squares should be much smaller in the restricted regression than in the unrestricted regression.
D)the total sum of squares should be much larger in the restricted regression than in the unrestricted regression.
Unlock Deck
Unlock for access to all 44 flashcards in this deck.
Unlock Deck
k this deck
15
Tests of joint significance are used to determine whether
A)the multiple linear regression achieves individual significance of each independent variable.
B)we can reject that specific coefficients are different from 0.
C)the estimated coefficients differ for two different subsets of the data.
D)we can reject that a subset of estimated coefficients are jointly equal to 0.
Unlock Deck
Unlock for access to all 44 flashcards in this deck.
Unlock Deck
k this deck
16
The denominator of the appropriate test statistic for testing for the joint significance of a subset of independent variables is
A)
B)
C)
D)
A)
B)
C)
D)
Unlock Deck
Unlock for access to all 44 flashcards in this deck.
Unlock Deck
k this deck
17
Figure:
Suppose you regress the number of medals won by countries in the 1996,2000,2004,and 2008 Olympics on GDP Per Capita (Thousands),Population (Millions),and Olympic Year and that you get the results in Figure 6.1.
Based on the estimates in Figure 6.1,you should conclude that,holding all other independent variables constant,Olympic Year is estimated to have
A)a statistically significant positive effect on Total Medals Won because -1.128 < .05.
B)a statistically insignificant positive effect on Total Medals Won because |-1.128| > .05.
C)a statistically significant positive effect on Total Medals Won because |-1.128| < 1.96.
D)a statistically insignificant positive effect on Total Medals Won because |-1.128| < 1.96.
Unlock Deck
Unlock for access to all 44 flashcards in this deck.
Unlock Deck
k this deck
18
Figure:
Suppose you regress the number of medals won by countries in the 1996,2000,2004,and 2008 Olympics on GDP Per Capita (Thousands),Population (Millions),and Olympic Year and that you get the results in Figure 6.1.
Based on the estimates in Figure 6.1,you should conclude that a 1 million increase in population is estimated to be associated with
A)a statistically significant .042 increase in population.
B)a statistically significant .042 increase in the total number of medals won,holding all other independent variables constant.
C)a statistically insignificant .042 increase in the total number of medals won.
D)a statistically insignificant .042 increase in the total number of medals won,holding all other independent variables constant.
Unlock Deck
Unlock for access to all 44 flashcards in this deck.
Unlock Deck
k this deck
19
Figure:
Suppose you regress the number of medals won by countries in the 1996,2000,2004,and 2008 Olympics on GDP Per Capita (Thousands),Population (Millions),and Olympic Year and that you get the results in Figure 6.1.
Based on the estimates in Figure 6.1,you should conclude that
A)the regression function is overall statistically significant because 3.6997E - 22 < .05.
B)the regression function is overall statistically insignificant because 3.6997E - 22 < .05.
C)the regression function is overall statistically insignificant because .4739 > .05.
D)the regression function is overall statistically significant because 2.4135E - 09 < 0.05.
Unlock Deck
Unlock for access to all 44 flashcards in this deck.
Unlock Deck
k this deck
20
Figure
Suppose that in the course of testing whether Age and Family Size are jointly significant,you estimate the results in Figure 6.3.
When testing for the joint significance of Age and Family Size (Figure 6.3),the
Is
A)22,548.428.
B)23.294.
C)22,436.942.
D)23.227.
Suppose that in the course of testing whether Age and Family Size are jointly significant,you estimate the results in Figure 6.3.
When testing for the joint significance of Age and Family Size (Figure 6.3),the
Is
A)22,548.428.
B)23.294.
C)22,436.942.
D)23.227.
Unlock Deck
Unlock for access to all 44 flashcards in this deck.
Unlock Deck
k this deck
21
Figure
Suppose that in the course of testing whether Age and Family Size are jointly significant,you estimate the results in Figure 6.3.
Chow tests are based on comparing the
A)sum of the unexplained sums of squares added together from separate regressions to the unexplained sum of squares for the pooled regression.
B)unexplained sums of squares from separate regressions to each other.
C)sum of the explained sums of squares from separate regressions to the explained sum of squares for the pooled regression.
D)explained sums of squares from separate regressions to each other.
Unlock Deck
Unlock for access to all 44 flashcards in this deck.
Unlock Deck
k this deck
22
What is the coefficient of determination? What information does it provide? Explain.
Unlock Deck
Unlock for access to all 44 flashcards in this deck.
Unlock Deck
k this deck
23
Suppose you are estimating salary as a function of age,education,hours of work and the number of young children and you are concerned that the salary functions differ for men and women.You could test this possibility by performing a
A)t-test for individual significance.
B)t-test for joint significance.
C)Chow test.
D)subset test.
A)t-test for individual significance.
B)t-test for joint significance.
C)Chow test.
D)subset test.
Unlock Deck
Unlock for access to all 44 flashcards in this deck.
Unlock Deck
k this deck
24
Figure:
Suppose that in the course of testing whether salary functions differ for males and females,you estimate the pooled and male and female results in Figure 6.4.
The appropriate critical value for the Chow test in Figure 6.4 is
A)1.927.
B)2.032.
C)2.463.
D)2.978.
Suppose that in the course of testing whether salary functions differ for males and females,you estimate the pooled and male and female results in Figure 6.4.
The appropriate critical value for the Chow test in Figure 6.4 is
A)1.927.
B)2.032.
C)2.463.
D)2.978.
Unlock Deck
Unlock for access to all 44 flashcards in this deck.
Unlock Deck
k this deck
25
What are the multiple linear regression assumptions required for OLS to be BLUE? Explain why each one is important.
Unlock Deck
Unlock for access to all 44 flashcards in this deck.
Unlock Deck
k this deck
26
How do you perform a test of the overall significance of the regression function? What are the null and alternative hypothesis for this test? What is the rejection rule? What is the intuition for why the test works? Explain.
Unlock Deck
Unlock for access to all 44 flashcards in this deck.
Unlock Deck
k this deck
27
Figure:
Suppose that in the course of testing whether salary functions differ for males and females,you estimate the pooled and male and female results in Figure 6.4.
Based on the results in Figure 6.4,you should
A)reject the null hypothesis.
B)fail to reject the null hypothesis.
C)reject the alternative hypothesis.
D)fail to reject the alternative hypothesis.
Unlock Deck
Unlock for access to all 44 flashcards in this deck.
Unlock Deck
k this deck
28
How does the Adjusted R-squared differ from the R-squared? Why would the Adjusted R-squared be preferred to the R-squared?
Unlock Deck
Unlock for access to all 44 flashcards in this deck.
Unlock Deck
k this deck
29
Figure:
Suppose that in the course of testing whether salary functions differ for males and females,you estimate the pooled and male and female results in Figure 6.4.
Based on the results of you the Chow test in Figure 6.4 you should
A)focus on the pooled sample results.
B)focus on the male and female subsample results.
C)collect more data that does not fail the Chow test.
D)focus on the male results only.
Unlock Deck
Unlock for access to all 44 flashcards in this deck.
Unlock Deck
k this deck
30
Figure
Suppose that in the course of testing whether Age and Family Size are jointly significant,you estimate the results in Figure 6.3.
When testing for the joint significance of Age and Family Size (Figure 6.3),the appropriate test statistic is
A)37.162.
B)0.115.
C)23.227.
D)1.600.
Suppose that in the course of testing whether Age and Family Size are jointly significant,you estimate the results in Figure 6.3.
When testing for the joint significance of Age and Family Size (Figure 6.3),the appropriate test statistic is
A)37.162.
B)0.115.
C)23.227.
D)1.600.
Unlock Deck
Unlock for access to all 44 flashcards in this deck.
Unlock Deck
k this deck
31
Write out the estimated sample regression function of y on x1 and x2.Explain what each of the estimated values means.
Unlock Deck
Unlock for access to all 44 flashcards in this deck.
Unlock Deck
k this deck
32
How do you perform a test of the joint significance of a subset of slope coefficients? What are the null and alternative hypothesis for this test? What is the rejection rule? What is the intuition for why the test works? Explain.
Unlock Deck
Unlock for access to all 44 flashcards in this deck.
Unlock Deck
k this deck
33
Figure
Suppose that in the course of testing whether Age and Family Size are jointly significant,you estimate the results in Figure 6.3.
When testing for the joint significance of Age and Family Size (Figure 6.3),you should
A)reject the null hypothesis because 1.600 < 2.61.
B)fail to reject the null hypothesis because 1.600 < 2.61.
C)reject the null hypothesis because 1.600 < 8.53.
D)fail to reject the null hypothesis because 1.600 < 8.53.
Unlock Deck
Unlock for access to all 44 flashcards in this deck.
Unlock Deck
k this deck
34
Why is multiple linear regression analysis such a valuable tool? Explain.
Unlock Deck
Unlock for access to all 44 flashcards in this deck.
Unlock Deck
k this deck
35
Figure
Suppose that in the course of testing whether Age and Family Size are jointly significant,you estimate the results in Figure 6.3.
Chow tests are used to determine whether
A)an estimated slope coefficient is different for different subsamples of the data.
B)a subset of independent variables is jointly significant.
C)estimated sample regression functions are different for two different subsamples of the data.
D)a subset of estimated slope coefficients is jointly significant for two different subsamples of the data.
Unlock Deck
Unlock for access to all 44 flashcards in this deck.
Unlock Deck
k this deck
36
How do you perform a test of the individual significance of a slope coefficient? What are the null and alternative hypothesis for this test? What is the rejection rule? What is the intuition for why the test works? Explain.
Unlock Deck
Unlock for access to all 44 flashcards in this deck.
Unlock Deck
k this deck
37
Figure
Suppose that in the course of testing whether Age and Family Size are jointly significant,you estimate the results in Figure 6.3.
When testing for the joint significance of Age and Family Size (Figure 6.3),you should
A)reject the null hypothesis and conclude that β2 = β3 = 0.
B)fail to reject the null hypothesis because and conclude that β2 = β3 = 0.
C)reject the null hypothesis and conclude that at least one of β2 or β3 is not equal to 0.
D)fail to reject the null hypothesis and conclude that at least one of β2 or β3 is not equal to 0.
Unlock Deck
Unlock for access to all 44 flashcards in this deck.
Unlock Deck
k this deck
38
The test statistic for this Chow test is
A)
B)
C)
D)
A)
B)
C)
D)
Unlock Deck
Unlock for access to all 44 flashcards in this deck.
Unlock Deck
k this deck
39
Figure:
Suppose that in the course of testing whether salary functions differ for males and females,you estimate the pooled and male and female results in Figure 6.4.
The tests statistic for the Chow test in Figure 6.4 is
A)0.0436.
B)9.327.
C)18.654.
D)37.307.
Suppose that in the course of testing whether salary functions differ for males and females,you estimate the pooled and male and female results in Figure 6.4.
The tests statistic for the Chow test in Figure 6.4 is
A)0.0436.
B)9.327.
C)18.654.
D)37.307.
Unlock Deck
Unlock for access to all 44 flashcards in this deck.
Unlock Deck
k this deck
40
Why is the "all other independent variables constant" condition important? Explain.
Unlock Deck
Unlock for access to all 44 flashcards in this deck.
Unlock Deck
k this deck
41
A researcher is interested in estimating how the test scores of elementary schools is related to average class size,parents education level (in years),and percent of English learners at the school.The researcher obtains a sample of 200 California public schools and obtains the following results with standard errors are in parentheses
a)The F-statistic for this regression is 48.32.Test the overall significance of the regression model at the 5% level.What are the hypothesis,critical value,rejection rule and decision.
b)Perform a t-test of for the individual significance for the slopes.
c)Comment on the economic significance of the coefficient estimates.
d)If you are interested in sending your child to a school with high test scores what would factors would you look for?
Unlock Deck
Unlock for access to all 44 flashcards in this deck.
Unlock Deck
k this deck
42
A researcher is interested in estimating how the test scores of elementary schools is related to average class size,parents education level (in years),and percent of English learners at the school.The researcher obtains a sample of 200 California public schools and obtains the following results
a)Interpret the coefficient estimates.Are these results consistent with what you expected?
b)Are there any omitted variables in this regression? If so,list them.
c)Interpret the R-squared.Is the value of the R-squared high as you expected?
d)Calculate the Adjusted R-squared and comment on what it means.
e)Predict the test score for a school with average class sizes of 28,an education level of 14 years,and 3% English learners.
f)Design an experiment to determine how class size affects test scores.How would the results from that experiment differ from the results presented above?
Unlock Deck
Unlock for access to all 44 flashcards in this deck.
Unlock Deck
k this deck
43
How do you perform a Chow test for structural differences between two subsets of the data? What is the rejection rule? What is the intuition for why the test works? Explain.
Unlock Deck
Unlock for access to all 44 flashcards in this deck.
Unlock Deck
k this deck
44
Suppose you are interested in determining the factors that determine the number of crimes committed on campus.To this end,you collect data from 75 colleges on number of crimes per students enrolled,number of police officers per students,unemployment rate,tuition,and the percentage of male students.You run a regression and obtain the following results
a)Which of the coefficient estimates are statistically significant at the 5% level?
b)You run an additional regression in order to jointly test if two coefficients are equal to 0.State the hypothesis,calculate the test statistic,state the regression rule,and state your decision.
a)Which of the coefficient estimates are statistically significant at the 5% level?
b)You run an additional regression in order to jointly test if two coefficients are equal to 0.State the hypothesis,calculate the test statistic,state the regression rule,and state your decision.
Unlock Deck
Unlock for access to all 44 flashcards in this deck.
Unlock Deck
k this deck
Unlock Deck
Unlock for access to all 44 flashcards in this deck.


