Deck 3: Demand, Supply, and Market Equilibrium
Full screen (f)
Question
Question
Question
Question
Question
Question
Question
Question
Question
Question
Question
Question
Question
Question
Question
Question
Question
Question
Question
Question
Question
Question
The table below shows the market demand for a bushel of wheat in a market where there are just three buyers (data are hypothetical).
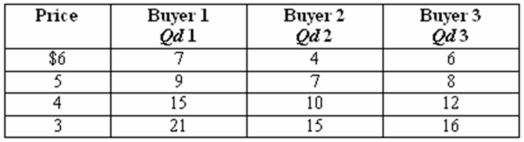
Refer to the above table.At a price of $6,the market demand for bushels of wheat among the three buyers in the market is:
A) 17
B) 24
C) 37
D) 49
Refer to the above table.At a price of $6,the market demand for bushels of wheat among the three buyers in the market is:
A) 17
B) 24
C) 37
D) 49
Question
Question
Question
Question
Question
Question
Question
Question
Question
Question
Question
Refer to the diagram,which shows three demand curves for coffee.Which of the following would cause the change in the demand for coffee illustrated by the shift from D1 to D2? 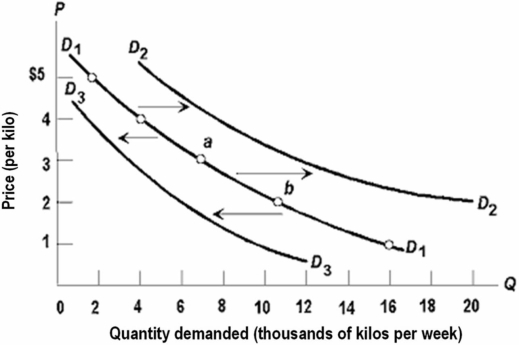
A) a decrease in the price of tea
B) an increase in consumer incomes
C) an increase in the price of sugar
D) a technological improvement in the production of coffee
A) a decrease in the price of tea
B) an increase in consumer incomes
C) an increase in the price of sugar
D) a technological improvement in the production of coffee
Question
Question
The table below shows the market demand for a bushel of wheat in a market where there are just three buyers (data are hypothetical).
Refer to the above table.The quantity demanded for wheat is:
A) 17 bushels at $6 and 37 bushels at $5.
B) 24 bushels at $5 and 52 bushels at $4.
C) 37 bushels at $4 and 52 bushels at $3.
D) 52 bushels at $3 and 37 bushels at $5.
Refer to the above table.The quantity demanded for wheat is:
A) 17 bushels at $6 and 37 bushels at $5.
B) 24 bushels at $5 and 52 bushels at $4.
C) 37 bushels at $4 and 52 bushels at $3.
D) 52 bushels at $3 and 37 bushels at $5.
Question
Question
The table below shows the market demand for a bushel of wheat in a market where there are just three buyers (data are hypothetical).
Refer to the above table.If there were 500 buyers with demand schedules similar to the market demand schedule for each of the three buyers in the table above,then the quantity of bushels of wheat demanded at $5 by the 500 buyers would be:
A) 8,500
B) 12,000
C) 18,500
D) 26,000
Refer to the above table.If there were 500 buyers with demand schedules similar to the market demand schedule for each of the three buyers in the table above,then the quantity of bushels of wheat demanded at $5 by the 500 buyers would be:
A) 8,500
B) 12,000
C) 18,500
D) 26,000
Question
Question
Question
Question
Question
Question
Question
Question
Question
Question
Question
Question
Question
Question
Question
Question
Question
Question
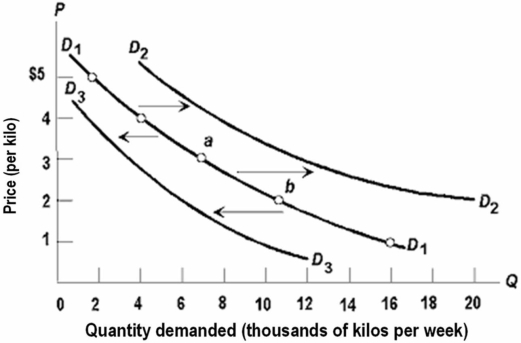
Refer to the above diagram,which shows three demand curves for coffee.Which of the following would cause the change in the demand for coffee illustrated by the shift from D1 to D3?
A) a decrease in the price of tea
B) an increase in consumer incomes
C) a decrease in the price of sugar
D) a technological improvement in the production of coffee
Question
Question
Question
Question
Question
Question
Question
Question
Refer to the diagram,which shows demand and supply conditions in the competitive market for product X.A shift in the demand curve from D0 to D1 might be caused by a(n): 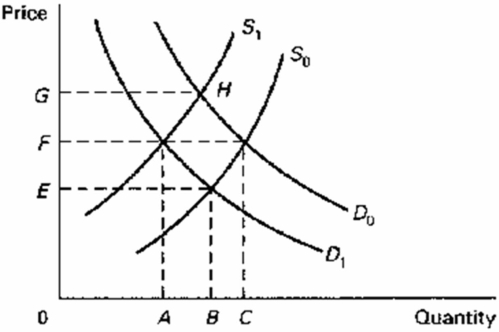
A) decrease in income if X is an inferior good.
B) increase in the price of complementary good Y.
C) increase in money incomes if X is a normal good.
D) increase in the price of substitute product Y.
A) decrease in income if X is an inferior good.
B) increase in the price of complementary good Y.
C) increase in money incomes if X is a normal good.
D) increase in the price of substitute product Y.
Question
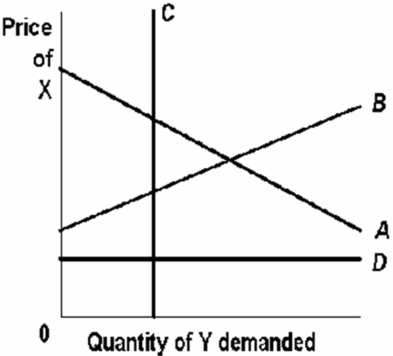
Refer to the above graph.X and Y are substitute products.Which one of the lines in the graph best illustrates this relationship?
A) A
B) B
C) C
D) D
Question
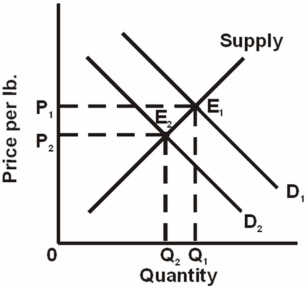
Refer to the above graph,which shows the market for chicken where D1 and D2 represent different demand curves.A change from E1 to E2 is most likely to result from:
A) a decrease in consumer incomes.
B) an increase in the wages of chicken workers.
C) an increase in the price of beef products.
D) improved technology in the chicken industry.
Question
Question
Refer to the above graph.X and Y are complementary products.Which one of the lines in the graph best illustrates this relationship?
A) A
B) B
C) C
D) D
Question
Question
Question
Question
Question
Question
Question
Refer to the above graph.X and Y are unrelated products.Which one of the lines in the graph best illustrates this relationship?
A) A
B) B
C) C
D) D
Question
Question
Question
Refer to the above graph,which shows the market for chicken where D1 and D2 represent different demand curves.A change from E1 to E2 is most likely to result from:
A) an increase in expectations of higher future prices for chicken.
B) an increase in the cost of chicken feed to produce chickens.
C) a decrease in the price of beef products.
D) an increase in consumer incomes.
Question
Question
Question

Unlock Deck
Sign up to unlock the cards in this deck!
Unlock Deck
Unlock Deck
1/284
Play
Full screen (f)
Deck 3: Demand, Supply, and Market Equilibrium
1
The demand curve shows the relationship between:
A) money income and quantity demanded.
B) price and production costs.
C) price and quantity demanded.
D) consumer tastes and the quantity demanded.
A) money income and quantity demanded.
B) price and production costs.
C) price and quantity demanded.
D) consumer tastes and the quantity demanded.
price and quantity demanded.
2
When the price of a product increases,a consumer is able to buy less of it with a given money income.This describes:
A) the cost effect.
B) the inflationary effect.
C) the income effect.
D) the substitution effect.
A) the cost effect.
B) the inflationary effect.
C) the income effect.
D) the substitution effect.
the income effect.
3
One reason why the quantity demanded of a good increases when its price falls is that the:
A) lower price shifts the supply curve to the left.
B) lower price shifts the demand curve to the left.
C) lower price shifts the demand curve to the right.
D) lower price increases the real incomes of buyers,enabling them to buy more.
A) lower price shifts the supply curve to the left.
B) lower price shifts the demand curve to the left.
C) lower price shifts the demand curve to the right.
D) lower price increases the real incomes of buyers,enabling them to buy more.
lower price increases the real incomes of buyers,enabling them to buy more.
4
An increase in the price of a product will reduce the amount of it purchased because:
A) supply curves are upsloping.
B) the higher price means that real incomes have risen.
C) consumers will substitute other products for the one whose price has risen.
D) consumers substitute relatively high-priced for relatively low-priced products.
A) supply curves are upsloping.
B) the higher price means that real incomes have risen.
C) consumers will substitute other products for the one whose price has risen.
D) consumers substitute relatively high-priced for relatively low-priced products.
Unlock Deck
Unlock for access to all 284 flashcards in this deck.
Unlock Deck
k this deck
5
When the price of a product falls,the purchasing power of our money income rises and thus permits us to purchase more of the product.This statement describes:
A) an inferior good.
B) the rationing function of prices.
C) the substitution effect.
D) the income effect.
A) an inferior good.
B) the rationing function of prices.
C) the substitution effect.
D) the income effect.
Unlock Deck
Unlock for access to all 284 flashcards in this deck.
Unlock Deck
k this deck
6
As a result of a decrease in the price of a hamburger,consumers buy more hamburgers and fewer frankfurters.This is an illustration of:
A) consumer sovereignty.
B) the income effect.
C) the substitution effect.
D) changing tastes and preferences.
A) consumer sovereignty.
B) the income effect.
C) the substitution effect.
D) changing tastes and preferences.
Unlock Deck
Unlock for access to all 284 flashcards in this deck.
Unlock Deck
k this deck
7
When the price of one fruit increases,consumers buy more of another fruit.This situation is an illustration of:
A) the income effect.
B) the substitution effect.
C) diminishing marginal utility.
D) the rationing function of prices.
A) the income effect.
B) the substitution effect.
C) diminishing marginal utility.
D) the rationing function of prices.
Unlock Deck
Unlock for access to all 284 flashcards in this deck.
Unlock Deck
k this deck
8
The horizontal axis of a graph which shows a market demand curve indicates the:
A) prices at which various levels of output can be sold.
B) number of consumers who are in the market for this product.
C) various quantities of output at which the market will be cleared.
D) quantities which consumers will be willing and able to buy at various prices.
A) prices at which various levels of output can be sold.
B) number of consumers who are in the market for this product.
C) various quantities of output at which the market will be cleared.
D) quantities which consumers will be willing and able to buy at various prices.
Unlock Deck
Unlock for access to all 284 flashcards in this deck.
Unlock Deck
k this deck
9
The income and substitution effects account for:
A) the upward sloping supply curve.
B) the downward sloping demand curve.
C) movements along a given supply curve.
D) the "other things equal" assumption.
A) the upward sloping supply curve.
B) the downward sloping demand curve.
C) movements along a given supply curve.
D) the "other things equal" assumption.
Unlock Deck
Unlock for access to all 284 flashcards in this deck.
Unlock Deck
k this deck
10
A result of a fall in the price of gasoline,consumers buy more gasoline and take more driving vacations.This situation is an illustration of:
A) the income effect.
B) the substitution effect.
C) diminishing marginal utility.
D) the demand for inferior goods.
A) the income effect.
B) the substitution effect.
C) diminishing marginal utility.
D) the demand for inferior goods.
Unlock Deck
Unlock for access to all 284 flashcards in this deck.
Unlock Deck
k this deck
11
The law of demand states that:
A) price and quantity demanded are inversely related.
B) the larger the number of buyers in a market,the lower will be product price.
C) price and quantity demanded are directly related.
D) consumers will buy more of a product at high prices than at low prices.
A) price and quantity demanded are inversely related.
B) the larger the number of buyers in a market,the lower will be product price.
C) price and quantity demanded are directly related.
D) consumers will buy more of a product at high prices than at low prices.
Unlock Deck
Unlock for access to all 284 flashcards in this deck.
Unlock Deck
k this deck
12
As a result of a decrease in the price of hamburgers,consumers buy more hamburgers and more T-bone steak.This is an illustration of:
A) irrational consumer behaviour.
B) changing tastes and preferences.
C) the substitution effect.
D) the income effect.
A) irrational consumer behaviour.
B) changing tastes and preferences.
C) the substitution effect.
D) the income effect.
Unlock Deck
Unlock for access to all 284 flashcards in this deck.
Unlock Deck
k this deck
13
A demand curve:
A) shows the relationship between price and quantity demanded.
B) indicates the quantity demanded at each price in a series of prices.
C) graphs as a downsloping line.
D) has all of the above characteristics.
A) shows the relationship between price and quantity demanded.
B) indicates the quantity demanded at each price in a series of prices.
C) graphs as a downsloping line.
D) has all of the above characteristics.
Unlock Deck
Unlock for access to all 284 flashcards in this deck.
Unlock Deck
k this deck
14
During the 1970s the price of oil rose dramatically,which in turn caused the price of coal to increase.This can best be explained by saying that oil and coal are:
A) complementary goods and the higher price for oil increased the demand for coal.
B) substitute goods and the higher price for oil increased the demand for coal.
C) complementary goods and the higher price for oil decreased the supply of coal.
D) substitute goods and the higher price for oil decreased the supply of coal.
Unlock Deck
Unlock for access to all 284 flashcards in this deck.
Unlock Deck
k this deck
15
When product prices change,consumers are inclined to purchase larger amounts of the now cheaper products and less of the now dearer products.This describes:
A) the cost effect.
B) the price effect.
C) the income effect.
D) the substitution effect.
A) the cost effect.
B) the price effect.
C) the income effect.
D) the substitution effect.
Unlock Deck
Unlock for access to all 284 flashcards in this deck.
Unlock Deck
k this deck
16
A market demand schedule for a product indicates that:
A) as the product's price falls,consumers buy less of the good.
B) there is a direct relationship between price and quantity demanded.
C) as a product's price rises,consumers buy less of other goods.
D) there is an inverse relationship between price and quantity demanded.
A) as the product's price falls,consumers buy less of the good.
B) there is a direct relationship between price and quantity demanded.
C) as a product's price rises,consumers buy less of other goods.
D) there is an inverse relationship between price and quantity demanded.
Unlock Deck
Unlock for access to all 284 flashcards in this deck.
Unlock Deck
k this deck
17
Graphically,the market demand curve is:
A) steeper than any individual demand curve which comprises it.
B) greater than the sum of the individual demand curves.
C) the horizontal sum of individual demand curves.
D) the vertical sum of individual demand curves.
A) steeper than any individual demand curve which comprises it.
B) greater than the sum of the individual demand curves.
C) the horizontal sum of individual demand curves.
D) the vertical sum of individual demand curves.
Unlock Deck
Unlock for access to all 284 flashcards in this deck.
Unlock Deck
k this deck
18
Economists use the term "demand" as:
A) a particular price-quantity combination on a stable demand curve.
B) the total amount spent on a particular commodity over a stipulated time period.
C) an upsloping line on a graph which relates consumer purchases and product price.
D) a schedule of various combinations of market prices and amounts demanded.
Unlock Deck
Unlock for access to all 284 flashcards in this deck.
Unlock Deck
k this deck
19
When the price of a product rises,consumers shift their purchases to other products whose prices are now relatively lower.This statement describes:
A) an inferior good.
B) complementary goods.
C) the substitution effect.
D) the income effect.
A) an inferior good.
B) complementary goods.
C) the substitution effect.
D) the income effect.
Unlock Deck
Unlock for access to all 284 flashcards in this deck.
Unlock Deck
k this deck
20
The law of demand is illustrated by a demand curve that is:
A) vertical.
B) horizontal.
C) upward sloping.
D) downward sloping.
A) vertical.
B) horizontal.
C) upward sloping.
D) downward sloping.
Unlock Deck
Unlock for access to all 284 flashcards in this deck.
Unlock Deck
k this deck
21
Which of the following would usually be an inferior good?
A) French wines
B) generic beer
C) theatre tickets
D) steak
A) French wines
B) generic beer
C) theatre tickets
D) steak
Unlock Deck
Unlock for access to all 284 flashcards in this deck.
Unlock Deck
k this deck
22
The table below shows the market demand for a bushel of wheat in a market where there are just three buyers (data are hypothetical).
Refer to the above table.At a price of $6,the market demand for bushels of wheat among the three buyers in the market is:
A) 17
B) 24
C) 37
D) 49
Refer to the above table.At a price of $6,the market demand for bushels of wheat among the three buyers in the market is:
A) 17
B) 24
C) 37
D) 49
Unlock Deck
Unlock for access to all 284 flashcards in this deck.
Unlock Deck
k this deck
23
An "increase in demand" means that:
A) given supply,the price of the product can be expected to decline.
B) the demand curve has shifted to the right.
C) price has declined and consumers therefore want to purchase more of the product.
D) the demand curve has shifted to the left.
A) given supply,the price of the product can be expected to decline.
B) the demand curve has shifted to the right.
C) price has declined and consumers therefore want to purchase more of the product.
D) the demand curve has shifted to the left.
Unlock Deck
Unlock for access to all 284 flashcards in this deck.
Unlock Deck
k this deck
24
Which of the following is most likely to be an inferior good?
A) fur coats
B) Porsches
C) used clothing
D) steak
A) fur coats
B) Porsches
C) used clothing
D) steak
Unlock Deck
Unlock for access to all 284 flashcards in this deck.
Unlock Deck
k this deck
25
Graphically,the horizontal sum of all individual demand curves is known as:
A) consumers' tastes and preferences.
B) the market demand curve.
C) the equilibrium price.
D) consumer sovereignty.
A) consumers' tastes and preferences.
B) the market demand curve.
C) the equilibrium price.
D) consumer sovereignty.
Unlock Deck
Unlock for access to all 284 flashcards in this deck.
Unlock Deck
k this deck
26
In presenting the notion of a demand curve economists presume that the most important variable in determining the quantity demanded is:
A) the price of the product itself.
B) consumer income.
C) the prices of related goods.
D) consumer tastes.
A) the price of the product itself.
B) consumer income.
C) the prices of related goods.
D) consumer tastes.
Unlock Deck
Unlock for access to all 284 flashcards in this deck.
Unlock Deck
k this deck
27
A normal good is one:
A) for which quantity demanded remains the same even as price increases.
B) for which quantity supplied falls as price increases.
C) for which demand increases when price decreases.
D) for which demand increases when income increases.
A) for which quantity demanded remains the same even as price increases.
B) for which quantity supplied falls as price increases.
C) for which demand increases when price decreases.
D) for which demand increases when income increases.
Unlock Deck
Unlock for access to all 284 flashcards in this deck.
Unlock Deck
k this deck
28
If product Y is an inferior good,an increase in consumer incomes will:
A) result in a surplus of product Y.
B) not affect the sales of product Y.
C) shift the demand curve for product Y to the left.
D) shift the demand curve for product Y to the right.
A) result in a surplus of product Y.
B) not affect the sales of product Y.
C) shift the demand curve for product Y to the left.
D) shift the demand curve for product Y to the right.
Unlock Deck
Unlock for access to all 284 flashcards in this deck.
Unlock Deck
k this deck
29
In constructing a stable demand curve for product X:
A) consumer preferences are allowed to vary.
B) the prices of other goods are assumed to be constant.
C) money incomes are allowed to vary.
D) the supply curve of product X is assumed to be fixed.
A) consumer preferences are allowed to vary.
B) the prices of other goods are assumed to be constant.
C) money incomes are allowed to vary.
D) the supply curve of product X is assumed to be fixed.
Unlock Deck
Unlock for access to all 284 flashcards in this deck.
Unlock Deck
k this deck
30
If consumers are willing to pay a higher price than previously for each level of output,we can say that there has occurred:
A) a decrease in demand.
B) an increase in demand.
C) a decrease in supply.
D) an increase in supply.
A) a decrease in demand.
B) an increase in demand.
C) a decrease in supply.
D) an increase in supply.
Unlock Deck
Unlock for access to all 284 flashcards in this deck.
Unlock Deck
k this deck
31
A shift to the right in the demand curve for product A can be most reasonably explained by saying that:
A) consumer incomes have declined and they now want to buy less of A at each possible price.
B) the price of A has increased and,as a result,consumers want to purchase less of it.
C) consumer preferences have changed in favour of A so that they now want to buy more at each possible price.
D) the price of A has declined and,as a result,consumers want to purchase more of it.
Unlock Deck
Unlock for access to all 284 flashcards in this deck.
Unlock Deck
k this deck
32
For most commodities,purchases tend to rise with increases in buyers' incomes,and fall with decreases in buyers' incomes.Such commodities are known as:
A) inferior goods.
B) direct goods.
C) average goods.
D) normal goods.
A) inferior goods.
B) direct goods.
C) average goods.
D) normal goods.
Unlock Deck
Unlock for access to all 284 flashcards in this deck.
Unlock Deck
k this deck
33
Refer to the diagram,which shows three demand curves for coffee.Which of the following would cause the change in the demand for coffee illustrated by the shift from D1 to D2?
A) a decrease in the price of tea
B) an increase in consumer incomes
C) an increase in the price of sugar
D) a technological improvement in the production of coffee
A) a decrease in the price of tea
B) an increase in consumer incomes
C) an increase in the price of sugar
D) a technological improvement in the production of coffee
Unlock Deck
Unlock for access to all 284 flashcards in this deck.
Unlock Deck
k this deck
34
An inferior good is:
A) one whose demand curve will shift rightward as incomes rise.
B) one whose price and quantity demanded varies directly.
C) one which has not been approved by the federal Ministry of Agriculture.
D) one whose demand curve will shift leftward as income rise.
A) one whose demand curve will shift rightward as incomes rise.
B) one whose price and quantity demanded varies directly.
C) one which has not been approved by the federal Ministry of Agriculture.
D) one whose demand curve will shift leftward as income rise.
Unlock Deck
Unlock for access to all 284 flashcards in this deck.
Unlock Deck
k this deck
35
The table below shows the market demand for a bushel of wheat in a market where there are just three buyers (data are hypothetical).
Refer to the above table.The quantity demanded for wheat is:
A) 17 bushels at $6 and 37 bushels at $5.
B) 24 bushels at $5 and 52 bushels at $4.
C) 37 bushels at $4 and 52 bushels at $3.
D) 52 bushels at $3 and 37 bushels at $5.
Refer to the above table.The quantity demanded for wheat is:
A) 17 bushels at $6 and 37 bushels at $5.
B) 24 bushels at $5 and 52 bushels at $4.
C) 37 bushels at $4 and 52 bushels at $3.
D) 52 bushels at $3 and 37 bushels at $5.
Unlock Deck
Unlock for access to all 284 flashcards in this deck.
Unlock Deck
k this deck
36
By an "increase in demand" we mean:
A) that product price has fallen so consumers move down to a new point on the demand curve.
B) the quantity demanded at each price in a set of prices is greater.
C) the quantity demanded at each price in a set of prices is smaller.
D) none of the above.
A) that product price has fallen so consumers move down to a new point on the demand curve.
B) the quantity demanded at each price in a set of prices is greater.
C) the quantity demanded at each price in a set of prices is smaller.
D) none of the above.
Unlock Deck
Unlock for access to all 284 flashcards in this deck.
Unlock Deck
k this deck
37
The table below shows the market demand for a bushel of wheat in a market where there are just three buyers (data are hypothetical).
Refer to the above table.If there were 500 buyers with demand schedules similar to the market demand schedule for each of the three buyers in the table above,then the quantity of bushels of wheat demanded at $5 by the 500 buyers would be:
A) 8,500
B) 12,000
C) 18,500
D) 26,000
Refer to the above table.If there were 500 buyers with demand schedules similar to the market demand schedule for each of the three buyers in the table above,then the quantity of bushels of wheat demanded at $5 by the 500 buyers would be:
A) 8,500
B) 12,000
C) 18,500
D) 26,000
Unlock Deck
Unlock for access to all 284 flashcards in this deck.
Unlock Deck
k this deck
38
An inferior good is one:
A) that doesn't work.
B) that costs too much.
C) that won't be purchased at any price.
D) for which demand increases as income decreases.
A) that doesn't work.
B) that costs too much.
C) that won't be purchased at any price.
D) for which demand increases as income decreases.
Unlock Deck
Unlock for access to all 284 flashcards in this deck.
Unlock Deck
k this deck
39
An economist predicts that in a bicycle company,other things equal,a rise in consumer incomes will increase the demand for bicycles.This prediction is based on the assumption that:
A) there are many goods which are substitutes for bicycles.
B) there are many goods which are complementary to bicycles.
C) there are few goods which are substitutes for bicycles.
D) bicycles are normal goods.
A) there are many goods which are substitutes for bicycles.
B) there are many goods which are complementary to bicycles.
C) there are few goods which are substitutes for bicycles.
D) bicycles are normal goods.
Unlock Deck
Unlock for access to all 284 flashcards in this deck.
Unlock Deck
k this deck
40
When economists say that the demand for a product has increased,they mean that::
A) consumers are now willing to purchase more of this product at each possible price.
B) the product has become particularly scarce for some reason.
C) the product price has fallen and as a consequence consumers are buying a larger quantity of the product.
D) the demand curve has shifted to the left.
Unlock Deck
Unlock for access to all 284 flashcards in this deck.
Unlock Deck
k this deck
41
If Z is an inferior good,a decrease in money income will shift the:
A) supply curve for Z to the left.
B) supply curve for Z to the right.
C) demand curve for Z to the left.
D) demand curve for Z to the right.
A) supply curve for Z to the left.
B) supply curve for Z to the right.
C) demand curve for Z to the left.
D) demand curve for Z to the right.
Unlock Deck
Unlock for access to all 284 flashcards in this deck.
Unlock Deck
k this deck
42
For some commodities,purchases tend to decrease as the buyer's income increases.Such commodities are known as:
A) common goods.
B) inferior goods.
C) inverse goods.
D) normal goods.
A) common goods.
B) inferior goods.
C) inverse goods.
D) normal goods.
Unlock Deck
Unlock for access to all 284 flashcards in this deck.
Unlock Deck
k this deck
43
If the price of K declines,the demand curve for the complementary product J will:
A) shift to the left.
B) decrease.
C) shift to the right.
D) remain unchanged.
A) shift to the left.
B) decrease.
C) shift to the right.
D) remain unchanged.
Unlock Deck
Unlock for access to all 284 flashcards in this deck.
Unlock Deck
k this deck
44
An increase in consumer incomes will:
A) increase the demand for an inferior good.
B) increase the supply of an inferior good.
C) increase the demand for a normal good.
D) decrease the supply of a normal good.
A) increase the demand for an inferior good.
B) increase the supply of an inferior good.
C) increase the demand for a normal good.
D) decrease the supply of a normal good.
Unlock Deck
Unlock for access to all 284 flashcards in this deck.
Unlock Deck
k this deck
45
If L and M are complementary goods,an increase in the price of L will result in:
A) an increase in the sales of L.
B) no change in either the price or sales of M.
C) a decrease in the sales of M.
D) an increase in the sales of M.
A) an increase in the sales of L.
B) no change in either the price or sales of M.
C) a decrease in the sales of M.
D) an increase in the sales of M.
Unlock Deck
Unlock for access to all 284 flashcards in this deck.
Unlock Deck
k this deck
46
Blu Ray players and Blu Ray discs are:
A) complementary goods.
B) substitute goods.
C) independent goods.
D) inferior goods.
A) complementary goods.
B) substitute goods.
C) independent goods.
D) inferior goods.
Unlock Deck
Unlock for access to all 284 flashcards in this deck.
Unlock Deck
k this deck
47
Assume the demand curve for product X shifts to the right.This might be caused by:
A) a decline in income if X is an inferior good.
B) a decline in the price of Z if X and Z are substitute goods.
C) a change in consumer tastes which is unfavourable to X.
D) an increase in the price of Y if X and Y are complementary goods.
A) a decline in income if X is an inferior good.
B) a decline in the price of Z if X and Z are substitute goods.
C) a change in consumer tastes which is unfavourable to X.
D) an increase in the price of Y if X and Y are complementary goods.
Unlock Deck
Unlock for access to all 284 flashcards in this deck.
Unlock Deck
k this deck
48
The demand for most products varies directly with changes in consumer incomes.Such products are known as:
A) complementary goods.
B) competitive goods.
C) inferior goods.
D) normal goods.
A) complementary goods.
B) competitive goods.
C) inferior goods.
D) normal goods.
Unlock Deck
Unlock for access to all 284 flashcards in this deck.
Unlock Deck
k this deck
49
A normal good is defined as one:
A) whose amount demanded will increase as its price decreases.
B) whose amount demanded will increase as its price increases.
C) whose demand curve will shift leftward as incomes rise.
D) the consumption of which varies directly with incomes.
A) whose amount demanded will increase as its price decreases.
B) whose amount demanded will increase as its price increases.
C) whose demand curve will shift leftward as incomes rise.
D) the consumption of which varies directly with incomes.
Unlock Deck
Unlock for access to all 284 flashcards in this deck.
Unlock Deck
k this deck
50
If the demand for a normal good (for example,steak)shifts to the left,the most likely reason is that:
A) consumer incomes have fallen.
B) cattle production has declined.
C) the price of steak has risen.
D) the price of cattle feed has gone up.
A) consumer incomes have fallen.
B) cattle production has declined.
C) the price of steak has risen.
D) the price of cattle feed has gone up.
Unlock Deck
Unlock for access to all 284 flashcards in this deck.
Unlock Deck
k this deck
51
If X is a normal good,a rise in money income will shift the:
A) supply curve for X to the left.
B) supply curve for X to the right.
C) demand curve for X to the left.
D) demand curve for X to the right.
A) supply curve for X to the left.
B) supply curve for X to the right.
C) demand curve for X to the left.
D) demand curve for X to the right.
Unlock Deck
Unlock for access to all 284 flashcards in this deck.
Unlock Deck
k this deck
52
Tennis rackets and ballpoint pens are:
A) substitute goods.
B) complementary goods.
C) inferior goods.
D) independent goods.
A) substitute goods.
B) complementary goods.
C) inferior goods.
D) independent goods.
Unlock Deck
Unlock for access to all 284 flashcards in this deck.
Unlock Deck
k this deck
53
If the demand curve for product B shifts to the right as the price of product A declines,it can be concluded that:
A) both A and B are inferior goods.
B) A is a superior good and B is an inferior good.
C) A is an inferior good and B is a superior good.
D) A and B are complementary goods.
A) both A and B are inferior goods.
B) A is a superior good and B is an inferior good.
C) A is an inferior good and B is a superior good.
D) A and B are complementary goods.
Unlock Deck
Unlock for access to all 284 flashcards in this deck.
Unlock Deck
k this deck
54
If consumer incomes increase,the demand for product X:
A) will necessarily remain unchanged.
B) may shift either to the right or left.
C) will necessarily shift to the right.
D) will necessarily shift to the left.
A) will necessarily remain unchanged.
B) may shift either to the right or left.
C) will necessarily shift to the right.
D) will necessarily shift to the left.
Unlock Deck
Unlock for access to all 284 flashcards in this deck.
Unlock Deck
k this deck
55
Refer to the above diagram,which shows three demand curves for coffee.Which of the following would cause the change in the demand for coffee illustrated by the shift from D1 to D3?
A) a decrease in the price of tea
B) an increase in consumer incomes
C) a decrease in the price of sugar
D) a technological improvement in the production of coffee
Unlock Deck
Unlock for access to all 284 flashcards in this deck.
Unlock Deck
k this deck
56
Which factor will increase the demand for a product?
A) an unfavourable report on the value of the product
B) an increase in the price of a substitute product
C) an increase in the price of a complementary product
D) a decrease in the number of buyers
A) an unfavourable report on the value of the product
B) an increase in the price of a substitute product
C) an increase in the price of a complementary product
D) a decrease in the number of buyers
Unlock Deck
Unlock for access to all 284 flashcards in this deck.
Unlock Deck
k this deck
57
Which of the following will cause the demand curve for product A to shift to the left?
A) population growth which causes an expansion in the number of persons consuming A
B) an increase in money income if A is a normal good
C) a decrease in the price of complementary product C
D) an increase in money income if A is an inferior good
A) population growth which causes an expansion in the number of persons consuming A
B) an increase in money income if A is a normal good
C) a decrease in the price of complementary product C
D) an increase in money income if A is an inferior good
Unlock Deck
Unlock for access to all 284 flashcards in this deck.
Unlock Deck
k this deck
58
If an increase in consumer incomes causes the demand curve for product Z to shift to the left,then it can be said that product Z is a(n):
A) normal good.
B) luxury good.
C) inferior good.
D) inexpensive good.
A) normal good.
B) luxury good.
C) inferior good.
D) inexpensive good.
Unlock Deck
Unlock for access to all 284 flashcards in this deck.
Unlock Deck
k this deck
59
If two goods are complements:
A) they are consumed jointly.
B) an increase in the price of one will reduce the demand for the other.
C) a decrease in the price of one will increase the demand for the other.
D) all of the above will be true.
A) they are consumed jointly.
B) an increase in the price of one will reduce the demand for the other.
C) a decrease in the price of one will increase the demand for the other.
D) all of the above will be true.
Unlock Deck
Unlock for access to all 284 flashcards in this deck.
Unlock Deck
k this deck
60
If the price of product L increases,the demand curve for close-substitute product J will:
A) shift downward toward the horizontal axis.
B) shift to the left.
C) shift to the right.
D) remain unchanged.
A) shift downward toward the horizontal axis.
B) shift to the left.
C) shift to the right.
D) remain unchanged.
Unlock Deck
Unlock for access to all 284 flashcards in this deck.
Unlock Deck
k this deck
61
Which of the following will not cause the demand for product K to change?
A) a change in the price of close-substitute product J
B) an increase in consumer incomes
C) a change in the price of K
D) a change in consumer tastes
A) a change in the price of close-substitute product J
B) an increase in consumer incomes
C) a change in the price of K
D) a change in consumer tastes
Unlock Deck
Unlock for access to all 284 flashcards in this deck.
Unlock Deck
k this deck
62
Lamps and light bulbs are:
A) substitute goods.
B) complementary goods.
C) independent goods.
D) inferior goods.
A) substitute goods.
B) complementary goods.
C) independent goods.
D) inferior goods.
Unlock Deck
Unlock for access to all 284 flashcards in this deck.
Unlock Deck
k this deck
63
Refer to the diagram,which shows demand and supply conditions in the competitive market for product X.A shift in the demand curve from D0 to D1 might be caused by a(n):
A) decrease in income if X is an inferior good.
B) increase in the price of complementary good Y.
C) increase in money incomes if X is a normal good.
D) increase in the price of substitute product Y.
A) decrease in income if X is an inferior good.
B) increase in the price of complementary good Y.
C) increase in money incomes if X is a normal good.
D) increase in the price of substitute product Y.
Unlock Deck
Unlock for access to all 284 flashcards in this deck.
Unlock Deck
k this deck
64
Refer to the above graph.X and Y are substitute products.Which one of the lines in the graph best illustrates this relationship?
A) A
B) B
C) C
D) D
Unlock Deck
Unlock for access to all 284 flashcards in this deck.
Unlock Deck
k this deck
65
Refer to the above graph,which shows the market for chicken where D1 and D2 represent different demand curves.A change from E1 to E2 is most likely to result from:
A) a decrease in consumer incomes.
B) an increase in the wages of chicken workers.
C) an increase in the price of beef products.
D) improved technology in the chicken industry.
Unlock Deck
Unlock for access to all 284 flashcards in this deck.
Unlock Deck
k this deck
66
If products A and B are complements and the price of B decreases:
A) the demand curves for both A and B will shift to the left.
B) the amount of B purchased will increase,but the demand curve for A will not shift.
C) the demand for A will increase and the quantity demanded of B will increase.
D) the demand for A will decline and the demand for B will increase.
A) the demand curves for both A and B will shift to the left.
B) the amount of B purchased will increase,but the demand curve for A will not shift.
C) the demand for A will increase and the quantity demanded of B will increase.
D) the demand for A will decline and the demand for B will increase.
Unlock Deck
Unlock for access to all 284 flashcards in this deck.
Unlock Deck
k this deck
67
Refer to the above graph.X and Y are complementary products.Which one of the lines in the graph best illustrates this relationship?
A) A
B) B
C) C
D) D
Unlock Deck
Unlock for access to all 284 flashcards in this deck.
Unlock Deck
k this deck
68
Assume that the demand schedule for product C is downsloping.If the price of C falls from $2.00 to $1.75:
A) a smaller quantity of C will be demanded.
B) a larger quantity of C will be demanded.
C) the demand for C will increase.
D) the demand for C will decrease.
A) a smaller quantity of C will be demanded.
B) a larger quantity of C will be demanded.
C) the demand for C will increase.
D) the demand for C will decrease.
Unlock Deck
Unlock for access to all 284 flashcards in this deck.
Unlock Deck
k this deck
69
Which of the following would most likely cause a decrease in current consumer demand for normal good X?
A) a decline in the price of product X
B) an increase in consumer income
C) a decrease in the prices of goods which are close substitutes for X
D) an increase in the price which consumers expect will prevail for product X in the future
A) a decline in the price of product X
B) an increase in consumer income
C) a decrease in the prices of goods which are close substitutes for X
D) an increase in the price which consumers expect will prevail for product X in the future
Unlock Deck
Unlock for access to all 284 flashcards in this deck.
Unlock Deck
k this deck
70
A decrease in the price of gasoline will:
A) cause the demand curve for gas powered cars to become vertical.
B) shift the demand curve for gas powered cars to the right.
C) shift the demand curve for gas powered cars to the left.
D) not affect the demand for gas powered cars.
A) cause the demand curve for gas powered cars to become vertical.
B) shift the demand curve for gas powered cars to the right.
C) shift the demand curve for gas powered cars to the left.
D) not affect the demand for gas powered cars.
Unlock Deck
Unlock for access to all 284 flashcards in this deck.
Unlock Deck
k this deck
71
A and B are substitute goods,but A and C are complementary goods (in consumption).If the costs of production of A decrease,then the demand for:
A) both B and C will decrease.
B) both B and C will increase.
C) B will increase and the demand for C will decrease.
D) B will decrease and the demand for C will increase.
A) both B and C will decrease.
B) both B and C will increase.
C) B will increase and the demand for C will decrease.
D) B will decrease and the demand for C will increase.
Unlock Deck
Unlock for access to all 284 flashcards in this deck.
Unlock Deck
k this deck
72
If products C and D are close substitutes,an increase in the price of C will:
A) tend to cause the price of D to fall.
B) shift the demand curve of C to the left and the demand curve of D to the right.
C) shift the demand curve of D to the right.
D) shift the demand curves of both products to the right.
A) tend to cause the price of D to fall.
B) shift the demand curve of C to the left and the demand curve of D to the right.
C) shift the demand curve of D to the right.
D) shift the demand curves of both products to the right.
Unlock Deck
Unlock for access to all 284 flashcards in this deck.
Unlock Deck
k this deck
73
Other things equal,which of the following might shift the demand curve for gasoline to the left?
A) the discovery of vast new oil reserves in Alberta
B) the development of a low-cost electric automobile
C) an increase in the price of train and air transportation
D) a large decline in the price of automobiles
A) the discovery of vast new oil reserves in Alberta
B) the development of a low-cost electric automobile
C) an increase in the price of train and air transportation
D) a large decline in the price of automobiles
Unlock Deck
Unlock for access to all 284 flashcards in this deck.
Unlock Deck
k this deck
74
Refer to the above graph.X and Y are unrelated products.Which one of the lines in the graph best illustrates this relationship?
A) A
B) B
C) C
D) D
Unlock Deck
Unlock for access to all 284 flashcards in this deck.
Unlock Deck
k this deck
75
Which are not generally considered to be complementary goods?
A) gasoline and motor oil
B) beef and chicken
C) beer and pretzels
D) razors and razor blades
A) gasoline and motor oil
B) beef and chicken
C) beer and pretzels
D) razors and razor blades
Unlock Deck
Unlock for access to all 284 flashcards in this deck.
Unlock Deck
k this deck
76
Which of the following would not shift the demand curve for beef?
A) a widely publicized study which indicates beef increases one's cholesterol
B) a reduction in the price of cattle feed
C) an effective advertising campaign by pork producers
D) a change in the incomes of beef consumers
A) a widely publicized study which indicates beef increases one's cholesterol
B) a reduction in the price of cattle feed
C) an effective advertising campaign by pork producers
D) a change in the incomes of beef consumers
Unlock Deck
Unlock for access to all 284 flashcards in this deck.
Unlock Deck
k this deck
77
Refer to the above graph,which shows the market for chicken where D1 and D2 represent different demand curves.A change from E1 to E2 is most likely to result from:
A) an increase in expectations of higher future prices for chicken.
B) an increase in the cost of chicken feed to produce chickens.
C) a decrease in the price of beef products.
D) an increase in consumer incomes.
Unlock Deck
Unlock for access to all 284 flashcards in this deck.
Unlock Deck
k this deck
78
The demand curve for a product might shift as the result of a change in:
A) consumer tastes.
B) consumer incomes.
C) the prices of related goods.
D) all of the above.
A) consumer tastes.
B) consumer incomes.
C) the prices of related goods.
D) all of the above.
Unlock Deck
Unlock for access to all 284 flashcards in this deck.
Unlock Deck
k this deck
79
People demand more of product X when the price of product Y decreases.This means X and Y are:
A) complements.
B) substitutes.
C) not related.
D) both inexpensive.
A) complements.
B) substitutes.
C) not related.
D) both inexpensive.
Unlock Deck
Unlock for access to all 284 flashcards in this deck.
Unlock Deck
k this deck
80
If two goods are close substitutes:
A) consumers will always buy the one that has the highest price.
B) a fall in the price of one will decrease the demand for the other.
C) an increase in the price of one causes the demand for the other to decrease.
D) a decrease in the price of one causes an increase in the demand for the other.
A) consumers will always buy the one that has the highest price.
B) a fall in the price of one will decrease the demand for the other.
C) an increase in the price of one causes the demand for the other to decrease.
D) a decrease in the price of one causes an increase in the demand for the other.
Unlock Deck
Unlock for access to all 284 flashcards in this deck.
Unlock Deck
k this deck
Unlock Deck
Unlock for access to all 284 flashcards in this deck.


