Deck 3: Statistical Description of Data
Full screen (f)
Question
Question
Question
Question
Question
Question
Question
Question
Question
Question
Question
Question
Question
Question
Question
Question
Question
Question
Question
Question
Question
Question
Question
Question
Question
Question
Question
Question
Question
Question
Question
Question
Question
Question
Question
Question
Question
Question
Question
Question
Question
Question
If the coefficient of correlation  ,then the best-fit linear equation will include:
A) 75% of the data points.
B) 85% of the data points.
C) 95% of the data points.
D) all of the data points.
,then the best-fit linear equation will include:A) 75% of the data points.
B) 85% of the data points.
C) 95% of the data points.
D) all of the data points.
Question
Question
Question
Question
Question
Question
Question
Question
Question
Question
Question
Question
Question
Question
Question
Question
Question
Question
Question
Question
Question
NARRBEGIN: Pizza
In preparation for a pizza party,the students at State University surveyed the price of medium-sized pizzas for local restaurants: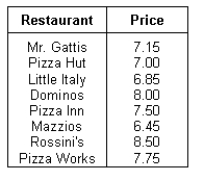
What is the mid-range?
In preparation for a pizza party,the students at State University surveyed the price of medium-sized pizzas for local restaurants:
What is the mid-range?
Question
Question
Question
NARRBEGIN: TV Markets
The top twenty TV markets in the United States are: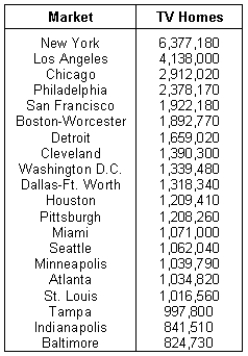
What is the median?
____________________
The top twenty TV markets in the United States are:
What is the median?
____________________
Question
Question
Question
Question
NARRBEGIN: TV Markets
The top twenty TV markets in the United States are:
What is the first quartile?
____________________
The top twenty TV markets in the United States are:
What is the first quartile?
____________________
Question
Question
Question
Question
Question
Question
Question
Question
Question
Question
NARRBEGIN: Pizza
In preparation for a pizza party,the students at State University surveyed the price of medium-sized pizzas for local restaurants:
What is the range of these prices?
In preparation for a pizza party,the students at State University surveyed the price of medium-sized pizzas for local restaurants:
What is the range of these prices?

Unlock Deck
Sign up to unlock the cards in this deck!
Unlock Deck
Unlock Deck
1/146
Play
Full screen (f)
Deck 3: Statistical Description of Data
1
Measures of dispersion describe typical values in the data.
False
2
A standardized value that is either a large positive number or a large negative number is a relatively usual occurrence.
False
3
Measures of central tendency and dispersion determined from frequency distributions are only approximations of the actual values.
True
4
The mode is defined as the value that has just as many values above it as it has below it.
Unlock Deck
Unlock for access to all 146 flashcards in this deck.
Unlock Deck
k this deck
5
The weights for a weighted mean calculation must sum up to 1.0.
Unlock Deck
Unlock for access to all 146 flashcards in this deck.
Unlock Deck
k this deck
6
The mean of a set of values describes the 50th percentile.
Unlock Deck
Unlock for access to all 146 flashcards in this deck.
Unlock Deck
k this deck
7
Which of the following is not a measure of central tendency?
A) Mean absolute deviation
B) Arithmetic mean
C) Weighted mean
D) Median
E) Mode
A) Mean absolute deviation
B) Arithmetic mean
C) Weighted mean
D) Median
E) Mode
Unlock Deck
Unlock for access to all 146 flashcards in this deck.
Unlock Deck
k this deck
8
Characteristics of the population are referred to as parameters,while characteristics of the sample are referred to as statistics.
Unlock Deck
Unlock for access to all 146 flashcards in this deck.
Unlock Deck
k this deck
9
Percentiles divide the values into 100 parts of equal size,each comprising 1% of the observations.
Unlock Deck
Unlock for access to all 146 flashcards in this deck.
Unlock Deck
k this deck
10
When a distribution has more values to the left and tails to the right,we say it is skewed negatively.
Unlock Deck
Unlock for access to all 146 flashcards in this deck.
Unlock Deck
k this deck
11
Which of the following is not a measure of dispersion?
A) Mean absolute deviation
B) Quantiles
C) Weighted mean
D) Range
E) Standard deviation.
A) Mean absolute deviation
B) Quantiles
C) Weighted mean
D) Range
E) Standard deviation.
Unlock Deck
Unlock for access to all 146 flashcards in this deck.
Unlock Deck
k this deck
12
The Empirical Rule states that approximately 68% of the observations in any distribution will fall within one standard deviation of the mean.
Unlock Deck
Unlock for access to all 146 flashcards in this deck.
Unlock Deck
k this deck
13
Standardized values have no units,even though the original data,the standard deviation,and the mean may each represent units such as dollars,hours,or pounds.
Unlock Deck
Unlock for access to all 146 flashcards in this deck.
Unlock Deck
k this deck
14
The box-and-whisker plot is a graphical device that simultaneously displays measures of central tendency and dispersion.
Unlock Deck
Unlock for access to all 146 flashcards in this deck.
Unlock Deck
k this deck
15
The range is a measure of dispersion that includes all the values in the data set in the calculation.
Unlock Deck
Unlock for access to all 146 flashcards in this deck.
Unlock Deck
k this deck
16
When a distribution has more values to the right and tails to the left,we say it is skewed positively.
Unlock Deck
Unlock for access to all 146 flashcards in this deck.
Unlock Deck
k this deck
17
The measure of central tendency that is least affected by extreme values is the:
A) the weighted mean.
B) the mean.
C) the variance.
D) the standard deviation.
E) the median.
A) the weighted mean.
B) the mean.
C) the variance.
D) the standard deviation.
E) the median.
Unlock Deck
Unlock for access to all 146 flashcards in this deck.
Unlock Deck
k this deck
18
The midrange is the average of the two middle data values.
Unlock Deck
Unlock for access to all 146 flashcards in this deck.
Unlock Deck
k this deck
19
The measure of central tendency that is most affected by extreme values is the:
A) range.
B) mean.
C) median.
D) mode.
E) coefficient of variation.
A) range.
B) mean.
C) median.
D) mode.
E) coefficient of variation.
Unlock Deck
Unlock for access to all 146 flashcards in this deck.
Unlock Deck
k this deck
20
Which of the following statements is true regarding the normal distribution?
A) The mean is greater than the median and the median is greater than the mode.
B) The mean is less than the median and the median is less than the mode.
C) There is no difference in the values of the mean,median,and mode.
D) The mean is greater than the mode,which in turn is greater than the median.
E) The mean is less than the mode,which in turn is less than the median.
Unlock Deck
Unlock for access to all 146 flashcards in this deck.
Unlock Deck
k this deck
21
A study was conducted of the 12-month earnings per share for two categories of airline companies. Based on the above data,which of the following statements is correct?
A) The large airlines have a coefficient of variation of 2.44 while the small airlines have a coefficient of variation of 3.64.
B) Because the large airlines have mean earnings per share of 3.40 and the small airlines have mean earnings per share of 1.11,the large airlines have the largest coefficient of variation.
C) Because the large airlines have mean earnings per share of 3.54 and the small airlines have mean earnings per share of 1.71,the large airlines have the largest coefficient of variation.
D) The large airlines have a coefficient of variation of 0.85 and the small airlines have a coefficient of variation of 2.72.
E) The large airlines have a coefficient of variation of 0.81 and the small airlines have a coefficient of variation of 1.17.
Unlock Deck
Unlock for access to all 146 flashcards in this deck.
Unlock Deck
k this deck
22
Which of the following is not a measure of variability?
A) The range
B) The variance
C) The standard deviation
D) The median
E) The interquartile range
A) The range
B) The variance
C) The standard deviation
D) The median
E) The interquartile range
Unlock Deck
Unlock for access to all 146 flashcards in this deck.
Unlock Deck
k this deck
23
The difference between the largest and smallest values in a data set is called the:
A) standard deviation.
B) variance.
C) coefficient of variation.
D) range.
E) mean.
A) standard deviation.
B) variance.
C) coefficient of variation.
D) range.
E) mean.
Unlock Deck
Unlock for access to all 146 flashcards in this deck.
Unlock Deck
k this deck
24
Which of the following is not a correct statement?
A) The coefficient of variation allows us to compare two sets of data based on different measurement units.
B) Chebyshev's theorem applies only to normal distributions.
C) Standardized values have no units of measure.
D) For distributions that are bell-shaped and symmetric,about 68% of the observations will fall within one standard deviation of the mean.
E) The vertical line within the box in the box-and-whisker plot represents the median.
Unlock Deck
Unlock for access to all 146 flashcards in this deck.
Unlock Deck
k this deck
25
The average score for a class of 25 students was 75.If the 15 female students in the class averaged 70,then the male students in the class averaged:
A) 85.0
B) 82.5
C) 77.5
D) 75.0
E) 70.0
A) 85.0
B) 82.5
C) 77.5
D) 75.0
E) 70.0
Unlock Deck
Unlock for access to all 146 flashcards in this deck.
Unlock Deck
k this deck
26
Which of the measures of central tendency would best represent the data below?
A) Range
B) Mean
C) Median
D) Mode
E) Standard deviation
A) Range
B) Mean
C) Median
D) Mode
E) Standard deviation
Unlock Deck
Unlock for access to all 146 flashcards in this deck.
Unlock Deck
k this deck
27
Which of the following statements is correct?
A) The range is found by taking the difference between the high and low values and dividing by 2.
B) The interquartile range is found by taking the difference between the 1st and 3rd quartiles and dividing that value by 2.
C) The standard deviation is expressed in terms of the original units of measurement but the variance is not.
D) The values of the standard deviation may be either positive or negative,while the value of the variance will always be positive.
E) None of these statements is true.
Unlock Deck
Unlock for access to all 146 flashcards in this deck.
Unlock Deck
k this deck
28
In a negatively skewed distribution,the:
A) mean is greater than the median and the median is greater than the mode.
B) mean is greater than the median and the median is smaller than the mode.
C) mean is smaller than the median and the median is greater than the mode.
D) mean is smaller than the median and the median is smaller than the mode.
E) mean is equal to the median and the median is equal to the mode.
Unlock Deck
Unlock for access to all 146 flashcards in this deck.
Unlock Deck
k this deck
29
Which of the following statements is correct?
A) The mean is a measure of the deviation in a data set.
B) The standard deviation is a measure of dispersion.
C) The range is a measure of central tendency.
D) The median is a measure of dispersion.
E) The variance is a measure of central tendency.
A) The mean is a measure of the deviation in a data set.
B) The standard deviation is a measure of dispersion.
C) The range is a measure of central tendency.
D) The median is a measure of dispersion.
E) The variance is a measure of central tendency.
Unlock Deck
Unlock for access to all 146 flashcards in this deck.
Unlock Deck
k this deck
30
Expressed in percentiles,the interquartile range is the difference between the:
A) 15th and 65th percentiles
B) 20th and 70th percentiles
C) 25th and 75th percentiles
D) 30th and 80th percentiles
E) 35th and 85th percentiles
A) 15th and 65th percentiles
B) 20th and 70th percentiles
C) 25th and 75th percentiles
D) 30th and 80th percentiles
E) 35th and 85th percentiles
Unlock Deck
Unlock for access to all 146 flashcards in this deck.
Unlock Deck
k this deck
31
Chebyshev's Theorem states that the percentage of observations in a data set that should fall within five standard deviations of their mean is:
A) 90%.
B) at least 90%.
C) 96%.
D) at least 96%.
E) 25%.
A) 90%.
B) at least 90%.
C) 96%.
D) at least 96%.
E) 25%.
Unlock Deck
Unlock for access to all 146 flashcards in this deck.
Unlock Deck
k this deck
32
Which of the following is the simplest measure of dispersion?
A) Range
B) Mean absolute deviation
C) Standard deviation
D) Coefficient of variation
E) Variance
A) Range
B) Mean absolute deviation
C) Standard deviation
D) Coefficient of variation
E) Variance
Unlock Deck
Unlock for access to all 146 flashcards in this deck.
Unlock Deck
k this deck
33
Deciles:
A) are an array of values in 10 parts of equal size.
B) indicate the median with the fifth decile.
C) divide the values into four parts of equal size.
D) indicate the median with the second decile.
E) both A and B are correct.
A) are an array of values in 10 parts of equal size.
B) indicate the median with the fifth decile.
C) divide the values into four parts of equal size.
D) indicate the median with the second decile.
E) both A and B are correct.
Unlock Deck
Unlock for access to all 146 flashcards in this deck.
Unlock Deck
k this deck
34
Which of the following statements are true for the following data values: 9,7,8,6,9,10,and 14?
A) The mean,median and mode are all equal
B) Only the mean and median are equal
C) Only the mean and mode are equal
D) Only the median and mode are equal
A) The mean,median and mode are all equal
B) Only the mean and median are equal
C) Only the mean and mode are equal
D) Only the median and mode are equal
Unlock Deck
Unlock for access to all 146 flashcards in this deck.
Unlock Deck
k this deck
35
When a distribution is bell-shaped with the left half identical to the right half,it is:
A) skewed positively
B) symmetrical
C) equilateral
D) skewed negatively
E) not applicable for Chebyshev's theorem
A) skewed positively
B) symmetrical
C) equilateral
D) skewed negatively
E) not applicable for Chebyshev's theorem
Unlock Deck
Unlock for access to all 146 flashcards in this deck.
Unlock Deck
k this deck
36
In a positively skewed distribution,the:
A) mean is greater than the median and the median is greater than the mode.
B) mean is greater than the median and the median is smaller than the mode.
C) mean is smaller than the median and the median is greater than the mode.
D) mean is smaller than the median and the median is smaller than the mode.
E) mean is equal to the median and the median is equal to the mode.
Unlock Deck
Unlock for access to all 146 flashcards in this deck.
Unlock Deck
k this deck
37
The Empirical Rule states that the percentage of observations in a data set (providing that the data set has a bell-shaped and symmetric distribution)that fall within one standard deviation of their mean is approximately:
A) 68%
B) 75%
C) 95%
D) 99%
A) 68%
B) 75%
C) 95%
D) 99%
Unlock Deck
Unlock for access to all 146 flashcards in this deck.
Unlock Deck
k this deck
38
Which of the following statements is correct?
A) The mode gives equal consideration to even very extreme values in the data.
B) There will be just one value for the mean,median ,and mode in the data set.
C) The median can be strongly influenced by just one or two very low or high values.
D) The mean is able to make the most complete use of the data when compared to the median and mode.
E) None of the above are correct.
Unlock Deck
Unlock for access to all 146 flashcards in this deck.
Unlock Deck
k this deck
39
The value in the data set that occurs with the greatest frequency is known as the:
A) mode.
B) median.
C) mean.
D) weighted mean.
E) variance.
A) mode.
B) median.
C) mean.
D) weighted mean.
E) variance.
Unlock Deck
Unlock for access to all 146 flashcards in this deck.
Unlock Deck
k this deck
40
A sample of 15 observations has a standard deviation of 4.The sum of the squared deviations from the sample mean is:
A) 19
B) 56
C) 60
D) 224
E) 240
A) 19
B) 56
C) 60
D) 224
E) 240
Unlock Deck
Unlock for access to all 146 flashcards in this deck.
Unlock Deck
k this deck
41
Sample values of 13 monthly sales figures (in thousands of dollars)are: 6,5,6,6,7,8,9,10,10,10,9,9,and 6.
What is the mean sales figure?
____________________ thousand
What is the mean sales figure?
____________________ thousand
Unlock Deck
Unlock for access to all 146 flashcards in this deck.
Unlock Deck
k this deck
42
If the coefficient of correlation ,then the best-fit linear equation will include:
A) 75% of the data points.
B) 85% of the data points.
C) 95% of the data points.
D) all of the data points.
,then the best-fit linear equation will include:A) 75% of the data points.
B) 85% of the data points.
C) 95% of the data points.
D) all of the data points.
Unlock Deck
Unlock for access to all 146 flashcards in this deck.
Unlock Deck
k this deck
43
The average profit per unit for Product A is $5.32,Product B is $7.98,and Product C is $9.69.If the percentages of each sold are 36,29,and 35 respectively,what is the weighted mean profit per unit?
Unlock Deck
Unlock for access to all 146 flashcards in this deck.
Unlock Deck
k this deck
44
For a set of data,the mean is 50 and the standard deviation is 10.In the raw data,one of the observations is equal to 74.After the data are standardized,what will be the standardized value of this observation?
A) +7.4
B) -7.4
C) +2.4
D) -2.4
A) +7.4
B) -7.4
C) +2.4
D) -2.4
Unlock Deck
Unlock for access to all 146 flashcards in this deck.
Unlock Deck
k this deck
45
The length of the box in the box-and-whisker plot portrays the:
A) mean
B) median
C) range
D) interquartile range
A) mean
B) median
C) range
D) interquartile range
Unlock Deck
Unlock for access to all 146 flashcards in this deck.
Unlock Deck
k this deck
46
If the coefficient of correlation r = 0,then:
A) the slope of the regression line is zero.
B) there is no linear relationship whatsoever between the dependent variable y and the independent variable x.
C) the coefficient of determination is zero.
D) All of these are correct.
E) None of these is correct.
A) the slope of the regression line is zero.
B) there is no linear relationship whatsoever between the dependent variable y and the independent variable x.
C) the coefficient of determination is zero.
D) All of these are correct.
E) None of these is correct.
Unlock Deck
Unlock for access to all 146 flashcards in this deck.
Unlock Deck
k this deck
47
The numerical value of the coefficient of determination r 2
A) is the proportion of the variation in the dependent variable y that is explained by the best-fit linear equation.
B) is the proportion of the variation in the independent variable x that is explained by the best-fit linear equation.
C) indicates the direction of the relationship between the dependent variable y and the independent variable x.
D) Both A and B are correct.
E) A,B,and C are all correct.
Unlock Deck
Unlock for access to all 146 flashcards in this deck.
Unlock Deck
k this deck
48
Which of the following statements is not correct?
A) Measures of central tendency determined from frequency distributions will only be approximations of the actual values.
B) Measures of dispersion determined from frequency distributions will only be approximations of the actual values.
C) In grouped data,each observation is given the value of its classification's mid-point.
D) When data are grouped,the value of each individual observation is lost.
E) All of the above statements are correct.
Unlock Deck
Unlock for access to all 146 flashcards in this deck.
Unlock Deck
k this deck
49
When the standard deviation is expressed as a percentage of the mean,the result is the:
A) coefficient of correlation.
B) coefficient of determination.
C) coefficient of variation.
D) coefficient of dispersion.
A) coefficient of correlation.
B) coefficient of determination.
C) coefficient of variation.
D) coefficient of dispersion.
Unlock Deck
Unlock for access to all 146 flashcards in this deck.
Unlock Deck
k this deck
50
You are interested in beginning a small business enterprise and one aspect of your research is to look at the loan record for stockholders of small business corporations.A14-year record of net loans from stockholders of small business corporations (in billions of dollars)are as follows: 1.6,-0.2,1.0,1.4,-0.1,0.6,1.5,0.9,2.2,1.3,1.9,1.9,2.8,and 5.0.
Calculate the mode.
____________________ billion
Calculate the mode.
____________________ billion
Unlock Deck
Unlock for access to all 146 flashcards in this deck.
Unlock Deck
k this deck
51
For each of the past 10 years,the U.S.unemployment rate has been recorded as follows: 6.7,5.5,5.7,5.2,4.5,3.8,3.8,3.6,3.5,and 4.9.Find the mean unemployment rate for this period.
Unlock Deck
Unlock for access to all 146 flashcards in this deck.
Unlock Deck
k this deck
52
You are interested in beginning a small business enterprise and one aspect of your research is to look at the loan record for stockholders of small business corporations.A14-year record of net loans from stockholders of small business corporations (in billions of dollars)are as follows: 1.6,-0.2,1.0,1.4,-0.1,0.6,1.5,0.9,2.2,1.3,1.9,1.9,2.8,and 5.0.
Calculate the median.
____________________ billion
Calculate the median.
____________________ billion
Unlock Deck
Unlock for access to all 146 flashcards in this deck.
Unlock Deck
k this deck
53
A student scores 89,72,93,and 84 on four exams during the semester and 96 on the final exam.If the final is weighted double and the four others weighted equally,what would the student's final average be?
Unlock Deck
Unlock for access to all 146 flashcards in this deck.
Unlock Deck
k this deck
54
The coefficient of correlation r is a number that indicates the:
A) direction of the relationship between the dependent variable y and the independent variable x.
B) strength of the relationship between the dependent variable y and the independent variable x.
C) proportion of the variation in the dependent variable y that is explained by the independent variable x.
D) Only A and B are correct.
E) A,B,and C are all correct.
Unlock Deck
Unlock for access to all 146 flashcards in this deck.
Unlock Deck
k this deck
55
A perfect straight line sloping upward would produce a correlation coefficient equal to:
A) +1.
B) -1.
C) +2.
D) -2.
A) +1.
B) -1.
C) +2.
D) -2.
Unlock Deck
Unlock for access to all 146 flashcards in this deck.
Unlock Deck
k this deck
56
You are interested in beginning a small business enterprise and one aspect of your research is to look at the loan record for stockholders of small business corporations.A14-year record of net loans from stockholders of small business corporations (in billions of dollars)are as follows: 1.6,-0.2,1.0,1.4,-0.1,0.6,1.5,0.9,2.2,1.3,1.9,1.9,2.8,and 5.0.
Calculate the mean.
____________________ billion
Calculate the mean.
____________________ billion
Unlock Deck
Unlock for access to all 146 flashcards in this deck.
Unlock Deck
k this deck
57
A sample of 10 U.S.families spent the following amounts (in dollars)on groceries during a one-week period: 31.36,68.76,12.25,10.85,24.89,31.48,49.52,48.24,30.04,and 25.63.Find the median amount spent on groceries.
Unlock Deck
Unlock for access to all 146 flashcards in this deck.
Unlock Deck
k this deck
58
A sample of interest rates on unpaid credit card balances yields the following data: 13.25,13.67,13.60,13.29,12.97,12.90,12.76,12.66,12.58,12.77,and 12.91.Find the median interest rate.
Unlock Deck
Unlock for access to all 146 flashcards in this deck.
Unlock Deck
k this deck
59
Heidi has been keeping track of what she spends to eat out.The last week's expenditures (in dollars)for meals eaten out were 3.69,3.95,4.19,8.91,5.49,12.53,and 5.66.Calculate the mean amount she spent on meals last week.
Unlock Deck
Unlock for access to all 146 flashcards in this deck.
Unlock Deck
k this deck
60
The difference between the mean of a data set and the individual values of that set is known as the:
A) variance
B) standard deviation
C) residual
D) mean absolute deviation
E) quartile
A) variance
B) standard deviation
C) residual
D) mean absolute deviation
E) quartile
Unlock Deck
Unlock for access to all 146 flashcards in this deck.
Unlock Deck
k this deck
61
NARRBEGIN: Sample data
Consider the following sample data: 6,10,4,3,7,9,21,and 14.
Consider the following sample data: 6,10,4,3,7,9,21,and 14.What is the range of this data sample?
Consider the following sample data: 6,10,4,3,7,9,21,and 14.
Consider the following sample data: 6,10,4,3,7,9,21,and 14.What is the range of this data sample?
Unlock Deck
Unlock for access to all 146 flashcards in this deck.
Unlock Deck
k this deck
62
In a test of a lifelong brand of tires,a survey revealed that the mean life was 35,000 miles and the standard deviation was 7,083 miles.If the shape of the population distribution is not known,approximately what percentage of the tires last less than 20,834 miles?
Unlock Deck
Unlock for access to all 146 flashcards in this deck.
Unlock Deck
k this deck
63
NARRBEGIN: Pizza
In preparation for a pizza party,the students at State University surveyed the price of medium-sized pizzas for local restaurants:
What is the mid-range?
In preparation for a pizza party,the students at State University surveyed the price of medium-sized pizzas for local restaurants:
What is the mid-range?
Unlock Deck
Unlock for access to all 146 flashcards in this deck.
Unlock Deck
k this deck
64
What is the coefficient of variation of the following sample data set: 12,9,5,23,11,8,16,and 6?
Unlock Deck
Unlock for access to all 146 flashcards in this deck.
Unlock Deck
k this deck
65
Sample values of 13 monthly sales figures (in thousands of dollars)are: 6,5,6,6,7,8,9,10,10,10,9,9,and 6.
What is the median sales figure?
____________________ thousand
What is the median sales figure?
____________________ thousand
Unlock Deck
Unlock for access to all 146 flashcards in this deck.
Unlock Deck
k this deck
66
NARRBEGIN: TV Markets
The top twenty TV markets in the United States are:
What is the median?
____________________
The top twenty TV markets in the United States are:
What is the median?
____________________
Unlock Deck
Unlock for access to all 146 flashcards in this deck.
Unlock Deck
k this deck
67
NARRBEGIN: Sample data
Consider the following sample data: 6,10,4,3,7,9,21,and 14.
Consider the following sample data: 6,10,4,3,7,9,21,and 14.What is the mean absolute deviation?
Consider the following sample data: 6,10,4,3,7,9,21,and 14.
Consider the following sample data: 6,10,4,3,7,9,21,and 14.What is the mean absolute deviation?
Unlock Deck
Unlock for access to all 146 flashcards in this deck.
Unlock Deck
k this deck
68
NARRBEGIN: Sample data
Consider the following sample data: 6,10,4,3,7,9,21,and 14.
Consider the following sample data: 6,10,4,3,7,9,21,and 14.What is the variance?
Consider the following sample data: 6,10,4,3,7,9,21,and 14.
Consider the following sample data: 6,10,4,3,7,9,21,and 14.What is the variance?
Unlock Deck
Unlock for access to all 146 flashcards in this deck.
Unlock Deck
k this deck
69
Sample values of 13 monthly sales figures (in thousands of dollars)are: 6,5,6,6,7,8,9,10,10,10,9,9,and 6.
What is the mode?
____________________ thousand
What is the mode?
____________________ thousand
Unlock Deck
Unlock for access to all 146 flashcards in this deck.
Unlock Deck
k this deck
70
NARRBEGIN: TV Markets
The top twenty TV markets in the United States are:
What is the first quartile?
____________________
The top twenty TV markets in the United States are:
What is the first quartile?
____________________
Unlock Deck
Unlock for access to all 146 flashcards in this deck.
Unlock Deck
k this deck
71
Consider the following sample data: 4,14,6,9,21,3,7,and 10.
Calculate the mean.
Calculate the mean.
Unlock Deck
Unlock for access to all 146 flashcards in this deck.
Unlock Deck
k this deck
72
A sample of 13 monthly sales figures (in thousands of dollars)are: 10,6,5,10,9,7,10,9,6,8,9,6,and 6.
Calculate the mean absolute deviation.
Calculate the mean absolute deviation.
Unlock Deck
Unlock for access to all 146 flashcards in this deck.
Unlock Deck
k this deck
73
Consider the following sample data: 4,14,6,9,21,3,7,and 10.
Calculate the median.
Calculate the median.
Unlock Deck
Unlock for access to all 146 flashcards in this deck.
Unlock Deck
k this deck
74
A sample of 13 monthly sales figures (in thousands of dollars)are: 10,6,5,10,9,7,10,9,6,8,9,6,and 6.
Calculate the sample standard deviation.
Calculate the sample standard deviation.
Unlock Deck
Unlock for access to all 146 flashcards in this deck.
Unlock Deck
k this deck
75
Find the midrange for the following data: 14,99,53,67,16,55,and 11.
Unlock Deck
Unlock for access to all 146 flashcards in this deck.
Unlock Deck
k this deck
76
NARRBEGIN: Sample data
Consider the following sample data: 6,10,4,3,7,9,21,and 14.
Consider the following sample data: 6,10,4,3,7,9,21,and 14.What is the standard deviation?
Consider the following sample data: 6,10,4,3,7,9,21,and 14.
Consider the following sample data: 6,10,4,3,7,9,21,and 14.What is the standard deviation?
Unlock Deck
Unlock for access to all 146 flashcards in this deck.
Unlock Deck
k this deck
77
A sample of 13 monthly sales figures (in thousands of dollars)are: 10,6,5,10,9,7,10,9,6,8,9,6,and 6.
What is the sample variance?
What is the sample variance?
Unlock Deck
Unlock for access to all 146 flashcards in this deck.
Unlock Deck
k this deck
78
A sample of 13 monthly sales figures (in thousands of dollars)are: 10,6,5,10,9,7,10,9,6,8,9,6,and 6.
What is the coefficient of variation?
What is the coefficient of variation?
Unlock Deck
Unlock for access to all 146 flashcards in this deck.
Unlock Deck
k this deck
79
Find the range for the following data: 9,94,48,62,11,50,and 6.
Unlock Deck
Unlock for access to all 146 flashcards in this deck.
Unlock Deck
k this deck
80
NARRBEGIN: Pizza
In preparation for a pizza party,the students at State University surveyed the price of medium-sized pizzas for local restaurants:
What is the range of these prices?
In preparation for a pizza party,the students at State University surveyed the price of medium-sized pizzas for local restaurants:
What is the range of these prices?
Unlock Deck
Unlock for access to all 146 flashcards in this deck.
Unlock Deck
k this deck
Unlock Deck
Unlock for access to all 146 flashcards in this deck.


