Deck 2: Portfolio Analysis
Full screen (f)
Question
Question
Question
Question
Question
Question
Question
Question
Question
Question
Question
Question
Question
Question
Question
The annual returns of Wonder Widgets,Inc.and the S&P 500 Composite Index over the last ten years were as follows:
Find the following for Wonder Widgets:
a. Beta ( W, slope of regression line)
b. Alpha ( W, intercept of regression line)
c. Unsystematic variance ( 2W - 2W 2m)
d. Correlation coefficient ( )
)
Find the following for Wonder Widgets:
a. Beta ( W, slope of regression line)
b. Alpha ( W, intercept of regression line)
c. Unsystematic variance ( 2W - 2W 2m)
d. Correlation coefficient (
) Question
Question
Question
Question
Question
The following diagram shows the investment opportunity set for portfolios containing stocks A and B.You need to know that:
•Point A on the graph represents a portfolio with 100% in stock A
•Point B represents a portfolio with 100% in stock B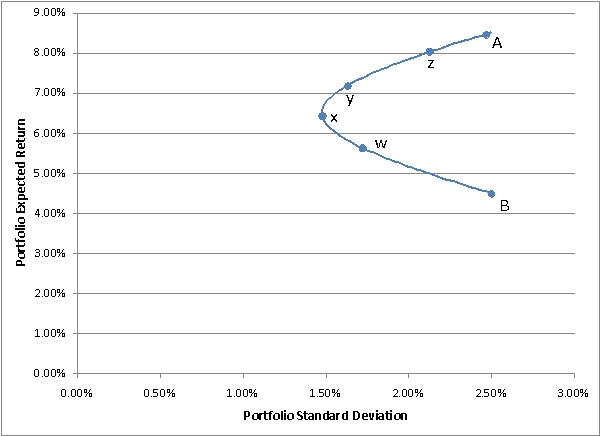 a.Is the correlation between A and B greater than,equal to,or less than 1.How do you know?
b.Which labeled point on the graph represents the minimum variance portfolio?
c.Which labeled point on the graph represents a portfolio with 88% invested in stock A and the rest in B?
d.If A and B are the only investments available to an investor,which of the labeled portfolios are efficient?
e.Suppose a risk-free asset exists,allowing an investor to invest or borrow at the risk-free rate of 3%.If the above graph is drawn perfectly to scale,which labeled point represents the optimal risky portfolio.
f.Under the assumptions in part (e),would it be wise for an investor to invest all of his or her money in stock A? Why or why not?
•Point A on the graph represents a portfolio with 100% in stock A
•Point B represents a portfolio with 100% in stock B
a.Is the correlation between A and B greater than,equal to,or less than 1.How do you know?b.Which labeled point on the graph represents the minimum variance portfolio?
c.Which labeled point on the graph represents a portfolio with 88% invested in stock A and the rest in B?
d.If A and B are the only investments available to an investor,which of the labeled portfolios are efficient?
e.Suppose a risk-free asset exists,allowing an investor to invest or borrow at the risk-free rate of 3%.If the above graph is drawn perfectly to scale,which labeled point represents the optimal risky portfolio.
f.Under the assumptions in part (e),would it be wise for an investor to invest all of his or her money in stock A? Why or why not?
Question
Question
Question
Question
Question
Question
Question
Question
Question
Question
Question
Question
Question
Question
Question
Question

Unlock Deck
Sign up to unlock the cards in this deck!
Unlock Deck
Unlock Deck
1/36
Play
Full screen (f)
Deck 2: Portfolio Analysis
1
Two companies Amber and Bolt are manufacturers of glass.The securities of the companies are listed and traded in the New York Stock Exchange.An investor's portfolio consists of these two securities in the proportion of 5/6 and 1/6 respectively.Amber's security has an expected return of 20% and a standard deviation of 8%.Bolt has an expected return of 15% and a standard deviation of 5%.The correlation coefficient between the two securities is 0.6.Calculate the expected return and the standard deviation of the investor's portfolio.
A)
B)
C)
D)
A)
B)
C)
D)
2
If the returns on different assets are uncorrelated:
A) an increase in the number of assets in a portfolio may bring the standard deviation of the portfolio close to zero.
B) there will be little gain from diversification.
C) diversification will result in risk averaging but not in risk reduction.
D) the expected return on a portfolio of such assets should be zero.
A
3
Using the Sharpe single-index model with a random portfolio of U.S.common stocks,as one increases the number of stocks in the portfolio,the total risk of the portfolio will:
A) approach zero.
B) approach the portfolio's systematic risk.
C) approach the portfolio's non-systematic risk.
D) not be affected.
A) approach zero.
B) approach the portfolio's systematic risk.
C) approach the portfolio's non-systematic risk.
D) not be affected.
B
4
Consider the probability distribution below.(Note that the expected returns of A and B have already been computed for you.)
a.Calculate the standard deviations of A and B.
b.Calculate the covariance and correlation between A and B.
c.Calculate the expected return of the portfolio that invests 30% in stock A and the rest in stock B.
d.Calculate the standard deviation of the portfolio in part b.
a.Calculate the standard deviations of A and B.
b.Calculate the covariance and correlation between A and B.
c.Calculate the expected return of the portfolio that invests 30% in stock A and the rest in stock B.
d.Calculate the standard deviation of the portfolio in part b.
Unlock Deck
Unlock for access to all 36 flashcards in this deck.
Unlock Deck
k this deck
5
Discuss whether the following statement is true or false:
One can always construct a multi-index model that explains more of the returns on a security than a single-index model does.
One can always construct a multi-index model that explains more of the returns on a security than a single-index model does.
Unlock Deck
Unlock for access to all 36 flashcards in this deck.
Unlock Deck
k this deck
6
With the help of a diagram show,how would you identify a ray with the greatest slope as an efficient frontier where riskless lending and borrowing is present?
Unlock Deck
Unlock for access to all 36 flashcards in this deck.
Unlock Deck
k this deck
7
Which of the following is correct of how the returns on assets move together?
A) Positive and negative deviations between assets at similar times give a negative covariance.
B) Positive and negative deviations between assets at dissimilar times give a negative covariance.
C) Positive and negative deviations between assets give a zero covariance.
D) Positive and negative deviations between assets at dissimilar times give a positive covariance.
Unlock Deck
Unlock for access to all 36 flashcards in this deck.
Unlock Deck
k this deck
8
Discuss whether the following statement is true or false:
A multi-index model will predict returns better than a single-index model.
A multi-index model will predict returns better than a single-index model.
Unlock Deck
Unlock for access to all 36 flashcards in this deck.
Unlock Deck
k this deck
9
Describe what is semivariance? Give reasons why semivariance is not used as a measure of dispersion.
Unlock Deck
Unlock for access to all 36 flashcards in this deck.
Unlock Deck
k this deck
10
Under what condition will adding a security with a high standard deviation decrease the risk of a portfolio?
Unlock Deck
Unlock for access to all 36 flashcards in this deck.
Unlock Deck
k this deck
11
Which of the following is true of a cutoff rate?
A) The cutoff rate is be determined by dividing the Beta with the difference between average return and return on the riskfree rate of the securities.
B) All securities whose return is above the cutoff rate are selected in the market portfolio.
C) The cutoff rate is computed from the characteristics of all securities in the optimum portfolio.
D) All securities whose risk is below the cutoff rate are selected in the optimum portfolio.
Unlock Deck
Unlock for access to all 36 flashcards in this deck.
Unlock Deck
k this deck
12
Consider the following historical data for the returns on assets A and B and the market portfolio:
a. What is the covariance between asset A and asset B?
b. If the beta of asset B is 0.5, what is the systematic return and non-systematic return for asset B in each period?
a. What is the covariance between asset A and asset B?
b. If the beta of asset B is 0.5, what is the systematic return and non-systematic return for asset B in each period?
Unlock Deck
Unlock for access to all 36 flashcards in this deck.
Unlock Deck
k this deck
13
Consider the following data for assets A and B: ; ; ; ; ; ; .
a. Calculate the expected return, variance, and beta of a portfolio constructed by investing 1/3 of your funds in asset A and 2/3 in asset B.
b. If only the riskless asset and assets A and B are available, find the optimum risky-asset portfolio if the risk-free rate is 8%.
a. Calculate the expected return, variance, and beta of a portfolio constructed by investing 1/3 of your funds in asset A and 2/3 in asset B.
b. If only the riskless asset and assets A and B are available, find the optimum risky-asset portfolio if the risk-free rate is 8%.
Unlock Deck
Unlock for access to all 36 flashcards in this deck.
Unlock Deck
k this deck
14
The risk on a portfolio of assets:
A) is different from the risk on the market portfolio.
B) is not influenced by the risk of individual assets.
C) is different from the risk of individual assets.
D) is negatively correlated to the risk of individual assets.
A) is different from the risk on the market portfolio.
B) is not influenced by the risk of individual assets.
C) is different from the risk of individual assets.
D) is negatively correlated to the risk of individual assets.
Unlock Deck
Unlock for access to all 36 flashcards in this deck.
Unlock Deck
k this deck
15
The annual returns of Wonder Widgets,Inc.and the S&P 500 Composite Index over the last ten years were as follows:
Find the following for Wonder Widgets:
a. Beta ( W, slope of regression line)
b. Alpha ( W, intercept of regression line)
c. Unsystematic variance ( 2W - 2W 2m)
d. Correlation coefficient ( )
Find the following for Wonder Widgets:
a. Beta ( W, slope of regression line)
b. Alpha ( W, intercept of regression line)
c. Unsystematic variance ( 2W - 2W 2m)
d. Correlation coefficient (
) Unlock Deck
Unlock for access to all 36 flashcards in this deck.
Unlock Deck
k this deck
16
Stock A has an expected return of 8% and a standard deviation of 40%.Stock B has an expected return of 13% and standard deviation of 60%.The correlation between A and B is -1 (i.e.,they are perfectly negatively correlated).Show that you can form a zero risk portfolio by investing in A and the rest in B.
Unlock Deck
Unlock for access to all 36 flashcards in this deck.
Unlock Deck
k this deck
17
Consider the following data for assets A,B,and C ; ; ; ; ; ; ; ; .
Assume the variance of the market portfolio is 20 and that a riskless asset exists.Set up the first-order conditions for the optimum risky-asset portfolio.
Assume the variance of the market portfolio is 20 and that a riskless asset exists.Set up the first-order conditions for the optimum risky-asset portfolio.
Unlock Deck
Unlock for access to all 36 flashcards in this deck.
Unlock Deck
k this deck
18
What is the concept behind the indexes used in the Fama and French Model?
A) Form portfolios with standard deviations that mimic the impact of the variables.
B) Form portfolios with returns that are opposite to the impact of the variables.
C) Form portfolios with returns that mimic the impact of the variables.
D) Form portfolios with standard deviations that are opposite to the impact of the variables.
Unlock Deck
Unlock for access to all 36 flashcards in this deck.
Unlock Deck
k this deck
19
An efficient frontier is:
A) a combination of securities that have the highest expected return for each level of risk.
B) the combination of two securities or portfolios represented as a convex function.
C) a combination of securities that lie below the minimum variance portfolio and the maximum return portfolio.
D) a combination of securities that have an average expected return for each level of risk.
Unlock Deck
Unlock for access to all 36 flashcards in this deck.
Unlock Deck
k this deck
20
The following diagram shows the investment opportunity set for portfolios containing stocks A and B.You need to know that:
•Point A on the graph represents a portfolio with 100% in stock A
•Point B represents a portfolio with 100% in stock B a.Is the correlation between A and B greater than,equal to,or less than 1.How do you know?
b.Which labeled point on the graph represents the minimum variance portfolio?
c.Which labeled point on the graph represents a portfolio with 88% invested in stock A and the rest in B?
d.If A and B are the only investments available to an investor,which of the labeled portfolios are efficient?
e.Suppose a risk-free asset exists,allowing an investor to invest or borrow at the risk-free rate of 3%.If the above graph is drawn perfectly to scale,which labeled point represents the optimal risky portfolio.
f.Under the assumptions in part (e),would it be wise for an investor to invest all of his or her money in stock A? Why or why not?
•Point A on the graph represents a portfolio with 100% in stock A
•Point B represents a portfolio with 100% in stock B
a.Is the correlation between A and B greater than,equal to,or less than 1.How do you know?b.Which labeled point on the graph represents the minimum variance portfolio?
c.Which labeled point on the graph represents a portfolio with 88% invested in stock A and the rest in B?
d.If A and B are the only investments available to an investor,which of the labeled portfolios are efficient?
e.Suppose a risk-free asset exists,allowing an investor to invest or borrow at the risk-free rate of 3%.If the above graph is drawn perfectly to scale,which labeled point represents the optimal risky portfolio.
f.Under the assumptions in part (e),would it be wise for an investor to invest all of his or her money in stock A? Why or why not?
Unlock Deck
Unlock for access to all 36 flashcards in this deck.
Unlock Deck
k this deck
21
Discuss how betas are obtained and some of the innovations that have been used to predict their values.
Unlock Deck
Unlock for access to all 36 flashcards in this deck.
Unlock Deck
k this deck
22
Discuss the economic properties of utility functions.
Unlock Deck
Unlock for access to all 36 flashcards in this deck.
Unlock Deck
k this deck
23
Explain how the equity premium work in estimating expected returns.
Unlock Deck
Unlock for access to all 36 flashcards in this deck.
Unlock Deck
k this deck
24
What is a stock's own variance and what is the covariance between two stocks if one accepts the Sharpe single-index model? Explain why each is what it is.
Unlock Deck
Unlock for access to all 36 flashcards in this deck.
Unlock Deck
k this deck
25
A security analyst works for a large institution that uses the single-index model as part of its portfolio-management scheme.The security analyst believes the following values are relevant for the four stocks she follows ; ; ; ; ; ; ; ; ; ; ; .
The institution assumes that the risk-free rate is 6%,and short selling is not allowed.The institution accepts the Sharpe single-index model and uses the procedure described by Elton,Gruber and Padberg (EGP)to determine the optimum risky-asset portfolio for the institution to hold.The procedure is to compute where the ranking criterion is as described by EGP and where C* depends on all risky assets the institution holds.The institution's management has determined that C* = 3.
a. Which stocks that the analyst follows will be held in the institution's optimum portfolio?
b. If the sum of the Zi's for all the institution's stocks in the optimum portfolio is equal to 4, what fraction of the institution's optimum portfolio will each of the stocks that the analyst follows represent?
c. Why should
(diversifiable risk) enter into the optimal solution?
Unlock Deck
Unlock for access to all 36 flashcards in this deck.
Unlock Deck
k this deck
26
The Value at Risk approach:
A) chooses the valuable large outcome over small in a portfolio .
B) determines the highest expected value of terminal wealth in a portfolio.
C) only looks at the likelihood of bad outcomes.
D) involves a trade-off of expected return and a bad outcome in a portfolio.
A) chooses the valuable large outcome over small in a portfolio .
B) determines the highest expected value of terminal wealth in a portfolio.
C) only looks at the likelihood of bad outcomes.
D) involves a trade-off of expected return and a bad outcome in a portfolio.
Unlock Deck
Unlock for access to all 36 flashcards in this deck.
Unlock Deck
k this deck
27
You are the pension fund manager for a major university with $100 million in an index fund that invests in the S&P 500 stocks.(The fund holds all the stocks in the index in proportion to their market values.)Due to recent pressure from student groups,the regents have decided to divest themselves of the stocks of firms that invest in South Africa.You estimate that this will eliminate 100 of the 500 stocks in your portfolio.You have been asked to evaluate the effect of the divestiture decision.You estimate that the correlation between acceptable and eliminated stocks is 0.6.You also have the following data:
a. What will the effect of the divestment be on the beta of your portfolio? (Report the beta before and after the divestment.)
b. How will divestment affect the standard deviation of your portfolio? (Report the standard deviation before and after the divestment.)
c. Assume that the standard deviation of the overall market is 20%. What is the effect of divestment on the proportion of your portfolio's risk that is unsystematic? (Report the proportion before and after the divestment.)
Unlock Deck
Unlock for access to all 36 flashcards in this deck.
Unlock Deck
k this deck
28
Compare the similarities and differences of Roy's "safety-first" criterion and Kataoka's "safety-first" criterion.
Unlock Deck
Unlock for access to all 36 flashcards in this deck.
Unlock Deck
k this deck
29
How would you decide whether the constant-correlation model or the Sharpe single-index model was superior?
Unlock Deck
Unlock for access to all 36 flashcards in this deck.
Unlock Deck
k this deck
30
Discuss the differences between absolute and relative risk aversion.
Unlock Deck
Unlock for access to all 36 flashcards in this deck.
Unlock Deck
k this deck
31
As the exchange risk and the within country risk are usually relatively independent:
A) an investor in the U.S. faces a higher exchange risk than the sum of exchange risk and within country risk.
B) an investor in the U.S. faces the same exchange risk as the sum of exchange risk and within country risk.
C) a U.S. investor's exchange risk is unaffected by any change in the sum of exchange risk and within country risk.
D) an investor in the U.S. faces a lower total risk than the sum of exchange risk and within country risk.
Unlock Deck
Unlock for access to all 36 flashcards in this deck.
Unlock Deck
k this deck
32
Under the assumption that the future stream of interest rates is perpetual and fixed,dividend ratio predicts a low future equity premium,when:
A) stocks are equally prices compared to their future dividends.
B) stocks have high prices compared to their future dividends.
C) stocks have low prices compared to their current dividends.
D) stocks have high prices compared to their current dividends.
A) stocks are equally prices compared to their future dividends.
B) stocks have high prices compared to their future dividends.
C) stocks have low prices compared to their current dividends.
D) stocks have high prices compared to their current dividends.
Unlock Deck
Unlock for access to all 36 flashcards in this deck.
Unlock Deck
k this deck
33
Market based forward looking estimate of future expected returns are obtained using one of the following:
A) Estimation of the market probabilities from the prices at which derivative securities trade.
B) Historical data to estimate expected returns and measures of risk
C) Estimation of equity risk premium
D) Earning-price ratio and dividend-price ratio.
A) Estimation of the market probabilities from the prices at which derivative securities trade.
B) Historical data to estimate expected returns and measures of risk
C) Estimation of equity risk premium
D) Earning-price ratio and dividend-price ratio.
Unlock Deck
Unlock for access to all 36 flashcards in this deck.
Unlock Deck
k this deck
34
Discuss the portfolio formation process using size and book-to-market ratio in the Fama-French Multi Index Model
Unlock Deck
Unlock for access to all 36 flashcards in this deck.
Unlock Deck
k this deck
35
Discuss the effect of exchange-rate risk on international investments.Does it matter from which viewpoint (foreign vs.domestic)that risk and return are calculated?
Unlock Deck
Unlock for access to all 36 flashcards in this deck.
Unlock Deck
k this deck
36
How is the ranking of a multi-group model determined? How is it different from the index models?
Unlock Deck
Unlock for access to all 36 flashcards in this deck.
Unlock Deck
k this deck
Unlock Deck
Unlock for access to all 36 flashcards in this deck.


