Deck 2: Motion in One Dimension
Full screen (f)
Question
The figure shows a graph of the velocity as a function of time for a basketball player traveling up and down the court in a straight-line path.For the 10 s shown on the graph,find
(a)the net displacement of the player.
(b)the total distance run by the player.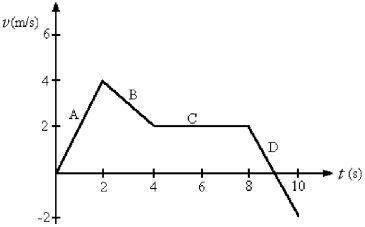
(a)the net displacement of the player.
(b)the total distance run by the player.
Question
Question
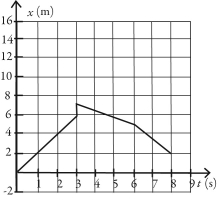
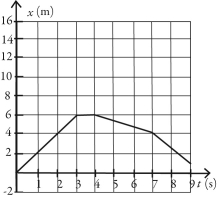
The figure shows the position of an object as a function of time,with all numbers accurate to two significant figures. Between time t = 0.0 s and time t = 9.0 s
(a)what is the average speed of the object?
(b)what is the average velocity of the object?
(a)what is the average speed of the object?
(b)what is the average velocity of the object?
Question
An object starts its motion with a constant velocity of 2.0 m/s toward the east.After 3.0 s,the object stops for 1.0 s.The object then moves toward the west a distance of 2.0 m in 3.0 s.The object continues traveling in the same direction,but increases its speed by 1.0 m/s for the next 2.0 s.Which graph below could represent the motion of this object?
A)
B)
C)
D)
A)
B)
C)
D)
Question
Question
The graph in the figure shows the position of an object as a function of time.The letters H-L represent particular moments of time.At which moments shown (H,I,etc.)is the speed of the object
(a)the greatest?
(b)the smallest?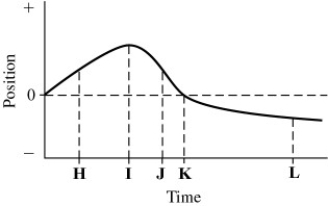
(a)the greatest?
(b)the smallest?
Question
Question
A cat runs along a straight line (the x-axis)from point A to point B to point C,as shown in the figure.The distance between points A and C is 5.00 m,the distance between points B and C is 10.0 m,and the positive direction of the x-axis points to the right.The time to run from A to B is 20.0 s,and the time from B to C is 8.00 s. As the cat runs along the x-axis between points A and C
(a)what is the magnitude of its average velocity?
(b)what is its average speed?
(a)what is the magnitude of its average velocity?
(b)what is its average speed?
Question
The figure represents the position of a particle as it travels along the x-axis. Between t = 2 s and t = 4 s,what is (a)the average speed of the particle and (b)the average velocity of the particle? 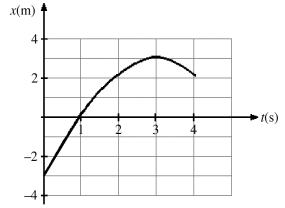
Question
The motion of a particle is described in the velocity versus time graph shown in the figure.We can say that its speed 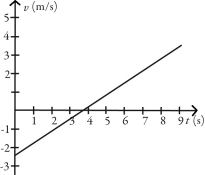
A) increases.
B) decreases.
C) increases and then decreases.
D) decreases and then increases.
A) increases.
B) decreases.
C) increases and then decreases.
D) decreases and then increases.
Question
The motions of a car and a truck along a straight road are represented by the velocity-time graphs in the figure.The two vehicles are initially alongside each other at time t = 0.At time T,what is true about these two vehicles since time t = 0? 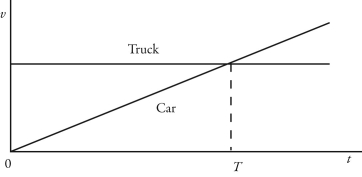
A) The truck will have traveled further than the car.
B) The car will have traveled further than the truck.
C) The truck and the car will have traveled the same distance.
D) The car will be traveling faster than the truck.
A) The truck will have traveled further than the car.
B) The car will have traveled further than the truck.
C) The truck and the car will have traveled the same distance.
D) The car will be traveling faster than the truck.
Question
Question
Question
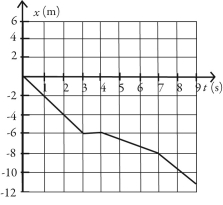
The figure shows the position of an object as a function of time. During the time interval from time
t = 0.0 s and time t = 9.0 s
(a)what is the length of the path the object followed?
(b)what is the displacement of the object?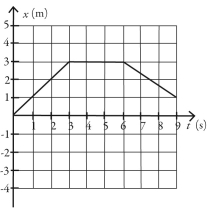
t = 0.0 s and time t = 9.0 s
(a)what is the length of the path the object followed?
(b)what is the displacement of the object?
Question
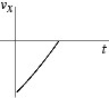
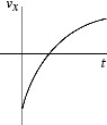
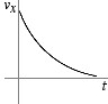
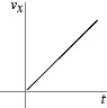
The figure shows the graph of the position x as a function of time for an object moving in the straight line (the x-axis).Which of the following graphs best describes the velocity along the x-axis as a function of time for this object? 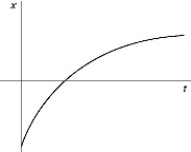
A)
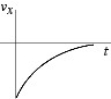
B)
C)
D)
E)
A)
B)
C)
D)
E)

Unlock Deck
Sign up to unlock the cards in this deck!
Unlock Deck
Unlock Deck
1/15
Play
Full screen (f)
Deck 2: Motion in One Dimension
1
The figure shows a graph of the velocity as a function of time for a basketball player traveling up and down the court in a straight-line path.For the 10 s shown on the graph,find
(a)the net displacement of the player.
(b)the total distance run by the player.
(a)the net displacement of the player.
(b)the total distance run by the player.
(a)18 m
(b)20 m
(b)20 m
2
The position of an object as a function of time is given by x = bt2 - ct,where b = 2.0 m/s2 and c = 6.7 m/s and x and t are in SI units.What is the instantaneous velocity of the object when t = 2.2?
A) 1.7 m/s
B) 2.1 m/s
C) 2.3 m/s
D) 2.7 m/s
A) 1.7 m/s
B) 2.1 m/s
C) 2.3 m/s
D) 2.7 m/s
2.1 m/s
3
The figure shows the position of an object as a function of time,with all numbers accurate to two significant figures. Between time t = 0.0 s and time t = 9.0 s
(a)what is the average speed of the object?
(b)what is the average velocity of the object?
(a)what is the average speed of the object?
(b)what is the average velocity of the object?
(a)0.56 m/s
(b)0.11 m/s
(b)0.11 m/s
4
An object starts its motion with a constant velocity of 2.0 m/s toward the east.After 3.0 s,the object stops for 1.0 s.The object then moves toward the west a distance of 2.0 m in 3.0 s.The object continues traveling in the same direction,but increases its speed by 1.0 m/s for the next 2.0 s.Which graph below could represent the motion of this object?
A)
B)
C)
D)
A)
B)
C)
D)
Unlock Deck
Unlock for access to all 15 flashcards in this deck.
Unlock Deck
k this deck
5
As part of an exercise program,a woman walks south at a speed of 2.00 m/s for 60.0 minutes. She then turns around and walks north a distance 3000 m in 25.0 minutes
(a)What is the woman's average velocity during her entire motion?
A)0.824 m/s south
B)1.93 m/s south
C)2.00 m/s south
D)1.79 m/s south
E)800 m/s south
(b)What is the woman's average speed during her entire motion?
A)0.824 m/s
B)1.93 m/s
C)2.00 m/s
D)1.79 m/s
E)800 m/s
(a)What is the woman's average velocity during her entire motion?
A)0.824 m/s south
B)1.93 m/s south
C)2.00 m/s south
D)1.79 m/s south
E)800 m/s south
(b)What is the woman's average speed during her entire motion?
A)0.824 m/s
B)1.93 m/s
C)2.00 m/s
D)1.79 m/s
E)800 m/s
Unlock Deck
Unlock for access to all 15 flashcards in this deck.
Unlock Deck
k this deck
6
The graph in the figure shows the position of an object as a function of time.The letters H-L represent particular moments of time.At which moments shown (H,I,etc.)is the speed of the object
(a)the greatest?
(b)the smallest?
(a)the greatest?
(b)the smallest?
Unlock Deck
Unlock for access to all 15 flashcards in this deck.
Unlock Deck
k this deck
7
The velocity of an object is given by the expression v(t)= 3.00 m/s + (4.00 m/s3)t2,where t is in seconds. Determine the position of the object as a function of time if it is located at x = 1.00 m at time
T = 0.000 s.
A) (4.00 m/s)t + 1.00 m
B) (3.00 m/s)t + (1.33 m/s3)t3
C) (4.00 m/s)t
D) 1.33 m
E) 1.00 m + (3.00 m/s)t + (1.33 m/s3)t3
T = 0.000 s.
A) (4.00 m/s)t + 1.00 m
B) (3.00 m/s)t + (1.33 m/s3)t3
C) (4.00 m/s)t
D) 1.33 m
E) 1.00 m + (3.00 m/s)t + (1.33 m/s3)t3
Unlock Deck
Unlock for access to all 15 flashcards in this deck.
Unlock Deck
k this deck
8
A cat runs along a straight line (the x-axis)from point A to point B to point C,as shown in the figure.The distance between points A and C is 5.00 m,the distance between points B and C is 10.0 m,and the positive direction of the x-axis points to the right.The time to run from A to B is 20.0 s,and the time from B to C is 8.00 s. As the cat runs along the x-axis between points A and C
(a)what is the magnitude of its average velocity?
(b)what is its average speed?
(a)what is the magnitude of its average velocity?
(b)what is its average speed?
Unlock Deck
Unlock for access to all 15 flashcards in this deck.
Unlock Deck
k this deck
9
The figure represents the position of a particle as it travels along the x-axis. Between t = 2 s and t = 4 s,what is (a)the average speed of the particle and (b)the average velocity of the particle?
Unlock Deck
Unlock for access to all 15 flashcards in this deck.
Unlock Deck
k this deck
10
The motion of a particle is described in the velocity versus time graph shown in the figure.We can say that its speed
A) increases.
B) decreases.
C) increases and then decreases.
D) decreases and then increases.
A) increases.
B) decreases.
C) increases and then decreases.
D) decreases and then increases.
Unlock Deck
Unlock for access to all 15 flashcards in this deck.
Unlock Deck
k this deck
11
The motions of a car and a truck along a straight road are represented by the velocity-time graphs in the figure.The two vehicles are initially alongside each other at time t = 0.At time T,what is true about these two vehicles since time t = 0?
A) The truck will have traveled further than the car.
B) The car will have traveled further than the truck.
C) The truck and the car will have traveled the same distance.
D) The car will be traveling faster than the truck.
A) The truck will have traveled further than the car.
B) The car will have traveled further than the truck.
C) The truck and the car will have traveled the same distance.
D) The car will be traveling faster than the truck.
Unlock Deck
Unlock for access to all 15 flashcards in this deck.
Unlock Deck
k this deck
12
Arthur and Betty start walking toward each other when they are 100 m apart.Arthur has a speed of
3.0 m/s and Betty has a speed of 2.0 m/s.Their dog,Spot,starts by Arthur's side at the same time and runs back and forth between them at 5.0 m/s.By the time Arthur and Betty meet,what distance has Spot run?
3.0 m/s and Betty has a speed of 2.0 m/s.Their dog,Spot,starts by Arthur's side at the same time and runs back and forth between them at 5.0 m/s.By the time Arthur and Betty meet,what distance has Spot run?
Unlock Deck
Unlock for access to all 15 flashcards in this deck.
Unlock Deck
k this deck
13
If the fastest you can safely drive is 65 mi/h,what is the longest time you can stop for dinner if you must travel 541 mi in 9.6 h total?
A) 1.0 h
B) 1.3 h
C) 1.4 h
D) You can't stop at all.
A) 1.0 h
B) 1.3 h
C) 1.4 h
D) You can't stop at all.
Unlock Deck
Unlock for access to all 15 flashcards in this deck.
Unlock Deck
k this deck
14
The figure shows the position of an object as a function of time. During the time interval from time
t = 0.0 s and time t = 9.0 s
(a)what is the length of the path the object followed?
(b)what is the displacement of the object?
t = 0.0 s and time t = 9.0 s
(a)what is the length of the path the object followed?
(b)what is the displacement of the object?
Unlock Deck
Unlock for access to all 15 flashcards in this deck.
Unlock Deck
k this deck
15
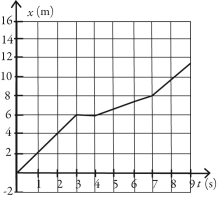
The figure shows the graph of the position x as a function of time for an object moving in the straight line (the x-axis).Which of the following graphs best describes the velocity along the x-axis as a function of time for this object?
A)
B)
C)
D)
E)
A)
B)
C)
D)
E)
Unlock Deck
Unlock for access to all 15 flashcards in this deck.
Unlock Deck
k this deck
Unlock Deck
Unlock for access to all 15 flashcards in this deck.


