Deck 16: The Labor Market
Full screen (f)
Question
Question
The figure below shows the supply curve for labor.Figure 16.1

Which of the following statements contradicts an upward-sloping market-supply curve?`
A)All people have backward-bending individual supply curves.
B)Leisure is more enjoyable than work.
C)The elasticity of labor supply is larger than the elasticity of labor demand.
D)To work more means to enjoy less leisure.
E)The opportunity cost of leisure decreases with an increase in wage rate.
Question
The figure given below shows the demand curves (D1 and D2) and supply curves (S1 and S2) of labor in the labor market.Figure: 16.2
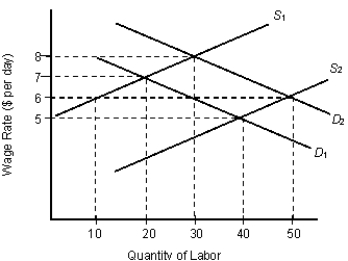
According to Figure 16.2, assume that the market is at an initial equilibrium in which the labor supply is S1 and the labor demand is D1. The labor supply curve shifts from S1 to S2 but the wage remains unchanged at its previous equilibrium level. Which of the following is true?
A)The economy is still in equilibrium.
B)There is a shortage of 20 workers.
C)There is a shortage of 30 workers.
D)There is a surplus of 30 workers.
E)There is a surplus of 20 workers.
Question
The figure given below shows the demand curves (D1 and D2) and supply curves (S1 and S2) of labor in the labor market.Figure: 16.2
In Figure 16.2, the initial labor supply is S1 , and the labor demand is D1. If the wage rate is $6, which of the following is correct?
A)The actual wage is above the equilibrium wage.
B)There is a shortage of 30 workers.
C)There is a shortage of 20 workers.
D)There is a shortage of 10 workers.
E)The market is in equilibrium.
Question
The figure below shows the supply curve for labor.Figure 16.1
The labor market is in equilibrium when:
A)the demand curve lies above the supply curve.
B)both demand and supply curves are positively sloped.
C)both demand and supply curves are negatively sloped.
D)the demand curve intersects the supply curve.
E)the demand curve is negatively sloped but the supply curve is positively sloped.
Question
Question
Question
The figure below shows the supply curve for labor.Figure 16.1
Refer to Figure 16.1. When wage rate increases from W2 to W3, then the:
A)quantity of labor supplied increases from Q2 to Q3.
B)quantity of labor supplied decreases from Q3 to Q4.
C)quantity of labor supplied increases from Q4 to Q5.
D)quantity of labor supplied increases from Q2 to Q4.
E)quantity of labor supplied increases from Q3 to Q5.
Question
The figure below shows the supply curve for labor.Figure 16.1
The labor demand curve is based on the firm's:
A)average revenue curve.
B)marginal product curve.
C)marginal cost curve.
D)average cost curve.
E)marginal revenue product curve.
The labor demand curve is based on the firm's:
A)average revenue curve.
B)marginal product curve.
C)marginal cost curve.
D)average cost curve.
E)marginal revenue product curve.
Question
Question
The figure given below shows the demand curves (D1 and D2) and supply curves (S1 and S2) of labor in the labor market.Figure: 16.2
Which of the following is not a reason for compensating wage differentials?
A)The risk involved in certain jobs
B)An excess supply of workers in some industries
C)A high probability of staying away from home
D)To attract more laborers in risky professions
E)Unpleasant working consditions
Which of the following is not a reason for compensating wage differentials?
A)The risk involved in certain jobs
B)An excess supply of workers in some industries
C)A high probability of staying away from home
D)To attract more laborers in risky professions
E)Unpleasant working consditions
Question
The figure below shows the supply curve for labor.Figure 16.1
Why is the market supply curve of labor positively sloped though individual supply curves are backward-bending beyond a certain wage rate?
A)People tend to work less when wage rate increases.
B)Every individual laborer has equal trade offs between labor and leisure.
C)People tend to substitute labor for leisure.
D)People work more for the fear of losing their jobs and becoming unemployed.
E)All the individual supply curves do not bend backward at one particular wage rate.
Question
The figure below shows the supply curve for labor.Figure 16.1
The marginal revenue product is:
A)the value of all the final goods and services produced by a firm.
B)the value that an worker contributes to a firm.
C)an increase in the profit of a firm with an increase in the output by one unit.
D)the output per unit of worker employed by a firm.
E)the value that all the unskilled workers contribute to a firm.
Question
The figure given below shows the demand curves (D1 and D2) and supply curves (S1 and S2) of labor in the labor market.Figure: 16.2
The term compensating wage differential refers to:
A)the bargaining capacity of a monoposonist in the labor market.
B)the wage differences that arise from differences in the risk involved in different jobs.
C)the criteria on which a firm offers a 401K plan to all its employees or just some employees.
D)the wage differences that arise from difference in productivity of the workers in a firm.
E)the negotiating power of the trade union.
Question
Question
The figure below shows the supply curve for labor.Figure 16.1
As the wage rate increases, the quantity of labor supplied by an individual worker will:
A)invariably increase
B)invariably decrease.
C)first increase and then decrease.
D)first decrease and then increase.
E)remain constant.
As the wage rate increases, the quantity of labor supplied by an individual worker will:
A)invariably increase
B)invariably decrease.
C)first increase and then decrease.
D)first decrease and then increase.
E)remain constant.
Question
The figure below shows the supply curve for labor.Figure 16.1
Why does the labor market have more than one equilibrium wage rate?
A)Workers differ in their productivities.
B)Productivity of workers increases initially but later declines.
C)The labor demand curve is backward bending.
D)Marginal revenue product of different inputs used by firms vary.
E)Employers compete among themselves to hire the best workers.
Question
The figure given below shows the demand curves (D1 and D2) and supply curves (S1 and S2) of labor in the labor market.Figure: 16.2
Refer to Figure 16.2. At the initial equilibrium (when demand is D1 and supply is S1), the firm employs _____ laborers at a wage of _____.
A)20; $7
B)30; $8
C)50; $6
D)20; $5
E)10; $5
Refer to Figure 16.2. At the initial equilibrium (when demand is D1 and supply is S1), the firm employs _____ laborers at a wage of _____.
A)20; $7
B)30; $8
C)50; $6
D)20; $5
E)10; $5
Question
The figure given below shows the demand curves (D1 and D2) and supply curves (S1 and S2) of labor in the labor market.Figure: 16.2
Which of the following professionals is likely to receive higher compensatory wages?
A)Financial accountants
B)Software engineers
C)Sales workers
D)Share traders
E)Tailors
Which of the following professionals is likely to receive higher compensatory wages?
A)Financial accountants
B)Software engineers
C)Sales workers
D)Share traders
E)Tailors
Question
The figure below shows the supply curve for labor.Figure 16.1
Refer to Figure 16.1. When wage rate increases from W3 to W5, then the:
A)quantity of labor supplied increases from Q1to Q4.
B)quantity of labor supplied decreases from Q5 to Q2.
C)quantity of labor supplied increases from Q2 to Q4.
D)quantity of labor supplied decreases from Q4 to Q2.
E)quantity of labor supplied increases from Q1 to Q54.
Question
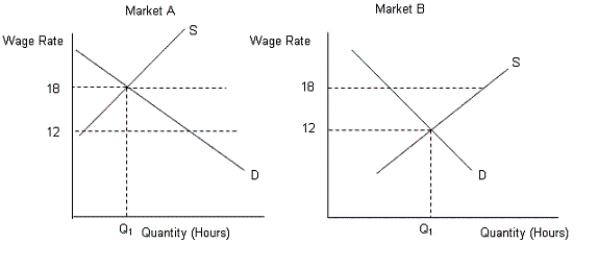
The figures given below show the demand (D)and supply (S) curves of labor in two different markets.Figure 16.3
Which of the following refers to human capital?
A)Money spent by business to acquire labor
B)The acquired skill and productivity of workers
C)The plant and equipment used with labor
D)Money spent on purchasing the latest machinery
E)Money that workers save
Which of the following refers to human capital?
A)Money spent by business to acquire labor
B)The acquired skill and productivity of workers
C)The plant and equipment used with labor
D)Money spent on purchasing the latest machinery
E)Money that workers save
Question
The figures given below show the demand (D)and supply (S) curves of labor in two different markets.Figure 16.3
Refer to Figure 16.3. If the wage rates in market A and market B were set at $15, then:
A)there would be a shortage of workers in both markets.
B)there would be a surplus of workers in both markets.
C)there would be a shortage of workers in market A and a surplus of workers in market B.
D)there would be a shortage of workers in market B and a surplus of workers in market A.
E)both the markets will be in equilibrium.
Question
The figures given below show the demand (D)and supply (S) curves of labor in two different markets.Figure 16.3
A college student's choice of a major and an occupation reflects:
A)each college student's future expectation of wage inflation.
B)a lack of information on the part of the students.
C)a lack of proper education and vocational training.
D)the return on investment in human capital.
E)the opportunity costs each college student faces.
Question
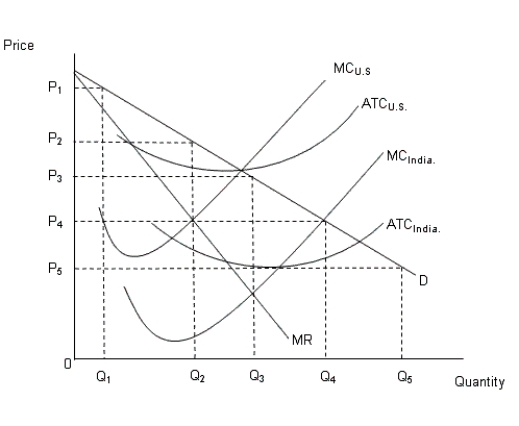
The figure given below shows the demand curve in the U.S. and the cost curves in U.S. and India.Figure: 16.4
 In the figure:
MC: Marginal cost curve
ATC: Average total cost curve
D: Demand curve in the U.S.MR: Marginal revenue curve in the U.S.
In Figure 16.4, the price and quantity of the good if produced by India would be _____ and _____ respectively.
A)P3; Q3
B)P4; Q4
C)P1; Q1
D)P5; Q5
E)P2; Q2
In the figure:MC: Marginal cost curve
ATC: Average total cost curve
D: Demand curve in the U.S.MR: Marginal revenue curve in the U.S.
In Figure 16.4, the price and quantity of the good if produced by India would be _____ and _____ respectively.
A)P3; Q3
B)P4; Q4
C)P1; Q1
D)P5; Q5
E)P2; Q2
Question
The figures given below show the demand (D)and supply (S) curves of labor in two different markets.Figure 16.3
Why are a large number of IT jobs being outsourced to China and India?
A)India and China experience large balance of payment deficits.
B)India and China are highly capital intensive economies.
C)India and China have abundant supply of cheap skilled labor.
D)India and China offers the best working conditions for the employees.
E)India and China experiences balance of payment surpluses.
Question
The figures given below show the demand (D)and supply (S) curves of labor in two different markets.Figure 16.3
Refer to Figure 16.3. If the wage rates in market A and market B were set at $20, then:
A)both the markets would be in equilibrium.
B)there would be a shortage of workers in market A and a surplus of workers in market B.
C)there would be a shortage of workers in market B and a surplus of workers in market A.
D)there would be a surplus of workers in both markets.
E)there would be a shortage of workers in both markets.
Question
The figure given below shows the demand curve in the U.S. and the cost curves in U.S. and India.Figure: 16.4
In the figure:
MC: Marginal cost curve
ATC: Average total cost curve
D: Demand curve in the U.S.MR: Marginal revenue curve in the U.S.
According to Figure 16.4, one of the possible outcomes of such offshoring is that:
A)the price of the good in question rises in the U.S. market.
B)the demand for Indian worker declines.
C)the demand for U.S. workers increase.
D)the price of the good in question rises in the Indian market.
E)the Indian workers replace the U.S. workers.
In the figure:MC: Marginal cost curve
ATC: Average total cost curve
D: Demand curve in the U.S.MR: Marginal revenue curve in the U.S.
According to Figure 16.4, one of the possible outcomes of such offshoring is that:
A)the price of the good in question rises in the U.S. market.
B)the demand for Indian worker declines.
C)the demand for U.S. workers increase.
D)the price of the good in question rises in the Indian market.
E)the Indian workers replace the U.S. workers.
Question
The figures given below show the demand (D)and supply (S) curves of labor in two different markets.Figure 16.3
Which of the following statements is true?
A)Income earned by a worker with a college degree grows more rapidly than a worker without a college degree during their early working years.
B)A worker with a college degree always earns less than a worker without a college degree.
C)A worker with a college degree always earns more than a worker without a college degree.
D)A worker without a college degree initially earns more than a worker with a college degree but the latter surpasses the former in due course of time.
E)Both the workers earn equal incomes after a certain period of time.
Question
The figures given below show the demand (D)and supply (S) curves of labor in two different markets.Figure 16.3
Which of the following is a reason for the wage differential shown in Figure 16.3?
A)The workers in Market B are more productive than the workers in Market A.
B)The workers in Market B are unionized whereas the workers in Market A are not.
C)Market B hires a larger number of skilled workers than Market A.
D)Market A represents the market for a risky occupation.
E)Working conditions offered by the firms in Market B are uncongenial.
Question
The figures given below show the demand (D)and supply (S) curves of labor in two different markets.Figure 16.3
The ratio of the median income of college-to high school-educated workers is called the _____.
A)college income premium
B)college income differential
C)college income benefit
D)college income compensation
E)education income gap
The ratio of the median income of college-to high school-educated workers is called the _____.
A)college income premium
B)college income differential
C)college income benefit
D)college income compensation
E)education income gap
Question
The figures given below show the demand (D)and supply (S) curves of labor in two different markets.Figure 16.3
Investment in human capital implies:
A)investment on machines, technological development, and equipments.
B)expenses on education.
C)expenses on paying interest for hiring real capital.
D)expenses on the purchase of land.
E)profit of the entrepreneurs.
Investment in human capital implies:
A)investment on machines, technological development, and equipments.
B)expenses on education.
C)expenses on paying interest for hiring real capital.
D)expenses on the purchase of land.
E)profit of the entrepreneurs.
Question
The figures given below show the demand (D)and supply (S) curves of labor in two different markets.Figure 16.3
From Figure 16.3, calculate the amount of the wage differential.
A)$6
B)$18
C)$2
D)$20
E)$15
From Figure 16.3, calculate the amount of the wage differential.
A)$6
B)$18
C)$2
D)$20
E)$15
Question
The figures given below show the demand (D)and supply (S) curves of labor in two different markets.Figure 16.3
Why do skilled workers earn relatively higher wages than unskilled workers?
A)The marginal productivity of skilled workers is low.
B)The marginal cost of hiring skilled workers is low.
C)The supply of skilled workers is relatively less.
D)There is an abundant supply of skilled workers.
E)The marginal cost of hiring unskilled workers is high.
Question
The figures given below show the demand (D)and supply (S) curves of labor in two different markets.Figure 16.3
Outsourcing refers to the process in which:
A)a firm purchases service from another firm in another country.
B)a firm hires laborers from a foreign market.
C)the government of a country works toward providing social security and other rights to migrant workers.
D)a firm purchases service from another firm.
E) workers of a particular country seek employment in a firm of a foreign country.
Question
The figure given below shows the demand curve in the U.S. and the cost curves in U.S. and India.Figure: 16.4
In the figure:
MC: Marginal cost curve
ATC: Average total cost curve
D: Demand curve in the U.S.MR: Marginal revenue curve in the U.S.
According to Figure 16.4, the price and quantity of the good if produced by the U.S. would be _____ and _____ respectively.
A)P1; Q1
B)P3; Q3
C)P2; Q4
D)P2; Q2
E)P4; Q4
In the figure:MC: Marginal cost curve
ATC: Average total cost curve
D: Demand curve in the U.S.MR: Marginal revenue curve in the U.S.
According to Figure 16.4, the price and quantity of the good if produced by the U.S. would be _____ and _____ respectively.
A)P1; Q1
B)P3; Q3
C)P2; Q4
D)P2; Q2
E)P4; Q4
Question
The figures given below show the demand (D)and supply (S) curves of labor in two different markets.Figure 16.3
Which of the following is a major impact of offshoring?
A)Elimination of domestic jobs
B)Elimination of jobs in foreign countries
C)Creation of jobs in the domestic country
D)An increase in the cost of production of domestic firms
E)A reduction in the cost of production of foreign firms
Which of the following is a major impact of offshoring?
A)Elimination of domestic jobs
B)Elimination of jobs in foreign countries
C)Creation of jobs in the domestic country
D)An increase in the cost of production of domestic firms
E)A reduction in the cost of production of foreign firms
Question
The figures given below show the demand (D)and supply (S) curves of labor in two different markets.Figure 16.3
If the supply of skilled workers is increased such that it is equal to the supply of unskilled workers, we can expect:
A)wages of skilled workers to be equal to wages of unskilled workers.
B)wages of skilled workers to be lower than wages of unskilled workers.
C)wages of skilled workers to be higher than wages of unskilled workers.
D)wages of unskilled workers to fall from its current level.
E)wages of both skilled and unskilled workers to remain unaffected.
Question
The figures given below show the demand (D)and supply (S) curves of labor in two different markets.Figure 16.3
Offshoring refers to the the process in which:
A)a firm hires laborers from a foreign market.
B)a firm purchases service from another firm.
C)a firm purchases service from another firm in another country.
D)workers of a particular country seek employment in a firm of a foreign country.
E)the government of a country works toward providing social security and other rights to migrant workers.
Question
The figures given below show the demand (D)and supply (S) curves of labor in two different markets.Figure 16.3
A large number of U.S. firms send jobs to low-wage nations as it enables them to:
A)raise the price of their products.
B)reduce their cost of production.
C)get better quality products.
D)obtain diversified products.
E)politically dominate the economies where they are offshoring.
A large number of U.S. firms send jobs to low-wage nations as it enables them to:
A)raise the price of their products.
B)reduce their cost of production.
C)get better quality products.
D)obtain diversified products.
E)politically dominate the economies where they are offshoring.
Question
The figures given below show the demand (D)and supply (S) curves of labor in two different markets.Figure 16.3
An individual is induced to change his/her occupation if:
A)the sunk cost of the current occupation is high.
B)the expected net gains from the alternative occupation is negative.
C)the outlook for future income, in the current occupation, increases.
D)he/she has devoted a lot of money, time and effort in the current occupation.
E)the marginal cost of remaining in the current occupation is very high.
Question
The figure given below shows the income-leisure trade off of an individual.Figure 16.5
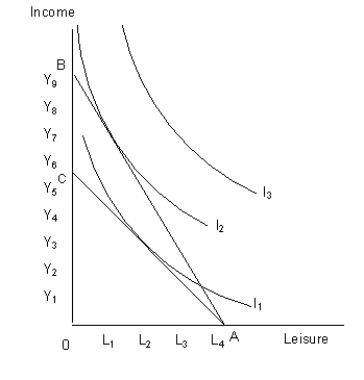 AB and AC: Income constraints of the individual
I1, I2, and I3 curves show the income leisure choices of the individual.
Which of the following are benefits created by the immigrants?
A)Increase in educational expenditures on public schools for their children
B)Increase in the wages of unskilled laborers
C)Reduction in costs for some firms
D)Increased expenditures on health care for illegal immigrants at emergency clinics and hospitals
E)Increase in the wages of skilled workers
AB and AC: Income constraints of the individualI1, I2, and I3 curves show the income leisure choices of the individual.
Which of the following are benefits created by the immigrants?
A)Increase in educational expenditures on public schools for their children
B)Increase in the wages of unskilled laborers
C)Reduction in costs for some firms
D)Increased expenditures on health care for illegal immigrants at emergency clinics and hospitals
E)Increase in the wages of skilled workers
Question
The figure given below shows the income-leisure trade off of an individual.Figure 16.5
AB and AC: Income constraints of the individual
I1, I2, and I3 curves show the income leisure choices of the individual.
A regressive tax structure is one:
A)in which the tax increases as the base increases.
B)in which the tax rate remains the same as the base increases.
C)that tends to discourage additional work as income rises.
D)that is famous and in use in the U.S.
E)in which the tax rate increases as the base increases.
AB and AC: Income constraints of the individualI1, I2, and I3 curves show the income leisure choices of the individual.
A regressive tax structure is one:
A)in which the tax increases as the base increases.
B)in which the tax rate remains the same as the base increases.
C)that tends to discourage additional work as income rises.
D)that is famous and in use in the U.S.
E)in which the tax rate increases as the base increases.
Question
The figure given below shows the income-leisure trade off of an individual.Figure 16.5
AB and AC: Income constraints of the individual
I1, I2, and I3 curves show the income leisure choices of the individual.
For economists, discrimination is difficult to rationalize because:
A)it is costly to those who discriminate.
B)the firms can actually reap greater profits by discriminating between their workers.
C)in a freely functioning labor market, there is no such thing as discrimination.
D)economists know that in the real world, personal prejudices do not exist.
E)wages will not be allowed to fall below their natural equilibrium rate.
AB and AC: Income constraints of the individualI1, I2, and I3 curves show the income leisure choices of the individual.
For economists, discrimination is difficult to rationalize because:
A)it is costly to those who discriminate.
B)the firms can actually reap greater profits by discriminating between their workers.
C)in a freely functioning labor market, there is no such thing as discrimination.
D)economists know that in the real world, personal prejudices do not exist.
E)wages will not be allowed to fall below their natural equilibrium rate.
Question
The figure given below shows the demand curve in the U.S. and the cost curves in U.S. and India.Figure: 16.4
In the figure:
MC: Marginal cost curve
ATC: Average total cost curve
D: Demand curve in the U.S.MR: Marginal revenue curve in the U.S.
The burden of a tax is mainly borne by the buyer if:
A)the supply of the good is perfectly price elastic.
B)the supply of the good is relatively price elastic.
C)the demand for the good is relatively price elastic.
D)the demand for the good is relatively price inelastic.
E)the demand for the good is perfectly price elastic.
In the figure:MC: Marginal cost curve
ATC: Average total cost curve
D: Demand curve in the U.S.MR: Marginal revenue curve in the U.S.
The burden of a tax is mainly borne by the buyer if:
A)the supply of the good is perfectly price elastic.
B)the supply of the good is relatively price elastic.
C)the demand for the good is relatively price elastic.
D)the demand for the good is relatively price inelastic.
E)the demand for the good is perfectly price elastic.
Question
The figure given below shows the income-leisure trade off of an individual.Figure 16.5
AB and AC: Income constraints of the individual
I1, I2, and I3 curves show the income leisure choices of the individual.
With illegal immigration the unskilled labor supply curve:
A)shifts to the left.
B)becomes perfectly inelastic.
C)becomes perfectly elastic.
D)shifts to the right.
E)becomes non-existent.
AB and AC: Income constraints of the individualI1, I2, and I3 curves show the income leisure choices of the individual.
With illegal immigration the unskilled labor supply curve:
A)shifts to the left.
B)becomes perfectly inelastic.
C)becomes perfectly elastic.
D)shifts to the right.
E)becomes non-existent.
Question
The figure given below shows the income-leisure trade off of an individual.Figure 16.5
AB and AC: Income constraints of the individual
I1, I2, and I3 curves show the income leisure choices of the individual.
The greatest number of recent immigrants to the U.S. come from Mexico because of:
A)political insecurity in Mexico.
B)religious insecurity in Mexico.
C)proximity and wage differentials.
D)racial discrimination in Mexico.
E)greater social security in the United States.
AB and AC: Income constraints of the individualI1, I2, and I3 curves show the income leisure choices of the individual.
The greatest number of recent immigrants to the U.S. come from Mexico because of:
A)political insecurity in Mexico.
B)religious insecurity in Mexico.
C)proximity and wage differentials.
D)racial discrimination in Mexico.
E)greater social security in the United States.
Question
The figure given below shows the income-leisure trade off of an individual.Figure 16.5
AB and AC: Income constraints of the individual
I1, I2, and I3 curves show the income leisure choices of the individual.
Which of the following factors is likely to be responsible for the inward rotation of the income constraint from AB to AC, in Figure 16.5?
A)An increase in income
B)An increase in demand for labor
C)An increase in the income tax rate
D)A decrease in the opportunity cost of labor
E)A decrease in the supply of labor
AB and AC: Income constraints of the individualI1, I2, and I3 curves show the income leisure choices of the individual.
Which of the following factors is likely to be responsible for the inward rotation of the income constraint from AB to AC, in Figure 16.5?
A)An increase in income
B)An increase in demand for labor
C)An increase in the income tax rate
D)A decrease in the opportunity cost of labor
E)A decrease in the supply of labor
Question
The figure given below shows the income-leisure trade off of an individual.Figure 16.5
AB and AC: Income constraints of the individual
I1, I2, and I3 curves show the income leisure choices of the individual.
Which of the following is an impact of the restriction on immigration on the domestic firms?
A)The domestic firms would produce more and reap greater profits.
B)The domestic firms would hire more unskilled laborers at lower wages.
C)The domestic firms would charge low prices for their products.
D)The domestic firms would have to pay higher wages and make less profit.
E)The domestic firms would make above normal profits in the long run.
AB and AC: Income constraints of the individualI1, I2, and I3 curves show the income leisure choices of the individual.
Which of the following is an impact of the restriction on immigration on the domestic firms?
A)The domestic firms would produce more and reap greater profits.
B)The domestic firms would hire more unskilled laborers at lower wages.
C)The domestic firms would charge low prices for their products.
D)The domestic firms would have to pay higher wages and make less profit.
E)The domestic firms would make above normal profits in the long run.
Question
The figure given below shows the income-leisure trade off of an individual.Figure 16.5
AB and AC: Income constraints of the individual
I1, I2, and I3 curves show the income leisure choices of the individual.
In Figure 16.5, if the income constraint of the individual is given by the line AC, he maximizes his utility by choosing _____ hours of leisure and _____ units of income.
A)L1; Y5
B)0; Y7
C)L3; Y3
D)L2; Y3
E)L4; Y4
AB and AC: Income constraints of the individualI1, I2, and I3 curves show the income leisure choices of the individual.
In Figure 16.5, if the income constraint of the individual is given by the line AC, he maximizes his utility by choosing _____ hours of leisure and _____ units of income.
A)L1; Y5
B)0; Y7
C)L3; Y3
D)L2; Y3
E)L4; Y4
Question
The figure given below shows the income-leisure trade off of an individual.Figure 16.5
AB and AC: Income constraints of the individual
I1, I2, and I3 curves show the income leisure choices of the individual.
According to the U.S. population surveys conducted by the census, since 1980 the total foreign-born population as a percentage of the total U.S. population:
A)has not changed.
B)has declined.
C)has risen.
D)has been stable.
E)has fallen to zero.
AB and AC: Income constraints of the individualI1, I2, and I3 curves show the income leisure choices of the individual.
According to the U.S. population surveys conducted by the census, since 1980 the total foreign-born population as a percentage of the total U.S. population:
A)has not changed.
B)has declined.
C)has risen.
D)has been stable.
E)has fallen to zero.
Question
The figure given below shows the income-leisure trade off of an individual.Figure 16.5
AB and AC: Income constraints of the individual
I1, I2, and I3 curves show the income leisure choices of the individual.
Which of the following is not a cost of illegal immigration in the U.S.?
A)The adverse impact on unskilled workers
B)The damage to national property caused during the process of immigration
C)Additional expenditure on healthcare at emergency clinics and hospitals
D)Expenditure on public education on the children of immigrants.
E)Expenditure on employment insurance programs for the illegal immigrants.
AB and AC: Income constraints of the individualI1, I2, and I3 curves show the income leisure choices of the individual.
Which of the following is not a cost of illegal immigration in the U.S.?
A)The adverse impact on unskilled workers
B)The damage to national property caused during the process of immigration
C)Additional expenditure on healthcare at emergency clinics and hospitals
D)Expenditure on public education on the children of immigrants.
E)Expenditure on employment insurance programs for the illegal immigrants.
Question
The figure given below shows the income-leisure trade off of an individual.Figure 16.5
AB and AC: Income constraints of the individual
I1, I2, and I3 curves show the income leisure choices of the individual.
If the tax rate increases with an increase in income, the income tax structure is said to be _____.
A)proportional
B)regressive
C)progressive
D)lump-sum
E)negatively skewed
AB and AC: Income constraints of the individualI1, I2, and I3 curves show the income leisure choices of the individual.
If the tax rate increases with an increase in income, the income tax structure is said to be _____.
A)proportional
B)regressive
C)progressive
D)lump-sum
E)negatively skewed
Question
The figure given below shows the income-leisure trade off of an individual.Figure 16.5
AB and AC: Income constraints of the individual
I1, I2, and I3 curves show the income leisure choices of the individual.
In Figure 16.5, if the income constraint of the individual is given by the line AB, he maximizes his utility by choosing _____ hours of leisure and earns an income of _____.
A)0; Y2
B)L1; Y7
C)L2; Y5
D)L3; Y4
E)L4; Y7
AB and AC: Income constraints of the individualI1, I2, and I3 curves show the income leisure choices of the individual.
In Figure 16.5, if the income constraint of the individual is given by the line AB, he maximizes his utility by choosing _____ hours of leisure and earns an income of _____.
A)0; Y2
B)L1; Y7
C)L2; Y5
D)L3; Y4
E)L4; Y7
Question
The figure given below shows the income-leisure trade off of an individual.Figure 16.5
AB and AC: Income constraints of the individual
I1, I2, and I3 curves show the income leisure choices of the individual.
One of the major impacts of restricting immigration is that the:
A)prices of the products produced by unskilled laborers will decline.
B)prices of the products produced by unskilled labor will increase.
C)supply of labor in agriculture will increase.
D)supply of labor in the industrial sector will rise.
E)government's expenditure on education and health will rise.
AB and AC: Income constraints of the individualI1, I2, and I3 curves show the income leisure choices of the individual.
One of the major impacts of restricting immigration is that the:
A)prices of the products produced by unskilled laborers will decline.
B)prices of the products produced by unskilled labor will increase.
C)supply of labor in agriculture will increase.
D)supply of labor in the industrial sector will rise.
E)government's expenditure on education and health will rise.
Question
The figure given below shows the income-leisure trade off of an individual.Figure 16.5
AB and AC: Income constraints of the individual
I1, I2, and I3 curves show the income leisure choices of the individual.
Which of the following is true of illegal immigrants?
A)They help improve the quality of goods and services produced in the United States.
B)They help increase the wage rate in the U.S.
C)They do not affect the equilibrium wage of the U.S. unskilled labor market.
D)They help some firms lower operating costs, earn more profit, and produce more.
E)They reduce the supply of unskilled labor in the United States.
AB and AC: Income constraints of the individualI1, I2, and I3 curves show the income leisure choices of the individual.
Which of the following is true of illegal immigrants?
A)They help improve the quality of goods and services produced in the United States.
B)They help increase the wage rate in the U.S.
C)They do not affect the equilibrium wage of the U.S. unskilled labor market.
D)They help some firms lower operating costs, earn more profit, and produce more.
E)They reduce the supply of unskilled labor in the United States.
Question
The figure given below shows the demand curve in the U.S. and the cost curves in U.S. and India.Figure: 16.4
In the figure:
MC: Marginal cost curve
ATC: Average total cost curve
D: Demand curve in the U.S.MR: Marginal revenue curve in the U.S.
An increase in the income tax rates:
A)makes the labor supply curve more inelastic.
B)increases the opportunity cost of leisure.
C)lowers the opportunity cost of leisure.
D)shifts the labor supply curve to the right.
E)shifts the labor demand curve to the right.
In the figure:MC: Marginal cost curve
ATC: Average total cost curve
D: Demand curve in the U.S.MR: Marginal revenue curve in the U.S.
An increase in the income tax rates:
A)makes the labor supply curve more inelastic.
B)increases the opportunity cost of leisure.
C)lowers the opportunity cost of leisure.
D)shifts the labor supply curve to the right.
E)shifts the labor demand curve to the right.
Question
The figure given below shows the demand curve in the U.S. and the cost curves in U.S. and India.Figure: 16.4
In the figure:
MC: Marginal cost curve
ATC: Average total cost curve
D: Demand curve in the U.S.MR: Marginal revenue curve in the U.S.
Why has there been an increase in the inequality of income?
A)The demand for skilled workers has declined.
B)The demand for skilled workers has remained constant and the demand for unskilled workers has declined.
C)The government policies went against the unskilled workers.
D)The demand for skilled workers has increased and the demand for unskilled workers has not kept pace.
E)The demand for unskilled workers has increased as they could be hired for lower wages.
In the figure:MC: Marginal cost curve
ATC: Average total cost curve
D: Demand curve in the U.S.MR: Marginal revenue curve in the U.S.
Why has there been an increase in the inequality of income?
A)The demand for skilled workers has declined.
B)The demand for skilled workers has remained constant and the demand for unskilled workers has declined.
C)The government policies went against the unskilled workers.
D)The demand for skilled workers has increased and the demand for unskilled workers has not kept pace.
E)The demand for unskilled workers has increased as they could be hired for lower wages.
Question
The figure given below shows the income-leisure trade off of an individual.Figure 16.5
AB and AC: Income constraints of the individual
I1, I2, and I3 curves show the income leisure choices of the individual.
If the tax rate remains the same as the base increases, the income tax structure is said to be:
A)proportional.
B)lump-sum.
C)negatively skewed.
D)progressive.
E)regressive.
AB and AC: Income constraints of the individualI1, I2, and I3 curves show the income leisure choices of the individual.
If the tax rate remains the same as the base increases, the income tax structure is said to be:
A)proportional.
B)lump-sum.
C)negatively skewed.
D)progressive.
E)regressive.
Question
The figure given below shows the income-leisure trade off of an individual.Figure 16.5
AB and AC: Income constraints of the individual
I1, I2, and I3 curves show the income leisure choices of the individual.
All of the following are reasons for immigration to a foreign country, except that:
A)the domestic country may be politically repressive.
B)there is an abundance of employment opportunities in the domestic country.
C)the domestic country is economically stagnant.
D)there is no scope for upward mobility in the domestic country.
E)there are religious prosecutions.
AB and AC: Income constraints of the individualI1, I2, and I3 curves show the income leisure choices of the individual.
All of the following are reasons for immigration to a foreign country, except that:
A)the domestic country may be politically repressive.
B)there is an abundance of employment opportunities in the domestic country.
C)the domestic country is economically stagnant.
D)there is no scope for upward mobility in the domestic country.
E)there are religious prosecutions.
Question
The figure given below shows the demand curve in the U.S. and the cost curves in U.S. and India.Figure: 16.4
In the figure:
MC: Marginal cost curve
ATC: Average total cost curve
D: Demand curve in the U.S.MR: Marginal revenue curve in the U.S.
Suppose a tax rate of 10 percent applies to all income up to $20,000 a year, income above $20,000 up to $50,000 a year is taxed at a rate of 15%, and income above $50,000 a year is taxed at 20%. Calculate the absolute amount of tax paid by a person whose annual income is $30,000.
A)$2,000
B)$2,500
C)$4,500
D)$4,000
E)$3,500
In the figure:MC: Marginal cost curve
ATC: Average total cost curve
D: Demand curve in the U.S.MR: Marginal revenue curve in the U.S.
Suppose a tax rate of 10 percent applies to all income up to $20,000 a year, income above $20,000 up to $50,000 a year is taxed at a rate of 15%, and income above $50,000 a year is taxed at 20%. Calculate the absolute amount of tax paid by a person whose annual income is $30,000.
A)$2,000
B)$2,500
C)$4,500
D)$4,000
E)$3,500
Question
The figure given below shows the income-leisure trade off of an individual.Figure 16.5
AB and AC: Income constraints of the individual
I1, I2, and I3 curves show the income leisure choices of the individual.
When white males resist to share responsibilities with members of a minority group, it is termed as:
A)employer prejudice.
B)consumer prejudice
C)worker prejudice.
D)statistical discrimination.
E)occupational segregation.
AB and AC: Income constraints of the individualI1, I2, and I3 curves show the income leisure choices of the individual.
When white males resist to share responsibilities with members of a minority group, it is termed as:
A)employer prejudice.
B)consumer prejudice
C)worker prejudice.
D)statistical discrimination.
E)occupational segregation.
Question
The figure given below shows the income-leisure trade off of an individual.Figure 16.5
AB and AC: Income constraints of the individual
I1, I2, and I3 curves show the income leisure choices of the individual.
Which of the following is an instance of employer prejudice that leads to wage differential?
A)Employers attempting to hire workers based on their marginal productivities
B)Employers attempting to hire only male workers
C)Workers attempting to work for only certain organizations
D)Producers purchasing raw materials from selective suppliers
E)Workers ready to work for any employer in the labor market
AB and AC: Income constraints of the individualI1, I2, and I3 curves show the income leisure choices of the individual.
Which of the following is an instance of employer prejudice that leads to wage differential?
A)Employers attempting to hire workers based on their marginal productivities
B)Employers attempting to hire only male workers
C)Workers attempting to work for only certain organizations
D)Producers purchasing raw materials from selective suppliers
E)Workers ready to work for any employer in the labor market
Question
The figure given below shows the income-leisure trade off of an individual.Figure 16.5
AB and AC: Income constraints of the individual
I1, I2, and I3 curves show the income leisure choices of the individual.
Disparate treatment refers to:
A)the treatment of individuals on the basis of their race, sex, color, religion, or national origin.
B)the treatment of individual workers on the basis of their opportunity costs.
C)the treatment of individual workers on the basis of their marginal productivities.
D)discriminatory treatment of the individuals due to lack of correct information.
E)the discriminatory treatment of firms by the trade unions.
AB and AC: Income constraints of the individualI1, I2, and I3 curves show the income leisure choices of the individual.
Disparate treatment refers to:
A)the treatment of individuals on the basis of their race, sex, color, religion, or national origin.
B)the treatment of individual workers on the basis of their opportunity costs.
C)the treatment of individual workers on the basis of their marginal productivities.
D)discriminatory treatment of the individuals due to lack of correct information.
E)the discriminatory treatment of firms by the trade unions.
Question
The figure given below shows the income-leisure trade off of an individual.Figure 16.5
AB and AC: Income constraints of the individual
I1, I2, and I3 curves show the income leisure choices of the individual.
Proponents of comparable worth justifies it on the ground that:
A)interfering with the functioning of the labor market will lead to shortages of labor.
B)interfering with the functioning of the labor market will lead to excess supplies of labor.
C)as a result of personal prejudices the market is unable to assess marginal products.
D)market correctly processes the innumerable information which is available.
E)interaction of demand and supply correctly determines the wage rate.
AB and AC: Income constraints of the individualI1, I2, and I3 curves show the income leisure choices of the individual.
Proponents of comparable worth justifies it on the ground that:
A)interfering with the functioning of the labor market will lead to shortages of labor.
B)interfering with the functioning of the labor market will lead to excess supplies of labor.
C)as a result of personal prejudices the market is unable to assess marginal products.
D)market correctly processes the innumerable information which is available.
E)interaction of demand and supply correctly determines the wage rate.
Question
The following figures show the demand (D) and supply (S) curves of micro and macro economists.Figure 16.6

An individual's decision to supply her labor or to spend her time in leisure activity is known as the labor-leisure tradeoff.
An individual's decision to supply her labor or to spend her time in leisure activity is known as the labor-leisure tradeoff.
Question
The figure given below shows the income-leisure trade off of an individual.Figure 16.5
AB and AC: Income constraints of the individual
I1, I2, and I3 curves show the income leisure choices of the individual.
Which of the following determines comparable worth of a particular job?
A)Cultural background of the applicants
B)Gender of the candidates applying for a job
C)Race of the applicants for the job
D)Level of formal education required for a job
E)National origin of the workers in a factory
AB and AC: Income constraints of the individualI1, I2, and I3 curves show the income leisure choices of the individual.
Which of the following determines comparable worth of a particular job?
A)Cultural background of the applicants
B)Gender of the candidates applying for a job
C)Race of the applicants for the job
D)Level of formal education required for a job
E)National origin of the workers in a factory
Question
The following figures show the demand (D) and supply (S) curves of micro and macro economists.Figure 16.6
In Figure 16.6, assume that micro and macroeconomists must be paid the same wage because of comparable-worth laws. If the wage rate is $12, then:
A)there is a shortage of macroeconomists and a surplus of microeconomists.
B)there is a shortage of microeconomists and a surplus of macroeconomists.
C)there is a shortage of both macroeconomists and microeconomists.
D)there is a surplus of both macroeconomists and microeconomists.
E)the labor market for economists as a whole is in equilibrium.
Question
The figure given below shows the income-leisure trade off of an individual.Figure 16.5
AB and AC: Income constraints of the individual
I1, I2, and I3 curves show the income leisure choices of the individual.
Which of the following statements best defines the economics of the so-called superstar effect in the labor market?
A)This effect will result in cases in which individuals with large productivity differences receive vastly different compensation.
B)This effect occurs in cases in which individuals with small productivity differences receive very small differences in compensation.
C)This effect occurs when the firm hiring the superstar simply does not understand the term marginal-revenue product.
D)This effect occurs in cases in which individuals with small productivity differences receive vastly different compensation.
E)This effect usually occurs in industries in which a labor union has far-reaching powers.
AB and AC: Income constraints of the individualI1, I2, and I3 curves show the income leisure choices of the individual.
Which of the following statements best defines the economics of the so-called superstar effect in the labor market?
A)This effect will result in cases in which individuals with large productivity differences receive vastly different compensation.
B)This effect occurs in cases in which individuals with small productivity differences receive very small differences in compensation.
C)This effect occurs when the firm hiring the superstar simply does not understand the term marginal-revenue product.
D)This effect occurs in cases in which individuals with small productivity differences receive vastly different compensation.
E)This effect usually occurs in industries in which a labor union has far-reaching powers.
Question
The figure given below shows the income-leisure trade off of an individual.Figure 16.5
AB and AC: Income constraints of the individual
I1, I2, and I3 curves show the income leisure choices of the individual.
When people are separated into different jobs on the basis of sex, it is referred to as:
A)statistical discrimination.
B)employer prejudice.
C)worker prejudice.
D)occupational segregation.
E)occupational crowding.
AB and AC: Income constraints of the individualI1, I2, and I3 curves show the income leisure choices of the individual.
When people are separated into different jobs on the basis of sex, it is referred to as:
A)statistical discrimination.
B)employer prejudice.
C)worker prejudice.
D)occupational segregation.
E)occupational crowding.
Question
The figure given below shows the income-leisure trade off of an individual.Figure 16.5
AB and AC: Income constraints of the individual
I1, I2, and I3 curves show the income leisure choices of the individual.
If employers have imperfect information about job applicants, it may be rational for them to use:
A)employer prejudice.
B)worker prejudice.
C)consumer prejudice.
D)statistical discrimination.
E)occupational segregation.
AB and AC: Income constraints of the individualI1, I2, and I3 curves show the income leisure choices of the individual.
If employers have imperfect information about job applicants, it may be rational for them to use:
A)employer prejudice.
B)worker prejudice.
C)consumer prejudice.
D)statistical discrimination.
E)occupational segregation.
Question
The following figures show the demand (D) and supply (S) curves of micro and macro economists.Figure 16.6
In Figure 16.6, assume that the wage rates of the micro and the macro economists are determined by the aggregate demand and supply curves. The levels of employment for micro- and macro economists are _____ and _____ respectively:
A)100; 40.
B)100; 60.
C)90; 50.
D)100; 50.
E)110; 60
In Figure 16.6, assume that the wage rates of the micro and the macro economists are determined by the aggregate demand and supply curves. The levels of employment for micro- and macro economists are _____ and _____ respectively:
A)100; 40.
B)100; 60.
C)90; 50.
D)100; 50.
E)110; 60
Question
The figure given below shows the income-leisure trade off of an individual.Figure 16.5
AB and AC: Income constraints of the individual
I1, I2, and I3 curves show the income leisure choices of the individual.
Which of the following is not a reason for the wage differential between females and males?
A)The choice of major in college by females tends to be different than the choice by males.
B)The existence of employer prejudice leads to wage differential between males and females.
C)The number of males is usually greater than the number of females in the labor force.
D)Females bear the primary responsibility of childbearing.
E)Women accept lower wages for flexible and shorter working hours.
AB and AC: Income constraints of the individualI1, I2, and I3 curves show the income leisure choices of the individual.
Which of the following is not a reason for the wage differential between females and males?
A)The choice of major in college by females tends to be different than the choice by males.
B)The existence of employer prejudice leads to wage differential between males and females.
C)The number of males is usually greater than the number of females in the labor force.
D)Females bear the primary responsibility of childbearing.
E)Women accept lower wages for flexible and shorter working hours.
Question
The figure given below shows the income-leisure trade off of an individual.Figure 16.5
AB and AC: Income constraints of the individual
I1, I2, and I3 curves show the income leisure choices of the individual.
The Civil Rights Act of 1964 in the United States led to _____.
A)the introduction of the concept of discrimination.
B)complete elimination of discrimination from the labor force.
C)the creation of equal opportunities for men and women.
D)the creation of equal opportunities for the members of different races.
E)the establishment of a much clearer definition of discrimination.
AB and AC: Income constraints of the individualI1, I2, and I3 curves show the income leisure choices of the individual.
The Civil Rights Act of 1964 in the United States led to _____.
A)the introduction of the concept of discrimination.
B)complete elimination of discrimination from the labor force.
C)the creation of equal opportunities for men and women.
D)the creation of equal opportunities for the members of different races.
E)the establishment of a much clearer definition of discrimination.
Question
The figure given below shows the income-leisure trade off of an individual.Figure 16.5
AB and AC: Income constraints of the individual
I1, I2, and I3 curves show the income leisure choices of the individual.
Which of the following can result in occupational crowding?
A)Illegal immigration
B)Outsourcing of services
C)Consumer prejudices, superstitions, and religious taboos
D)Governmental policies and customs
E)Statistical discrimination and imperfect information
AB and AC: Income constraints of the individualI1, I2, and I3 curves show the income leisure choices of the individual.
Which of the following can result in occupational crowding?
A)Illegal immigration
B)Outsourcing of services
C)Consumer prejudices, superstitions, and religious taboos
D)Governmental policies and customs
E)Statistical discrimination and imperfect information
Question
The figure given below shows the income-leisure trade off of an individual.Figure 16.5
AB and AC: Income constraints of the individual
I1, I2, and I3 curves show the income leisure choices of the individual.
When people prefer to obtain medical, or legal services from white males, although they charge high prices for their services, it is termed as:
A)producer prejudice.
B)employer prejudice.
C)worker prejudice.
D)occupational segregation.
E)consumer prejudice.
AB and AC: Income constraints of the individualI1, I2, and I3 curves show the income leisure choices of the individual.
When people prefer to obtain medical, or legal services from white males, although they charge high prices for their services, it is termed as:
A)producer prejudice.
B)employer prejudice.
C)worker prejudice.
D)occupational segregation.
E)consumer prejudice.
Question
The figure given below shows the income-leisure trade off of an individual.Figure 16.5
AB and AC: Income constraints of the individual
I1, I2, and I3 curves show the income leisure choices of the individual.
The concept of comparable worth:
A)is that pay ought to be determined by job characteristics rather than by supply and demand.
B)is that pay ought to be determined by supply and demand rather than by job characteristics.
C)has made hiring practices much simpler for employers.
D)asserts that market-determined wages are the only appropriate way in which to allocate pay.
E)is easy to implement once a new worker has been hired.
AB and AC: Income constraints of the individualI1, I2, and I3 curves show the income leisure choices of the individual.
The concept of comparable worth:
A)is that pay ought to be determined by job characteristics rather than by supply and demand.
B)is that pay ought to be determined by supply and demand rather than by job characteristics.
C)has made hiring practices much simpler for employers.
D)asserts that market-determined wages are the only appropriate way in which to allocate pay.
E)is easy to implement once a new worker has been hired.
Question
The figure given below shows the income-leisure trade off of an individual.Figure 16.5
AB and AC: Income constraints of the individual
I1, I2, and I3 curves show the income leisure choices of the individual.
Which of the following reasons will most likely explain the occurrence of discrimination that is not related to personal prejudice?
A)A desire to avoid associating with certain groups of people
B)A lack of communication skills of workers seeking jobs
C)A lack of information
D)A lack of proper technical expertise
E)Too many people applying for the same job
AB and AC: Income constraints of the individualI1, I2, and I3 curves show the income leisure choices of the individual.
Which of the following reasons will most likely explain the occurrence of discrimination that is not related to personal prejudice?
A)A desire to avoid associating with certain groups of people
B)A lack of communication skills of workers seeking jobs
C)A lack of information
D)A lack of proper technical expertise
E)Too many people applying for the same job
Question
The figure given below shows the income-leisure trade off of an individual.Figure 16.5
AB and AC: Income constraints of the individual
I1, I2, and I3 curves show the income leisure choices of the individual.
Which of the following statements about employer prejudice is true?
A)It would be impossible for employer prejudice to exist in a firm that sells its output in a competitive market unless all rivals also discriminate.
B)Economic theory tells us that it would be impossible for employer prejudice to exist in a firm that is a monopoly.
C)Employer prejudice will help a monopolist to increase his profits by satisfying his managers personal prejudices.
D)Legislation has ended employer prejudice in the United States.
E)Employer prejudice occurs only in low-paying jobs.
AB and AC: Income constraints of the individualI1, I2, and I3 curves show the income leisure choices of the individual.
Which of the following statements about employer prejudice is true?
A)It would be impossible for employer prejudice to exist in a firm that sells its output in a competitive market unless all rivals also discriminate.
B)Economic theory tells us that it would be impossible for employer prejudice to exist in a firm that is a monopoly.
C)Employer prejudice will help a monopolist to increase his profits by satisfying his managers personal prejudices.
D)Legislation has ended employer prejudice in the United States.
E)Employer prejudice occurs only in low-paying jobs.
Question
The figure given below shows the income-leisure trade off of an individual.Figure 16.5
AB and AC: Income constraints of the individual
I1, I2, and I3 curves show the income leisure choices of the individual.
Reliance on indicators of productivity such as education, experience, and test scores may keep some very good people from getting a job and may result in hiring unproductive people. This is called:
A)worker prejudice.
B)statistical discrimination.
C)crowding out.
D)disparate treatment.
E)comparable worth.
AB and AC: Income constraints of the individualI1, I2, and I3 curves show the income leisure choices of the individual.
Reliance on indicators of productivity such as education, experience, and test scores may keep some very good people from getting a job and may result in hiring unproductive people. This is called:
A)worker prejudice.
B)statistical discrimination.
C)crowding out.
D)disparate treatment.
E)comparable worth.
Question
The following figures show the demand (D) and supply (S) curves of micro and macro economists.Figure 16.6
The principal argument against comparable worth is that:
A)men and women differ largely in terms of their productivities.
B)market does not function correctly and leads to inefficient allocation of resources.
C)market allocates scarce resources to their most valued use in the most efficient manner.
D)demand and supply do not allocate workers to where they are needed the most.
E)legislation by the government are often appropriate as it processes all the available information correctly.

Unlock Deck
Sign up to unlock the cards in this deck!
Unlock Deck
Unlock Deck
1/116
Play
Full screen (f)
Deck 16: The Labor Market
1
Scenario 14.1
A worker in Firm A earns an income of $5,000 per month. He has been offered a job in Firm B where he will be paid a salary of $7,000 per month.
Which of the following best explains the shape of the individual labor-supply curve?
A)The individual labor-supply curve is exactly like any supply curve, it always has a positive slope.
B)The individual labor-supply curve slopes downward at all wage rates because, as wages increase, people are able to buy more leisure.
C)The individual labor-supply curve slopes upward at lower wage rates and then bends back at higher wage rates.
D)The individual labor-supply curve must be vertical because each person can work only eight hours per day.
E)The individual labor-supply curve must be horizontal because labor markets are assumed to be perfectly competitive.
The individual labor-supply curve slopes upward at lower wage rates and then bends back at higher wage rates.
2
The figure below shows the supply curve for labor.Figure 16.1
Which of the following statements contradicts an upward-sloping market-supply curve?`
A)All people have backward-bending individual supply curves.
B)Leisure is more enjoyable than work.
C)The elasticity of labor supply is larger than the elasticity of labor demand.
D)To work more means to enjoy less leisure.
E)The opportunity cost of leisure decreases with an increase in wage rate.
All people have backward-bending individual supply curves.
3
The figure given below shows the demand curves (D1 and D2) and supply curves (S1 and S2) of labor in the labor market.Figure: 16.2
According to Figure 16.2, assume that the market is at an initial equilibrium in which the labor supply is S1 and the labor demand is D1. The labor supply curve shifts from S1 to S2 but the wage remains unchanged at its previous equilibrium level. Which of the following is true?
A)The economy is still in equilibrium.
B)There is a shortage of 20 workers.
C)There is a shortage of 30 workers.
D)There is a surplus of 30 workers.
E)There is a surplus of 20 workers.
There is a surplus of 20 workers.
4
The figure given below shows the demand curves (D1 and D2) and supply curves (S1 and S2) of labor in the labor market.Figure: 16.2
In Figure 16.2, the initial labor supply is S1 , and the labor demand is D1. If the wage rate is $6, which of the following is correct?
A)The actual wage is above the equilibrium wage.
B)There is a shortage of 30 workers.
C)There is a shortage of 20 workers.
D)There is a shortage of 10 workers.
E)The market is in equilibrium.
Unlock Deck
Unlock for access to all 116 flashcards in this deck.
Unlock Deck
k this deck
5
The figure below shows the supply curve for labor.Figure 16.1
The labor market is in equilibrium when:
A)the demand curve lies above the supply curve.
B)both demand and supply curves are positively sloped.
C)both demand and supply curves are negatively sloped.
D)the demand curve intersects the supply curve.
E)the demand curve is negatively sloped but the supply curve is positively sloped.
Unlock Deck
Unlock for access to all 116 flashcards in this deck.
Unlock Deck
k this deck
6
Scenario 14.1
A worker in Firm A earns an income of $5,000 per month. He has been offered a job in Firm B where he will be paid a salary of $7,000 per month.
It is said that a wage increase can have two opposing effects. Which of the following captures these two effects?
A)A backward-bending labor-supply curve
B)A perfectly elastic labor-supply curve
C)A perfectly inelastic labor-supply curve
D)A perfectly elastic labor-demand curve
E)A backward-bending labor-demand curve
Unlock Deck
Unlock for access to all 116 flashcards in this deck.
Unlock Deck
k this deck
7
Scenario 14.1
A worker in Firm A earns an income of $5,000 per month. He has been offered a job in Firm B where he will be paid a salary of $7,000 per month.
Which of the following is true?
A)A person's wage or salary is his or her opportunity cost of leisure.
B)Any time that is spent working for a paid job is known as the time spent in leisure.
C)An individual's decision to work in a low paying job or a high paying job is known as the labor-leisure tradeoff.
D)A person who works more also always get to enjoy more leisure time.
E)If an individual labor supply curve bends backward at some high wage, then the market supply curve also bends backward.
Unlock Deck
Unlock for access to all 116 flashcards in this deck.
Unlock Deck
k this deck
8
The figure below shows the supply curve for labor.Figure 16.1
Refer to Figure 16.1. When wage rate increases from W2 to W3, then the:
A)quantity of labor supplied increases from Q2 to Q3.
B)quantity of labor supplied decreases from Q3 to Q4.
C)quantity of labor supplied increases from Q4 to Q5.
D)quantity of labor supplied increases from Q2 to Q4.
E)quantity of labor supplied increases from Q3 to Q5.
Unlock Deck
Unlock for access to all 116 flashcards in this deck.
Unlock Deck
k this deck
9
The figure below shows the supply curve for labor.Figure 16.1
The labor demand curve is based on the firm's:
A)average revenue curve.
B)marginal product curve.
C)marginal cost curve.
D)average cost curve.
E)marginal revenue product curve.
The labor demand curve is based on the firm's:
A)average revenue curve.
B)marginal product curve.
C)marginal cost curve.
D)average cost curve.
E)marginal revenue product curve.
Unlock Deck
Unlock for access to all 116 flashcards in this deck.
Unlock Deck
k this deck
10
Scenario 14.1
A worker in Firm A earns an income of $5,000 per month. He has been offered a job in Firm B where he will be paid a salary of $7,000 per month.
Which of the following statements is true?
A)Leisure only includes the time that a person spends socializing.
B)Standing in a queue at a bank is not considered leisure.
C)If someone enjoys his or her job, then the time he or she spends at work is considered leisure.
D)Leisure will always decrease as a person's wage increases.
E)Leisure includes the time that a person spends away from a paying job, regardless of how this time is spent.
Unlock Deck
Unlock for access to all 116 flashcards in this deck.
Unlock Deck
k this deck
11
The figure given below shows the demand curves (D1 and D2) and supply curves (S1 and S2) of labor in the labor market.Figure: 16.2
Which of the following is not a reason for compensating wage differentials?
A)The risk involved in certain jobs
B)An excess supply of workers in some industries
C)A high probability of staying away from home
D)To attract more laborers in risky professions
E)Unpleasant working consditions
Which of the following is not a reason for compensating wage differentials?
A)The risk involved in certain jobs
B)An excess supply of workers in some industries
C)A high probability of staying away from home
D)To attract more laborers in risky professions
E)Unpleasant working consditions
Unlock Deck
Unlock for access to all 116 flashcards in this deck.
Unlock Deck
k this deck
12
The figure below shows the supply curve for labor.Figure 16.1
Why is the market supply curve of labor positively sloped though individual supply curves are backward-bending beyond a certain wage rate?
A)People tend to work less when wage rate increases.
B)Every individual laborer has equal trade offs between labor and leisure.
C)People tend to substitute labor for leisure.
D)People work more for the fear of losing their jobs and becoming unemployed.
E)All the individual supply curves do not bend backward at one particular wage rate.
Unlock Deck
Unlock for access to all 116 flashcards in this deck.
Unlock Deck
k this deck
13
The figure below shows the supply curve for labor.Figure 16.1
The marginal revenue product is:
A)the value of all the final goods and services produced by a firm.
B)the value that an worker contributes to a firm.
C)an increase in the profit of a firm with an increase in the output by one unit.
D)the output per unit of worker employed by a firm.
E)the value that all the unskilled workers contribute to a firm.
Unlock Deck
Unlock for access to all 116 flashcards in this deck.
Unlock Deck
k this deck
14
The figure given below shows the demand curves (D1 and D2) and supply curves (S1 and S2) of labor in the labor market.Figure: 16.2
The term compensating wage differential refers to:
A)the bargaining capacity of a monoposonist in the labor market.
B)the wage differences that arise from differences in the risk involved in different jobs.
C)the criteria on which a firm offers a 401K plan to all its employees or just some employees.
D)the wage differences that arise from difference in productivity of the workers in a firm.
E)the negotiating power of the trade union.
Unlock Deck
Unlock for access to all 116 flashcards in this deck.
Unlock Deck
k this deck
15
Scenario 14.1
A worker in Firm A earns an income of $5,000 per month. He has been offered a job in Firm B where he will be paid a salary of $7,000 per month.
Which of the following is a reason that some economists do not agree with the concept of a labor-leisure tradeoff?
A)Wages are paid in dollars and leisure is measured in time, hence there is no way to compare the two.
B)On a day-to-day basis, most jobs do not have the flexibility to allow people to weigh the benefits and costs to determine how much they should work that day.
C)In the long-run, the supply of labor hours is perfectly inelastic.
D)An increase in the wage rate always leads to an increase in the supply of labor hours, therefore the workers do not think of choosing leisure over labor.
E)Some people do not work at all, so there is no labor-leisure tradeoff for those individuals.
Unlock Deck
Unlock for access to all 116 flashcards in this deck.
Unlock Deck
k this deck
16
The figure below shows the supply curve for labor.Figure 16.1
As the wage rate increases, the quantity of labor supplied by an individual worker will:
A)invariably increase
B)invariably decrease.
C)first increase and then decrease.
D)first decrease and then increase.
E)remain constant.
As the wage rate increases, the quantity of labor supplied by an individual worker will:
A)invariably increase
B)invariably decrease.
C)first increase and then decrease.
D)first decrease and then increase.
E)remain constant.
Unlock Deck
Unlock for access to all 116 flashcards in this deck.
Unlock Deck
k this deck
17
The figure below shows the supply curve for labor.Figure 16.1
Why does the labor market have more than one equilibrium wage rate?
A)Workers differ in their productivities.
B)Productivity of workers increases initially but later declines.
C)The labor demand curve is backward bending.
D)Marginal revenue product of different inputs used by firms vary.
E)Employers compete among themselves to hire the best workers.
Unlock Deck
Unlock for access to all 116 flashcards in this deck.
Unlock Deck
k this deck
18
The figure given below shows the demand curves (D1 and D2) and supply curves (S1 and S2) of labor in the labor market.Figure: 16.2
Refer to Figure 16.2. At the initial equilibrium (when demand is D1 and supply is S1), the firm employs _____ laborers at a wage of _____.
A)20; $7
B)30; $8
C)50; $6
D)20; $5
E)10; $5
Refer to Figure 16.2. At the initial equilibrium (when demand is D1 and supply is S1), the firm employs _____ laborers at a wage of _____.
A)20; $7
B)30; $8
C)50; $6
D)20; $5
E)10; $5
Unlock Deck
Unlock for access to all 116 flashcards in this deck.
Unlock Deck
k this deck
19
The figure given below shows the demand curves (D1 and D2) and supply curves (S1 and S2) of labor in the labor market.Figure: 16.2
Which of the following professionals is likely to receive higher compensatory wages?
A)Financial accountants
B)Software engineers
C)Sales workers
D)Share traders
E)Tailors
Which of the following professionals is likely to receive higher compensatory wages?
A)Financial accountants
B)Software engineers
C)Sales workers
D)Share traders
E)Tailors
Unlock Deck
Unlock for access to all 116 flashcards in this deck.
Unlock Deck
k this deck
20
The figure below shows the supply curve for labor.Figure 16.1
Refer to Figure 16.1. When wage rate increases from W3 to W5, then the:
A)quantity of labor supplied increases from Q1to Q4.
B)quantity of labor supplied decreases from Q5 to Q2.
C)quantity of labor supplied increases from Q2 to Q4.
D)quantity of labor supplied decreases from Q4 to Q2.
E)quantity of labor supplied increases from Q1 to Q54.
Unlock Deck
Unlock for access to all 116 flashcards in this deck.
Unlock Deck
k this deck
21
The figures given below show the demand (D)and supply (S) curves of labor in two different markets.Figure 16.3
Which of the following refers to human capital?
A)Money spent by business to acquire labor
B)The acquired skill and productivity of workers
C)The plant and equipment used with labor
D)Money spent on purchasing the latest machinery
E)Money that workers save
Which of the following refers to human capital?
A)Money spent by business to acquire labor
B)The acquired skill and productivity of workers
C)The plant and equipment used with labor
D)Money spent on purchasing the latest machinery
E)Money that workers save
Unlock Deck
Unlock for access to all 116 flashcards in this deck.
Unlock Deck
k this deck
22
The figures given below show the demand (D)and supply (S) curves of labor in two different markets.Figure 16.3
Refer to Figure 16.3. If the wage rates in market A and market B were set at $15, then:
A)there would be a shortage of workers in both markets.
B)there would be a surplus of workers in both markets.
C)there would be a shortage of workers in market A and a surplus of workers in market B.
D)there would be a shortage of workers in market B and a surplus of workers in market A.
E)both the markets will be in equilibrium.
Unlock Deck
Unlock for access to all 116 flashcards in this deck.
Unlock Deck
k this deck
23
The figures given below show the demand (D)and supply (S) curves of labor in two different markets.Figure 16.3
A college student's choice of a major and an occupation reflects:
A)each college student's future expectation of wage inflation.
B)a lack of information on the part of the students.
C)a lack of proper education and vocational training.
D)the return on investment in human capital.
E)the opportunity costs each college student faces.
Unlock Deck
Unlock for access to all 116 flashcards in this deck.
Unlock Deck
k this deck
24
The figure given below shows the demand curve in the U.S. and the cost curves in U.S. and India.Figure: 16.4
In the figure:
MC: Marginal cost curve
ATC: Average total cost curve
D: Demand curve in the U.S.MR: Marginal revenue curve in the U.S.
In Figure 16.4, the price and quantity of the good if produced by India would be _____ and _____ respectively.
A)P3; Q3
B)P4; Q4
C)P1; Q1
D)P5; Q5
E)P2; Q2
In the figure:MC: Marginal cost curve
ATC: Average total cost curve
D: Demand curve in the U.S.MR: Marginal revenue curve in the U.S.
In Figure 16.4, the price and quantity of the good if produced by India would be _____ and _____ respectively.
A)P3; Q3
B)P4; Q4
C)P1; Q1
D)P5; Q5
E)P2; Q2
Unlock Deck
Unlock for access to all 116 flashcards in this deck.
Unlock Deck
k this deck
25
The figures given below show the demand (D)and supply (S) curves of labor in two different markets.Figure 16.3
Why are a large number of IT jobs being outsourced to China and India?
A)India and China experience large balance of payment deficits.
B)India and China are highly capital intensive economies.
C)India and China have abundant supply of cheap skilled labor.
D)India and China offers the best working conditions for the employees.
E)India and China experiences balance of payment surpluses.
Unlock Deck
Unlock for access to all 116 flashcards in this deck.
Unlock Deck
k this deck
26
The figures given below show the demand (D)and supply (S) curves of labor in two different markets.Figure 16.3
Refer to Figure 16.3. If the wage rates in market A and market B were set at $20, then:
A)both the markets would be in equilibrium.
B)there would be a shortage of workers in market A and a surplus of workers in market B.
C)there would be a shortage of workers in market B and a surplus of workers in market A.
D)there would be a surplus of workers in both markets.
E)there would be a shortage of workers in both markets.
Unlock Deck
Unlock for access to all 116 flashcards in this deck.
Unlock Deck
k this deck
27
The figure given below shows the demand curve in the U.S. and the cost curves in U.S. and India.Figure: 16.4
In the figure:
MC: Marginal cost curve
ATC: Average total cost curve
D: Demand curve in the U.S.MR: Marginal revenue curve in the U.S.
According to Figure 16.4, one of the possible outcomes of such offshoring is that:
A)the price of the good in question rises in the U.S. market.
B)the demand for Indian worker declines.
C)the demand for U.S. workers increase.
D)the price of the good in question rises in the Indian market.
E)the Indian workers replace the U.S. workers.
In the figure:MC: Marginal cost curve
ATC: Average total cost curve
D: Demand curve in the U.S.MR: Marginal revenue curve in the U.S.
According to Figure 16.4, one of the possible outcomes of such offshoring is that:
A)the price of the good in question rises in the U.S. market.
B)the demand for Indian worker declines.
C)the demand for U.S. workers increase.
D)the price of the good in question rises in the Indian market.
E)the Indian workers replace the U.S. workers.
Unlock Deck
Unlock for access to all 116 flashcards in this deck.
Unlock Deck
k this deck
28
The figures given below show the demand (D)and supply (S) curves of labor in two different markets.Figure 16.3
Which of the following statements is true?
A)Income earned by a worker with a college degree grows more rapidly than a worker without a college degree during their early working years.
B)A worker with a college degree always earns less than a worker without a college degree.
C)A worker with a college degree always earns more than a worker without a college degree.
D)A worker without a college degree initially earns more than a worker with a college degree but the latter surpasses the former in due course of time.
E)Both the workers earn equal incomes after a certain period of time.
Unlock Deck
Unlock for access to all 116 flashcards in this deck.
Unlock Deck
k this deck
29
The figures given below show the demand (D)and supply (S) curves of labor in two different markets.Figure 16.3
Which of the following is a reason for the wage differential shown in Figure 16.3?
A)The workers in Market B are more productive than the workers in Market A.
B)The workers in Market B are unionized whereas the workers in Market A are not.
C)Market B hires a larger number of skilled workers than Market A.
D)Market A represents the market for a risky occupation.
E)Working conditions offered by the firms in Market B are uncongenial.
Unlock Deck
Unlock for access to all 116 flashcards in this deck.
Unlock Deck
k this deck
30
The figures given below show the demand (D)and supply (S) curves of labor in two different markets.Figure 16.3
The ratio of the median income of college-to high school-educated workers is called the _____.
A)college income premium
B)college income differential
C)college income benefit
D)college income compensation
E)education income gap
The ratio of the median income of college-to high school-educated workers is called the _____.
A)college income premium
B)college income differential
C)college income benefit
D)college income compensation
E)education income gap
Unlock Deck
Unlock for access to all 116 flashcards in this deck.
Unlock Deck
k this deck
31
The figures given below show the demand (D)and supply (S) curves of labor in two different markets.Figure 16.3
Investment in human capital implies:
A)investment on machines, technological development, and equipments.
B)expenses on education.
C)expenses on paying interest for hiring real capital.
D)expenses on the purchase of land.
E)profit of the entrepreneurs.
Investment in human capital implies:
A)investment on machines, technological development, and equipments.
B)expenses on education.
C)expenses on paying interest for hiring real capital.
D)expenses on the purchase of land.
E)profit of the entrepreneurs.
Unlock Deck
Unlock for access to all 116 flashcards in this deck.
Unlock Deck
k this deck
32
The figures given below show the demand (D)and supply (S) curves of labor in two different markets.Figure 16.3
From Figure 16.3, calculate the amount of the wage differential.
A)$6
B)$18
C)$2
D)$20
E)$15
From Figure 16.3, calculate the amount of the wage differential.
A)$6
B)$18
C)$2
D)$20
E)$15
Unlock Deck
Unlock for access to all 116 flashcards in this deck.
Unlock Deck
k this deck
33
The figures given below show the demand (D)and supply (S) curves of labor in two different markets.Figure 16.3
Why do skilled workers earn relatively higher wages than unskilled workers?
A)The marginal productivity of skilled workers is low.
B)The marginal cost of hiring skilled workers is low.
C)The supply of skilled workers is relatively less.
D)There is an abundant supply of skilled workers.
E)The marginal cost of hiring unskilled workers is high.
Unlock Deck
Unlock for access to all 116 flashcards in this deck.
Unlock Deck
k this deck
34
The figures given below show the demand (D)and supply (S) curves of labor in two different markets.Figure 16.3
Outsourcing refers to the process in which:
A)a firm purchases service from another firm in another country.
B)a firm hires laborers from a foreign market.
C)the government of a country works toward providing social security and other rights to migrant workers.
D)a firm purchases service from another firm.
E) workers of a particular country seek employment in a firm of a foreign country.
Unlock Deck
Unlock for access to all 116 flashcards in this deck.
Unlock Deck
k this deck
35
The figure given below shows the demand curve in the U.S. and the cost curves in U.S. and India.Figure: 16.4
In the figure:
MC: Marginal cost curve
ATC: Average total cost curve
D: Demand curve in the U.S.MR: Marginal revenue curve in the U.S.
According to Figure 16.4, the price and quantity of the good if produced by the U.S. would be _____ and _____ respectively.
A)P1; Q1
B)P3; Q3
C)P2; Q4
D)P2; Q2
E)P4; Q4
In the figure:MC: Marginal cost curve
ATC: Average total cost curve
D: Demand curve in the U.S.MR: Marginal revenue curve in the U.S.
According to Figure 16.4, the price and quantity of the good if produced by the U.S. would be _____ and _____ respectively.
A)P1; Q1
B)P3; Q3
C)P2; Q4
D)P2; Q2
E)P4; Q4
Unlock Deck
Unlock for access to all 116 flashcards in this deck.
Unlock Deck
k this deck
36
The figures given below show the demand (D)and supply (S) curves of labor in two different markets.Figure 16.3
Which of the following is a major impact of offshoring?
A)Elimination of domestic jobs
B)Elimination of jobs in foreign countries
C)Creation of jobs in the domestic country
D)An increase in the cost of production of domestic firms
E)A reduction in the cost of production of foreign firms
Which of the following is a major impact of offshoring?
A)Elimination of domestic jobs
B)Elimination of jobs in foreign countries
C)Creation of jobs in the domestic country
D)An increase in the cost of production of domestic firms
E)A reduction in the cost of production of foreign firms
Unlock Deck
Unlock for access to all 116 flashcards in this deck.
Unlock Deck
k this deck
37
The figures given below show the demand (D)and supply (S) curves of labor in two different markets.Figure 16.3
If the supply of skilled workers is increased such that it is equal to the supply of unskilled workers, we can expect:
A)wages of skilled workers to be equal to wages of unskilled workers.
B)wages of skilled workers to be lower than wages of unskilled workers.
C)wages of skilled workers to be higher than wages of unskilled workers.
D)wages of unskilled workers to fall from its current level.
E)wages of both skilled and unskilled workers to remain unaffected.
Unlock Deck
Unlock for access to all 116 flashcards in this deck.
Unlock Deck
k this deck
38
The figures given below show the demand (D)and supply (S) curves of labor in two different markets.Figure 16.3
Offshoring refers to the the process in which:
A)a firm hires laborers from a foreign market.
B)a firm purchases service from another firm.
C)a firm purchases service from another firm in another country.
D)workers of a particular country seek employment in a firm of a foreign country.
E)the government of a country works toward providing social security and other rights to migrant workers.
Unlock Deck
Unlock for access to all 116 flashcards in this deck.
Unlock Deck
k this deck
39
The figures given below show the demand (D)and supply (S) curves of labor in two different markets.Figure 16.3
A large number of U.S. firms send jobs to low-wage nations as it enables them to:
A)raise the price of their products.
B)reduce their cost of production.
C)get better quality products.
D)obtain diversified products.
E)politically dominate the economies where they are offshoring.
A large number of U.S. firms send jobs to low-wage nations as it enables them to:
A)raise the price of their products.
B)reduce their cost of production.
C)get better quality products.
D)obtain diversified products.
E)politically dominate the economies where they are offshoring.
Unlock Deck
Unlock for access to all 116 flashcards in this deck.
Unlock Deck
k this deck
40
The figures given below show the demand (D)and supply (S) curves of labor in two different markets.Figure 16.3
An individual is induced to change his/her occupation if:
A)the sunk cost of the current occupation is high.
B)the expected net gains from the alternative occupation is negative.
C)the outlook for future income, in the current occupation, increases.
D)he/she has devoted a lot of money, time and effort in the current occupation.
E)the marginal cost of remaining in the current occupation is very high.
Unlock Deck
Unlock for access to all 116 flashcards in this deck.
Unlock Deck
k this deck
41
The figure given below shows the income-leisure trade off of an individual.Figure 16.5
AB and AC: Income constraints of the individual
I1, I2, and I3 curves show the income leisure choices of the individual.
Which of the following are benefits created by the immigrants?
A)Increase in educational expenditures on public schools for their children
B)Increase in the wages of unskilled laborers
C)Reduction in costs for some firms
D)Increased expenditures on health care for illegal immigrants at emergency clinics and hospitals
E)Increase in the wages of skilled workers
AB and AC: Income constraints of the individualI1, I2, and I3 curves show the income leisure choices of the individual.
Which of the following are benefits created by the immigrants?
A)Increase in educational expenditures on public schools for their children
B)Increase in the wages of unskilled laborers
C)Reduction in costs for some firms
D)Increased expenditures on health care for illegal immigrants at emergency clinics and hospitals
E)Increase in the wages of skilled workers
Unlock Deck
Unlock for access to all 116 flashcards in this deck.
Unlock Deck
k this deck
42
The figure given below shows the income-leisure trade off of an individual.Figure 16.5
AB and AC: Income constraints of the individual
I1, I2, and I3 curves show the income leisure choices of the individual.
A regressive tax structure is one:
A)in which the tax increases as the base increases.
B)in which the tax rate remains the same as the base increases.
C)that tends to discourage additional work as income rises.
D)that is famous and in use in the U.S.
E)in which the tax rate increases as the base increases.
AB and AC: Income constraints of the individualI1, I2, and I3 curves show the income leisure choices of the individual.
A regressive tax structure is one:
A)in which the tax increases as the base increases.
B)in which the tax rate remains the same as the base increases.
C)that tends to discourage additional work as income rises.
D)that is famous and in use in the U.S.
E)in which the tax rate increases as the base increases.
Unlock Deck
Unlock for access to all 116 flashcards in this deck.
Unlock Deck
k this deck
43
The figure given below shows the income-leisure trade off of an individual.Figure 16.5
AB and AC: Income constraints of the individual
I1, I2, and I3 curves show the income leisure choices of the individual.
For economists, discrimination is difficult to rationalize because:
A)it is costly to those who discriminate.
B)the firms can actually reap greater profits by discriminating between their workers.
C)in a freely functioning labor market, there is no such thing as discrimination.
D)economists know that in the real world, personal prejudices do not exist.
E)wages will not be allowed to fall below their natural equilibrium rate.
AB and AC: Income constraints of the individualI1, I2, and I3 curves show the income leisure choices of the individual.
For economists, discrimination is difficult to rationalize because:
A)it is costly to those who discriminate.
B)the firms can actually reap greater profits by discriminating between their workers.
C)in a freely functioning labor market, there is no such thing as discrimination.
D)economists know that in the real world, personal prejudices do not exist.
E)wages will not be allowed to fall below their natural equilibrium rate.
Unlock Deck
Unlock for access to all 116 flashcards in this deck.
Unlock Deck
k this deck
44
The figure given below shows the demand curve in the U.S. and the cost curves in U.S. and India.Figure: 16.4
In the figure:
MC: Marginal cost curve
ATC: Average total cost curve
D: Demand curve in the U.S.MR: Marginal revenue curve in the U.S.
The burden of a tax is mainly borne by the buyer if:
A)the supply of the good is perfectly price elastic.
B)the supply of the good is relatively price elastic.
C)the demand for the good is relatively price elastic.
D)the demand for the good is relatively price inelastic.
E)the demand for the good is perfectly price elastic.
In the figure:MC: Marginal cost curve
ATC: Average total cost curve
D: Demand curve in the U.S.MR: Marginal revenue curve in the U.S.
The burden of a tax is mainly borne by the buyer if:
A)the supply of the good is perfectly price elastic.
B)the supply of the good is relatively price elastic.
C)the demand for the good is relatively price elastic.
D)the demand for the good is relatively price inelastic.
E)the demand for the good is perfectly price elastic.
Unlock Deck
Unlock for access to all 116 flashcards in this deck.
Unlock Deck
k this deck
45
The figure given below shows the income-leisure trade off of an individual.Figure 16.5
AB and AC: Income constraints of the individual
I1, I2, and I3 curves show the income leisure choices of the individual.
With illegal immigration the unskilled labor supply curve:
A)shifts to the left.
B)becomes perfectly inelastic.
C)becomes perfectly elastic.
D)shifts to the right.
E)becomes non-existent.
AB and AC: Income constraints of the individualI1, I2, and I3 curves show the income leisure choices of the individual.
With illegal immigration the unskilled labor supply curve:
A)shifts to the left.
B)becomes perfectly inelastic.
C)becomes perfectly elastic.
D)shifts to the right.
E)becomes non-existent.
Unlock Deck
Unlock for access to all 116 flashcards in this deck.
Unlock Deck
k this deck
46
The figure given below shows the income-leisure trade off of an individual.Figure 16.5
AB and AC: Income constraints of the individual
I1, I2, and I3 curves show the income leisure choices of the individual.
The greatest number of recent immigrants to the U.S. come from Mexico because of:
A)political insecurity in Mexico.
B)religious insecurity in Mexico.
C)proximity and wage differentials.
D)racial discrimination in Mexico.
E)greater social security in the United States.
AB and AC: Income constraints of the individualI1, I2, and I3 curves show the income leisure choices of the individual.
The greatest number of recent immigrants to the U.S. come from Mexico because of:
A)political insecurity in Mexico.
B)religious insecurity in Mexico.
C)proximity and wage differentials.
D)racial discrimination in Mexico.
E)greater social security in the United States.
Unlock Deck
Unlock for access to all 116 flashcards in this deck.
Unlock Deck
k this deck
47
The figure given below shows the income-leisure trade off of an individual.Figure 16.5
AB and AC: Income constraints of the individual
I1, I2, and I3 curves show the income leisure choices of the individual.
Which of the following factors is likely to be responsible for the inward rotation of the income constraint from AB to AC, in Figure 16.5?
A)An increase in income
B)An increase in demand for labor
C)An increase in the income tax rate
D)A decrease in the opportunity cost of labor
E)A decrease in the supply of labor
AB and AC: Income constraints of the individualI1, I2, and I3 curves show the income leisure choices of the individual.
Which of the following factors is likely to be responsible for the inward rotation of the income constraint from AB to AC, in Figure 16.5?
A)An increase in income
B)An increase in demand for labor
C)An increase in the income tax rate
D)A decrease in the opportunity cost of labor
E)A decrease in the supply of labor
Unlock Deck
Unlock for access to all 116 flashcards in this deck.
Unlock Deck
k this deck
48
The figure given below shows the income-leisure trade off of an individual.Figure 16.5
AB and AC: Income constraints of the individual
I1, I2, and I3 curves show the income leisure choices of the individual.
Which of the following is an impact of the restriction on immigration on the domestic firms?
A)The domestic firms would produce more and reap greater profits.
B)The domestic firms would hire more unskilled laborers at lower wages.
C)The domestic firms would charge low prices for their products.
D)The domestic firms would have to pay higher wages and make less profit.
E)The domestic firms would make above normal profits in the long run.
AB and AC: Income constraints of the individualI1, I2, and I3 curves show the income leisure choices of the individual.
Which of the following is an impact of the restriction on immigration on the domestic firms?
A)The domestic firms would produce more and reap greater profits.
B)The domestic firms would hire more unskilled laborers at lower wages.
C)The domestic firms would charge low prices for their products.
D)The domestic firms would have to pay higher wages and make less profit.
E)The domestic firms would make above normal profits in the long run.
Unlock Deck
Unlock for access to all 116 flashcards in this deck.
Unlock Deck
k this deck
49
The figure given below shows the income-leisure trade off of an individual.Figure 16.5
AB and AC: Income constraints of the individual
I1, I2, and I3 curves show the income leisure choices of the individual.
In Figure 16.5, if the income constraint of the individual is given by the line AC, he maximizes his utility by choosing _____ hours of leisure and _____ units of income.
A)L1; Y5
B)0; Y7
C)L3; Y3
D)L2; Y3
E)L4; Y4
AB and AC: Income constraints of the individualI1, I2, and I3 curves show the income leisure choices of the individual.
In Figure 16.5, if the income constraint of the individual is given by the line AC, he maximizes his utility by choosing _____ hours of leisure and _____ units of income.
A)L1; Y5
B)0; Y7
C)L3; Y3
D)L2; Y3
E)L4; Y4
Unlock Deck
Unlock for access to all 116 flashcards in this deck.
Unlock Deck
k this deck
50
The figure given below shows the income-leisure trade off of an individual.Figure 16.5
AB and AC: Income constraints of the individual
I1, I2, and I3 curves show the income leisure choices of the individual.
According to the U.S. population surveys conducted by the census, since 1980 the total foreign-born population as a percentage of the total U.S. population:
A)has not changed.
B)has declined.
C)has risen.
D)has been stable.
E)has fallen to zero.
AB and AC: Income constraints of the individualI1, I2, and I3 curves show the income leisure choices of the individual.
According to the U.S. population surveys conducted by the census, since 1980 the total foreign-born population as a percentage of the total U.S. population:
A)has not changed.
B)has declined.
C)has risen.
D)has been stable.
E)has fallen to zero.
Unlock Deck
Unlock for access to all 116 flashcards in this deck.
Unlock Deck
k this deck
51
The figure given below shows the income-leisure trade off of an individual.Figure 16.5
AB and AC: Income constraints of the individual
I1, I2, and I3 curves show the income leisure choices of the individual.
Which of the following is not a cost of illegal immigration in the U.S.?
A)The adverse impact on unskilled workers
B)The damage to national property caused during the process of immigration
C)Additional expenditure on healthcare at emergency clinics and hospitals
D)Expenditure on public education on the children of immigrants.
E)Expenditure on employment insurance programs for the illegal immigrants.
AB and AC: Income constraints of the individualI1, I2, and I3 curves show the income leisure choices of the individual.
Which of the following is not a cost of illegal immigration in the U.S.?
A)The adverse impact on unskilled workers
B)The damage to national property caused during the process of immigration
C)Additional expenditure on healthcare at emergency clinics and hospitals
D)Expenditure on public education on the children of immigrants.
E)Expenditure on employment insurance programs for the illegal immigrants.
Unlock Deck
Unlock for access to all 116 flashcards in this deck.
Unlock Deck
k this deck
52
The figure given below shows the income-leisure trade off of an individual.Figure 16.5
AB and AC: Income constraints of the individual
I1, I2, and I3 curves show the income leisure choices of the individual.
If the tax rate increases with an increase in income, the income tax structure is said to be _____.
A)proportional
B)regressive
C)progressive
D)lump-sum
E)negatively skewed
AB and AC: Income constraints of the individualI1, I2, and I3 curves show the income leisure choices of the individual.
If the tax rate increases with an increase in income, the income tax structure is said to be _____.
A)proportional
B)regressive
C)progressive
D)lump-sum
E)negatively skewed
Unlock Deck
Unlock for access to all 116 flashcards in this deck.
Unlock Deck
k this deck
53
The figure given below shows the income-leisure trade off of an individual.Figure 16.5
AB and AC: Income constraints of the individual
I1, I2, and I3 curves show the income leisure choices of the individual.
In Figure 16.5, if the income constraint of the individual is given by the line AB, he maximizes his utility by choosing _____ hours of leisure and earns an income of _____.
A)0; Y2
B)L1; Y7
C)L2; Y5
D)L3; Y4
E)L4; Y7
AB and AC: Income constraints of the individualI1, I2, and I3 curves show the income leisure choices of the individual.
In Figure 16.5, if the income constraint of the individual is given by the line AB, he maximizes his utility by choosing _____ hours of leisure and earns an income of _____.
A)0; Y2
B)L1; Y7
C)L2; Y5
D)L3; Y4
E)L4; Y7
Unlock Deck
Unlock for access to all 116 flashcards in this deck.
Unlock Deck
k this deck
54
The figure given below shows the income-leisure trade off of an individual.Figure 16.5
AB and AC: Income constraints of the individual
I1, I2, and I3 curves show the income leisure choices of the individual.
One of the major impacts of restricting immigration is that the:
A)prices of the products produced by unskilled laborers will decline.
B)prices of the products produced by unskilled labor will increase.
C)supply of labor in agriculture will increase.
D)supply of labor in the industrial sector will rise.
E)government's expenditure on education and health will rise.
AB and AC: Income constraints of the individualI1, I2, and I3 curves show the income leisure choices of the individual.
One of the major impacts of restricting immigration is that the:
A)prices of the products produced by unskilled laborers will decline.
B)prices of the products produced by unskilled labor will increase.
C)supply of labor in agriculture will increase.
D)supply of labor in the industrial sector will rise.
E)government's expenditure on education and health will rise.
Unlock Deck
Unlock for access to all 116 flashcards in this deck.
Unlock Deck
k this deck
55
The figure given below shows the income-leisure trade off of an individual.Figure 16.5
AB and AC: Income constraints of the individual
I1, I2, and I3 curves show the income leisure choices of the individual.
Which of the following is true of illegal immigrants?
A)They help improve the quality of goods and services produced in the United States.
B)They help increase the wage rate in the U.S.
C)They do not affect the equilibrium wage of the U.S. unskilled labor market.
D)They help some firms lower operating costs, earn more profit, and produce more.
E)They reduce the supply of unskilled labor in the United States.
AB and AC: Income constraints of the individualI1, I2, and I3 curves show the income leisure choices of the individual.
Which of the following is true of illegal immigrants?
A)They help improve the quality of goods and services produced in the United States.
B)They help increase the wage rate in the U.S.
C)They do not affect the equilibrium wage of the U.S. unskilled labor market.
D)They help some firms lower operating costs, earn more profit, and produce more.
E)They reduce the supply of unskilled labor in the United States.
Unlock Deck
Unlock for access to all 116 flashcards in this deck.
Unlock Deck
k this deck
56
The figure given below shows the demand curve in the U.S. and the cost curves in U.S. and India.Figure: 16.4
In the figure:
MC: Marginal cost curve
ATC: Average total cost curve
D: Demand curve in the U.S.MR: Marginal revenue curve in the U.S.
An increase in the income tax rates:
A)makes the labor supply curve more inelastic.
B)increases the opportunity cost of leisure.
C)lowers the opportunity cost of leisure.
D)shifts the labor supply curve to the right.
E)shifts the labor demand curve to the right.
In the figure:MC: Marginal cost curve
ATC: Average total cost curve
D: Demand curve in the U.S.MR: Marginal revenue curve in the U.S.
An increase in the income tax rates:
A)makes the labor supply curve more inelastic.
B)increases the opportunity cost of leisure.
C)lowers the opportunity cost of leisure.
D)shifts the labor supply curve to the right.
E)shifts the labor demand curve to the right.
Unlock Deck
Unlock for access to all 116 flashcards in this deck.
Unlock Deck
k this deck
57
The figure given below shows the demand curve in the U.S. and the cost curves in U.S. and India.Figure: 16.4
In the figure:
MC: Marginal cost curve
ATC: Average total cost curve
D: Demand curve in the U.S.MR: Marginal revenue curve in the U.S.
Why has there been an increase in the inequality of income?
A)The demand for skilled workers has declined.
B)The demand for skilled workers has remained constant and the demand for unskilled workers has declined.
C)The government policies went against the unskilled workers.
D)The demand for skilled workers has increased and the demand for unskilled workers has not kept pace.
E)The demand for unskilled workers has increased as they could be hired for lower wages.
In the figure:MC: Marginal cost curve
ATC: Average total cost curve
D: Demand curve in the U.S.MR: Marginal revenue curve in the U.S.
Why has there been an increase in the inequality of income?
A)The demand for skilled workers has declined.
B)The demand for skilled workers has remained constant and the demand for unskilled workers has declined.
C)The government policies went against the unskilled workers.
D)The demand for skilled workers has increased and the demand for unskilled workers has not kept pace.
E)The demand for unskilled workers has increased as they could be hired for lower wages.
Unlock Deck
Unlock for access to all 116 flashcards in this deck.
Unlock Deck
k this deck
58
The figure given below shows the income-leisure trade off of an individual.Figure 16.5
AB and AC: Income constraints of the individual
I1, I2, and I3 curves show the income leisure choices of the individual.
If the tax rate remains the same as the base increases, the income tax structure is said to be:
A)proportional.
B)lump-sum.
C)negatively skewed.
D)progressive.
E)regressive.
AB and AC: Income constraints of the individualI1, I2, and I3 curves show the income leisure choices of the individual.
If the tax rate remains the same as the base increases, the income tax structure is said to be:
A)proportional.
B)lump-sum.
C)negatively skewed.
D)progressive.
E)regressive.
Unlock Deck
Unlock for access to all 116 flashcards in this deck.
Unlock Deck
k this deck
59
The figure given below shows the income-leisure trade off of an individual.Figure 16.5
AB and AC: Income constraints of the individual
I1, I2, and I3 curves show the income leisure choices of the individual.
All of the following are reasons for immigration to a foreign country, except that:
A)the domestic country may be politically repressive.
B)there is an abundance of employment opportunities in the domestic country.
C)the domestic country is economically stagnant.
D)there is no scope for upward mobility in the domestic country.
E)there are religious prosecutions.
AB and AC: Income constraints of the individualI1, I2, and I3 curves show the income leisure choices of the individual.
All of the following are reasons for immigration to a foreign country, except that:
A)the domestic country may be politically repressive.
B)there is an abundance of employment opportunities in the domestic country.
C)the domestic country is economically stagnant.
D)there is no scope for upward mobility in the domestic country.
E)there are religious prosecutions.
Unlock Deck
Unlock for access to all 116 flashcards in this deck.
Unlock Deck
k this deck
60
The figure given below shows the demand curve in the U.S. and the cost curves in U.S. and India.Figure: 16.4
In the figure:
MC: Marginal cost curve
ATC: Average total cost curve
D: Demand curve in the U.S.MR: Marginal revenue curve in the U.S.
Suppose a tax rate of 10 percent applies to all income up to $20,000 a year, income above $20,000 up to $50,000 a year is taxed at a rate of 15%, and income above $50,000 a year is taxed at 20%. Calculate the absolute amount of tax paid by a person whose annual income is $30,000.
A)$2,000
B)$2,500
C)$4,500
D)$4,000
E)$3,500
In the figure:MC: Marginal cost curve
ATC: Average total cost curve
D: Demand curve in the U.S.MR: Marginal revenue curve in the U.S.
Suppose a tax rate of 10 percent applies to all income up to $20,000 a year, income above $20,000 up to $50,000 a year is taxed at a rate of 15%, and income above $50,000 a year is taxed at 20%. Calculate the absolute amount of tax paid by a person whose annual income is $30,000.
A)$2,000
B)$2,500
C)$4,500
D)$4,000
E)$3,500
Unlock Deck
Unlock for access to all 116 flashcards in this deck.
Unlock Deck
k this deck
61
The figure given below shows the income-leisure trade off of an individual.Figure 16.5
AB and AC: Income constraints of the individual
I1, I2, and I3 curves show the income leisure choices of the individual.
When white males resist to share responsibilities with members of a minority group, it is termed as:
A)employer prejudice.
B)consumer prejudice
C)worker prejudice.
D)statistical discrimination.
E)occupational segregation.
AB and AC: Income constraints of the individualI1, I2, and I3 curves show the income leisure choices of the individual.
When white males resist to share responsibilities with members of a minority group, it is termed as:
A)employer prejudice.
B)consumer prejudice
C)worker prejudice.
D)statistical discrimination.
E)occupational segregation.
Unlock Deck
Unlock for access to all 116 flashcards in this deck.
Unlock Deck
k this deck
62
The figure given below shows the income-leisure trade off of an individual.Figure 16.5
AB and AC: Income constraints of the individual
I1, I2, and I3 curves show the income leisure choices of the individual.
Which of the following is an instance of employer prejudice that leads to wage differential?
A)Employers attempting to hire workers based on their marginal productivities
B)Employers attempting to hire only male workers
C)Workers attempting to work for only certain organizations
D)Producers purchasing raw materials from selective suppliers
E)Workers ready to work for any employer in the labor market
AB and AC: Income constraints of the individualI1, I2, and I3 curves show the income leisure choices of the individual.
Which of the following is an instance of employer prejudice that leads to wage differential?
A)Employers attempting to hire workers based on their marginal productivities
B)Employers attempting to hire only male workers
C)Workers attempting to work for only certain organizations
D)Producers purchasing raw materials from selective suppliers
E)Workers ready to work for any employer in the labor market
Unlock Deck
Unlock for access to all 116 flashcards in this deck.
Unlock Deck
k this deck
63
The figure given below shows the income-leisure trade off of an individual.Figure 16.5
AB and AC: Income constraints of the individual
I1, I2, and I3 curves show the income leisure choices of the individual.
Disparate treatment refers to:
A)the treatment of individuals on the basis of their race, sex, color, religion, or national origin.
B)the treatment of individual workers on the basis of their opportunity costs.
C)the treatment of individual workers on the basis of their marginal productivities.
D)discriminatory treatment of the individuals due to lack of correct information.
E)the discriminatory treatment of firms by the trade unions.
AB and AC: Income constraints of the individualI1, I2, and I3 curves show the income leisure choices of the individual.
Disparate treatment refers to:
A)the treatment of individuals on the basis of their race, sex, color, religion, or national origin.
B)the treatment of individual workers on the basis of their opportunity costs.
C)the treatment of individual workers on the basis of their marginal productivities.
D)discriminatory treatment of the individuals due to lack of correct information.
E)the discriminatory treatment of firms by the trade unions.
Unlock Deck
Unlock for access to all 116 flashcards in this deck.
Unlock Deck
k this deck
64
The figure given below shows the income-leisure trade off of an individual.Figure 16.5
AB and AC: Income constraints of the individual
I1, I2, and I3 curves show the income leisure choices of the individual.
Proponents of comparable worth justifies it on the ground that:
A)interfering with the functioning of the labor market will lead to shortages of labor.
B)interfering with the functioning of the labor market will lead to excess supplies of labor.
C)as a result of personal prejudices the market is unable to assess marginal products.
D)market correctly processes the innumerable information which is available.
E)interaction of demand and supply correctly determines the wage rate.
AB and AC: Income constraints of the individualI1, I2, and I3 curves show the income leisure choices of the individual.
Proponents of comparable worth justifies it on the ground that:
A)interfering with the functioning of the labor market will lead to shortages of labor.
B)interfering with the functioning of the labor market will lead to excess supplies of labor.
C)as a result of personal prejudices the market is unable to assess marginal products.
D)market correctly processes the innumerable information which is available.
E)interaction of demand and supply correctly determines the wage rate.
Unlock Deck
Unlock for access to all 116 flashcards in this deck.
Unlock Deck
k this deck
65
The following figures show the demand (D) and supply (S) curves of micro and macro economists.Figure 16.6
An individual's decision to supply her labor or to spend her time in leisure activity is known as the labor-leisure tradeoff.
An individual's decision to supply her labor or to spend her time in leisure activity is known as the labor-leisure tradeoff.
Unlock Deck
Unlock for access to all 116 flashcards in this deck.
Unlock Deck
k this deck
66
The figure given below shows the income-leisure trade off of an individual.Figure 16.5
AB and AC: Income constraints of the individual
I1, I2, and I3 curves show the income leisure choices of the individual.
Which of the following determines comparable worth of a particular job?
A)Cultural background of the applicants
B)Gender of the candidates applying for a job
C)Race of the applicants for the job
D)Level of formal education required for a job
E)National origin of the workers in a factory
AB and AC: Income constraints of the individualI1, I2, and I3 curves show the income leisure choices of the individual.
Which of the following determines comparable worth of a particular job?
A)Cultural background of the applicants
B)Gender of the candidates applying for a job
C)Race of the applicants for the job
D)Level of formal education required for a job
E)National origin of the workers in a factory
Unlock Deck
Unlock for access to all 116 flashcards in this deck.
Unlock Deck
k this deck
67
The following figures show the demand (D) and supply (S) curves of micro and macro economists.Figure 16.6
In Figure 16.6, assume that micro and macroeconomists must be paid the same wage because of comparable-worth laws. If the wage rate is $12, then:
A)there is a shortage of macroeconomists and a surplus of microeconomists.
B)there is a shortage of microeconomists and a surplus of macroeconomists.
C)there is a shortage of both macroeconomists and microeconomists.
D)there is a surplus of both macroeconomists and microeconomists.
E)the labor market for economists as a whole is in equilibrium.
Unlock Deck
Unlock for access to all 116 flashcards in this deck.
Unlock Deck
k this deck
68
The figure given below shows the income-leisure trade off of an individual.Figure 16.5
AB and AC: Income constraints of the individual
I1, I2, and I3 curves show the income leisure choices of the individual.
Which of the following statements best defines the economics of the so-called superstar effect in the labor market?
A)This effect will result in cases in which individuals with large productivity differences receive vastly different compensation.
B)This effect occurs in cases in which individuals with small productivity differences receive very small differences in compensation.
C)This effect occurs when the firm hiring the superstar simply does not understand the term marginal-revenue product.
D)This effect occurs in cases in which individuals with small productivity differences receive vastly different compensation.
E)This effect usually occurs in industries in which a labor union has far-reaching powers.
AB and AC: Income constraints of the individualI1, I2, and I3 curves show the income leisure choices of the individual.
Which of the following statements best defines the economics of the so-called superstar effect in the labor market?
A)This effect will result in cases in which individuals with large productivity differences receive vastly different compensation.
B)This effect occurs in cases in which individuals with small productivity differences receive very small differences in compensation.
C)This effect occurs when the firm hiring the superstar simply does not understand the term marginal-revenue product.
D)This effect occurs in cases in which individuals with small productivity differences receive vastly different compensation.
E)This effect usually occurs in industries in which a labor union has far-reaching powers.
Unlock Deck
Unlock for access to all 116 flashcards in this deck.
Unlock Deck
k this deck
69
The figure given below shows the income-leisure trade off of an individual.Figure 16.5
AB and AC: Income constraints of the individual
I1, I2, and I3 curves show the income leisure choices of the individual.
When people are separated into different jobs on the basis of sex, it is referred to as:
A)statistical discrimination.
B)employer prejudice.
C)worker prejudice.
D)occupational segregation.
E)occupational crowding.
AB and AC: Income constraints of the individualI1, I2, and I3 curves show the income leisure choices of the individual.
When people are separated into different jobs on the basis of sex, it is referred to as:
A)statistical discrimination.
B)employer prejudice.
C)worker prejudice.
D)occupational segregation.
E)occupational crowding.
Unlock Deck
Unlock for access to all 116 flashcards in this deck.
Unlock Deck
k this deck
70
The figure given below shows the income-leisure trade off of an individual.Figure 16.5
AB and AC: Income constraints of the individual
I1, I2, and I3 curves show the income leisure choices of the individual.
If employers have imperfect information about job applicants, it may be rational for them to use:
A)employer prejudice.
B)worker prejudice.
C)consumer prejudice.
D)statistical discrimination.
E)occupational segregation.
AB and AC: Income constraints of the individualI1, I2, and I3 curves show the income leisure choices of the individual.
If employers have imperfect information about job applicants, it may be rational for them to use:
A)employer prejudice.
B)worker prejudice.
C)consumer prejudice.
D)statistical discrimination.
E)occupational segregation.
Unlock Deck
Unlock for access to all 116 flashcards in this deck.
Unlock Deck
k this deck
71
The following figures show the demand (D) and supply (S) curves of micro and macro economists.Figure 16.6
In Figure 16.6, assume that the wage rates of the micro and the macro economists are determined by the aggregate demand and supply curves. The levels of employment for micro- and macro economists are _____ and _____ respectively:
A)100; 40.
B)100; 60.
C)90; 50.
D)100; 50.
E)110; 60
In Figure 16.6, assume that the wage rates of the micro and the macro economists are determined by the aggregate demand and supply curves. The levels of employment for micro- and macro economists are _____ and _____ respectively:
A)100; 40.
B)100; 60.
C)90; 50.
D)100; 50.
E)110; 60
Unlock Deck
Unlock for access to all 116 flashcards in this deck.
Unlock Deck
k this deck
72
The figure given below shows the income-leisure trade off of an individual.Figure 16.5
AB and AC: Income constraints of the individual
I1, I2, and I3 curves show the income leisure choices of the individual.
Which of the following is not a reason for the wage differential between females and males?
A)The choice of major in college by females tends to be different than the choice by males.
B)The existence of employer prejudice leads to wage differential between males and females.
C)The number of males is usually greater than the number of females in the labor force.
D)Females bear the primary responsibility of childbearing.
E)Women accept lower wages for flexible and shorter working hours.
AB and AC: Income constraints of the individualI1, I2, and I3 curves show the income leisure choices of the individual.
Which of the following is not a reason for the wage differential between females and males?
A)The choice of major in college by females tends to be different than the choice by males.
B)The existence of employer prejudice leads to wage differential between males and females.
C)The number of males is usually greater than the number of females in the labor force.
D)Females bear the primary responsibility of childbearing.
E)Women accept lower wages for flexible and shorter working hours.
Unlock Deck
Unlock for access to all 116 flashcards in this deck.
Unlock Deck
k this deck
73
The figure given below shows the income-leisure trade off of an individual.Figure 16.5
AB and AC: Income constraints of the individual
I1, I2, and I3 curves show the income leisure choices of the individual.
The Civil Rights Act of 1964 in the United States led to _____.
A)the introduction of the concept of discrimination.
B)complete elimination of discrimination from the labor force.
C)the creation of equal opportunities for men and women.
D)the creation of equal opportunities for the members of different races.
E)the establishment of a much clearer definition of discrimination.
AB and AC: Income constraints of the individualI1, I2, and I3 curves show the income leisure choices of the individual.
The Civil Rights Act of 1964 in the United States led to _____.
A)the introduction of the concept of discrimination.
B)complete elimination of discrimination from the labor force.
C)the creation of equal opportunities for men and women.
D)the creation of equal opportunities for the members of different races.
E)the establishment of a much clearer definition of discrimination.
Unlock Deck
Unlock for access to all 116 flashcards in this deck.
Unlock Deck
k this deck
74
The figure given below shows the income-leisure trade off of an individual.Figure 16.5
AB and AC: Income constraints of the individual
I1, I2, and I3 curves show the income leisure choices of the individual.
Which of the following can result in occupational crowding?
A)Illegal immigration
B)Outsourcing of services
C)Consumer prejudices, superstitions, and religious taboos
D)Governmental policies and customs
E)Statistical discrimination and imperfect information
AB and AC: Income constraints of the individualI1, I2, and I3 curves show the income leisure choices of the individual.
Which of the following can result in occupational crowding?
A)Illegal immigration
B)Outsourcing of services
C)Consumer prejudices, superstitions, and religious taboos
D)Governmental policies and customs
E)Statistical discrimination and imperfect information
Unlock Deck
Unlock for access to all 116 flashcards in this deck.
Unlock Deck
k this deck
75
The figure given below shows the income-leisure trade off of an individual.Figure 16.5
AB and AC: Income constraints of the individual
I1, I2, and I3 curves show the income leisure choices of the individual.
When people prefer to obtain medical, or legal services from white males, although they charge high prices for their services, it is termed as:
A)producer prejudice.
B)employer prejudice.
C)worker prejudice.
D)occupational segregation.
E)consumer prejudice.
AB and AC: Income constraints of the individualI1, I2, and I3 curves show the income leisure choices of the individual.
When people prefer to obtain medical, or legal services from white males, although they charge high prices for their services, it is termed as:
A)producer prejudice.
B)employer prejudice.
C)worker prejudice.
D)occupational segregation.
E)consumer prejudice.
Unlock Deck
Unlock for access to all 116 flashcards in this deck.
Unlock Deck
k this deck
76
The figure given below shows the income-leisure trade off of an individual.Figure 16.5
AB and AC: Income constraints of the individual
I1, I2, and I3 curves show the income leisure choices of the individual.
The concept of comparable worth:
A)is that pay ought to be determined by job characteristics rather than by supply and demand.
B)is that pay ought to be determined by supply and demand rather than by job characteristics.
C)has made hiring practices much simpler for employers.
D)asserts that market-determined wages are the only appropriate way in which to allocate pay.
E)is easy to implement once a new worker has been hired.
AB and AC: Income constraints of the individualI1, I2, and I3 curves show the income leisure choices of the individual.
The concept of comparable worth:
A)is that pay ought to be determined by job characteristics rather than by supply and demand.
B)is that pay ought to be determined by supply and demand rather than by job characteristics.
C)has made hiring practices much simpler for employers.
D)asserts that market-determined wages are the only appropriate way in which to allocate pay.
E)is easy to implement once a new worker has been hired.
Unlock Deck
Unlock for access to all 116 flashcards in this deck.
Unlock Deck
k this deck
77
The figure given below shows the income-leisure trade off of an individual.Figure 16.5
AB and AC: Income constraints of the individual
I1, I2, and I3 curves show the income leisure choices of the individual.
Which of the following reasons will most likely explain the occurrence of discrimination that is not related to personal prejudice?
A)A desire to avoid associating with certain groups of people
B)A lack of communication skills of workers seeking jobs
C)A lack of information
D)A lack of proper technical expertise
E)Too many people applying for the same job
AB and AC: Income constraints of the individualI1, I2, and I3 curves show the income leisure choices of the individual.
Which of the following reasons will most likely explain the occurrence of discrimination that is not related to personal prejudice?
A)A desire to avoid associating with certain groups of people
B)A lack of communication skills of workers seeking jobs
C)A lack of information
D)A lack of proper technical expertise
E)Too many people applying for the same job
Unlock Deck
Unlock for access to all 116 flashcards in this deck.
Unlock Deck
k this deck
78
The figure given below shows the income-leisure trade off of an individual.Figure 16.5
AB and AC: Income constraints of the individual
I1, I2, and I3 curves show the income leisure choices of the individual.
Which of the following statements about employer prejudice is true?
A)It would be impossible for employer prejudice to exist in a firm that sells its output in a competitive market unless all rivals also discriminate.
B)Economic theory tells us that it would be impossible for employer prejudice to exist in a firm that is a monopoly.
C)Employer prejudice will help a monopolist to increase his profits by satisfying his managers personal prejudices.
D)Legislation has ended employer prejudice in the United States.
E)Employer prejudice occurs only in low-paying jobs.
AB and AC: Income constraints of the individualI1, I2, and I3 curves show the income leisure choices of the individual.
Which of the following statements about employer prejudice is true?
A)It would be impossible for employer prejudice to exist in a firm that sells its output in a competitive market unless all rivals also discriminate.
B)Economic theory tells us that it would be impossible for employer prejudice to exist in a firm that is a monopoly.
C)Employer prejudice will help a monopolist to increase his profits by satisfying his managers personal prejudices.
D)Legislation has ended employer prejudice in the United States.
E)Employer prejudice occurs only in low-paying jobs.
Unlock Deck
Unlock for access to all 116 flashcards in this deck.
Unlock Deck
k this deck
79
The figure given below shows the income-leisure trade off of an individual.Figure 16.5
AB and AC: Income constraints of the individual
I1, I2, and I3 curves show the income leisure choices of the individual.
Reliance on indicators of productivity such as education, experience, and test scores may keep some very good people from getting a job and may result in hiring unproductive people. This is called:
A)worker prejudice.
B)statistical discrimination.
C)crowding out.
D)disparate treatment.
E)comparable worth.
AB and AC: Income constraints of the individualI1, I2, and I3 curves show the income leisure choices of the individual.
Reliance on indicators of productivity such as education, experience, and test scores may keep some very good people from getting a job and may result in hiring unproductive people. This is called:
A)worker prejudice.
B)statistical discrimination.
C)crowding out.
D)disparate treatment.
E)comparable worth.
Unlock Deck
Unlock for access to all 116 flashcards in this deck.
Unlock Deck
k this deck
80
The following figures show the demand (D) and supply (S) curves of micro and macro economists.Figure 16.6
The principal argument against comparable worth is that:
A)men and women differ largely in terms of their productivities.
B)market does not function correctly and leads to inefficient allocation of resources.
C)market allocates scarce resources to their most valued use in the most efficient manner.
D)demand and supply do not allocate workers to where they are needed the most.
E)legislation by the government are often appropriate as it processes all the available information correctly.
Unlock Deck
Unlock for access to all 116 flashcards in this deck.
Unlock Deck
k this deck
Unlock Deck
Unlock for access to all 116 flashcards in this deck.


