Deck 5: Using Economics to Understand the World Around You
Full screen (f)
Question
Question
Question
Figure 5.1. The figure shows a linear production possibility curve representing a tradeoff faced by a country, between necessities and luxuries. 
Refer to figure 5.1. Assume that the economy is initially at point G on the production possibility curve. To consume an amount of luxury good, shown by the distance O to L, the country will have to give up a quantity of necessity good, indicated by the distance _____.
A)G to NI
B)G to N
C)N to A
D)A to B
E)NI to B
Question
Question
Figure 5.1. The figure shows a linear production possibility curve representing a tradeoff faced by a country, between necessities and luxuries.
Which of the following is a possible cause of an increase in profit from the sale of goods and services?
A)A decrease in the per capita income of consumers
B)A decrease in the price of a substitute good or a service
C)An increase in the availability of raw materials
D)A decrease in the price of a good or service, everything else held constant
E)An increase in the price of a good or service, everything else held constant
Question
Question
Figure 5.1. The figure shows a linear production possibility curve representing a tradeoff faced by a country, between necessities and luxuries.
The phrase in the text, 'human beings are self-interested, not selfish' means that:
A)people are never selfish.
B)people never act in a spiteful or belligerent manner.
C)people never act in a fit of rage.
D)people contribute to charities and they help others.
E)people care only about themselves and their families.
Question
Figure 5.1. The figure shows a linear production possibility curve representing a tradeoff faced by a country, between necessities and luxuries.
To say that "there is a scarcity of gold" means that:
A)gold prices will plummet.
B)there is not enough gold to satisfy people's demand.
C)there are a very few substitutes for gold.
D)gold is relatively less expensive than other metals.
E)the demand for gold is changing.
To say that "there is a scarcity of gold" means that:
A)gold prices will plummet.
B)there is not enough gold to satisfy people's demand.
C)there are a very few substitutes for gold.
D)gold is relatively less expensive than other metals.
E)the demand for gold is changing.
Question
Figure 5.1. The figure shows a linear production possibility curve representing a tradeoff faced by a country, between necessities and luxuries.
The term self-interest, as viewed by economists, means that:
A)consumers never pay more for a good simply because it carries a certain designer label.
B)only economists are capable of making choices according to rational self-interest.
C)people never act in their self-interest until they have perfect information.
D)consumers always seek the least expensive option when making a purchase, regardless of individual preferences.
E)people make choices that, given the information available, gives them the greatest amount of satisfaction.
Question
Figure 5.1. The figure shows a linear production possibility curve representing a tradeoff faced by a country, between necessities and luxuries.
Refer to figure 5.1. What does the movement from point A to point B on the production possibility curve indicate?
A)It indicates that there is an increase in the demand for luxury goods in the country.
B)It indicates that there is an increase in the demand for necessities in the country.
C)It indicates that there is a fall in the per capita income of the people in the country.
D)It indicates that there is an increase in the price of the luxury goods.
E)It indicates that there is a tax rebate provided by the government of the country.
Question
Question
Figure 5.1. The figure shows a linear production possibility curve representing a tradeoff faced by a country, between necessities and luxuries.
Refer to figure 5.1. A fall in the gross domestic product of the country will lead to:
A)a leftward shift in the production possibility curve.
B)a rightward shift in the production possibility curve.
C)an increase in the consumption of luxury goods.
D)an upward movement along the production possibility curve.
E)no change in the consumption pattern of the country.
Question
Figure 5.1. The figure shows a linear production possibility curve representing a tradeoff faced by a country, between necessities and luxuries.
Refer to figure 5.1. Suppose the country represented in the figure is a low income country. Given a voluntary choice, the country will choose to be:
A)on a new production possibility curve.
B)on point C, on the production possibility curve.
C)near point G or A, on the production possibility curve.
D)near point C, on the production possibility curve.
E)near point B, on the production possibility curve.
Question
Figure 5.1. The figure shows a linear production possibility curve representing a tradeoff faced by a country, between necessities and luxuries.
A good or service is said to be scarce when:
A)its price is too low.
B)it is offered only to high income earners.
C)no one wishes to purchase it.
D)it cannot be transported easily.
E)at a price of zero, there is not enough to satisfy everyone's desire for it.
A good or service is said to be scarce when:
A)its price is too low.
B)it is offered only to high income earners.
C)no one wishes to purchase it.
D)it cannot be transported easily.
E)at a price of zero, there is not enough to satisfy everyone's desire for it.
Question
Figure 5.1. The figure shows a linear production possibility curve representing a tradeoff faced by a country, between necessities and luxuries.
Refer to figure 5.1. An increase in the country's gross domestic product will cause:
A)no change in the production possibility curve of the country.
B)an upward movement along the production possibility curve.
C)a downward movement along the production possibility curve.
D)an inward shift in the production possibility curve.
E)a rightward shift in the production possibility curve.
Question
Question
Question
Figure 5.1. The figure shows a linear production possibility curve representing a tradeoff faced by a country, between necessities and luxuries.
Refer to figure 5.1. Under which of the following conditions, would the residents of the country choose to consume luxury goods?
A)When there is an increase in the price of luxury goods
B)When there is a decrease in the prices of inferior goods
C)When there is an increase in the prices of goods that are necessities
D)When there is an increase in the per capita income of households
E)When there is a decrease in the per capita income of households
Question
Figure 5.1. The figure shows a linear production possibility curve representing a tradeoff faced by a country, between necessities and luxuries.
Individuals acting with self-interest:
A)always choose the same options as other rational individuals.
B)never do voluntary work.
C)always try to attain satisfaction at the expense of others.
D)choose options that give them the greatest amount of satisfaction.
E)have a perfectly elastic demand curve.
Question
Figure 5.1. The figure shows a linear production possibility curve representing a tradeoff faced by a country, between necessities and luxuries.
Which of the following is a possible drawback of horizontal fracking?
A)A fall in the cost of recovering natural gas and oil
B)An increase in the price of gas and oil as a result of a decline in the supply of natural gas and oil
C)A fall in imports of natural gas and oil
D)A fall in environmental exploitation due to the means employed to extract oil
E)An increase in harmful air emissions, water contamination, and problems associated with the disposal of harmful waste fluids
Question
Figure 5.2. The figure shows the supply and demand curves of a firm. 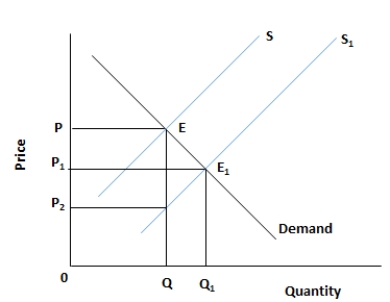
Which of the following is true?
A)Sellers are willing to supply more of a good or service at every price after costs have increased.
B)A fall in the price of a product leads to an increase in the profits earned by sellers.
C)A fall in the cost of production leads to a downward movement along the supply curve of a product.
D)Sellers are willing to supply more of a good or service at every price after costs have decreased.
E)An increase in the price of a product leads to a fall in the profits earned by sellers.
Question
Figure 5.2. The figure shows the supply and demand curves of a firm.
Refer to figure 5.2. Which of the following will cause a shift in the supply curve from S to S1?
A)A decline in the cost of producing the commodity
B)An increase in the cost of producing the commodity
C)An increase in the price of the commodity
D)A decline in the price of the commodity
E)A leftward shift in the demand curve of the product
Question
Figure 5.2. The figure shows the supply and demand curves of a firm.
Which of the following is a possible reason for a comparatively steeper demand curve for health care?
A)A large increase in the price of health care leads to a more than proportionate fall in the quantity demanded for health care.
B)The demand curve for health care is comparatively steeper than other products, because health care is a Giffen good.
C)A change in the price of health care leads to no change in the profit earned by the suppliers.
D)A large increase in the income of households leads to a less than proportionate increase in the quantity demanded.
E)A large increase in price does not cause a reduction in the purchase of health care by the same proportion.
Question
Figure 5.2. The figure shows the supply and demand curves of a firm.
What do you mean by the term 'equilibrium wage'?
A)It is the wage that is determined when potential employers and potential employees are free to transact as they wish.
B)It is a wage determined by the government with an intention to narrow the gap between the higher and the lower income groups.
C)It is a wage at which the workers refuse to offer labor.
D)It is a minimum possible rate that an employer must pay in order to hire a labor.
E)It is a wage at which there is an excess supply of workers.
Question
Figure 5.2. The figure shows the supply and demand curves of a firm.
Which of the following is a possible difference between health care and other products?
A)The demand curve for health care may be steeper than the demand curve for other products.
B)The demand curve for health care is a horizontal line, whereas the demand curve for other products is downward sloping.
C)The supply curve for health care is fixed, whereas the supply curve of other products change with a change in its determinants.
D)The demand for health care is positively related to price, whereas the demand for other products is inversely related to price.
E)The supply of health care is inversely related to price whereas the supply of other products are positively related to price.
Question
Figure 5.2. The figure shows the supply and demand curves of a firm.
Which of the following is the purpose of a minimum wage?
A)To reduce the wage rates of high-income workers
B)To keep a track of the changes in the wage rate in an unskilled labor market
C)To deal with the problem of unemployment in the market
D)To help increase the profits earned by the producers
E)To raise the wage rate for the lowest income workers
Question
Figure 5.2. The figure shows the supply and demand curves of a firm.
Refer to figure 5.2. An increase in the cost of production will lead to a(n):
A)rightward shift in the supply curve of the product, S.
B)leftward shift in the supply curve of the product, S.
C)upward movement along the supply curve of the product, S.
D)downward movement along the supply curve of the product, S.
E)rightward movement along the demand curve of the product.
Question
Figure 5.2. The figure shows the supply and demand curves of a firm.
Which of the following possibly determines the allocation of goods and services in a free market?
A)The availability of raw materials
B)The cost of production
C)The level of government intervention
D)The ability of the producers to produce a differentiated product
E)The willingness and ability of consumers to pay for the product
Question
Figure 5.2. The figure shows the supply and demand curves of a firm.
In which of the following situations will the price of medical care decrease with an increase in its demand?
A)When the supply of medical care is the same as the demand for medical care
B)When there is an increase in productivity as a result of a technological advancement
C)When there is an increase in the price of resources used to produce medical care
D)When the supply of medical care increases more than the demand for medical care
E)When there is an increase in future profit expectations
Question
Figure 5.2. The figure shows the supply and demand curves of a firm.
Refer to figure 5.2. A shift in the supply curve from S to S1leads to:
A)a fall in price from P to P2 and an increase in quantity supplied from Q to Q1.
B)a fall in price from P to P1 and an increase in quantity supplied from Q to Q1.
C)an increase in price from P1 to P and a fall in quantity supplied from Q1 to Q.
D)a leftward movement along the demand curve of the product.
E)a leftward shift of the demand curve of the product.
Question
Figure 5.2. The figure shows the supply and demand curves of a firm.
Which of the following is a possible cause of a rightward shift in the supply of healthcare?
A)A fall in the price of resources used to produce healthcare products
B)An increase in the price of resources used to produce healthcare products
C)A fall in the profit expectations of healthcare providers
D)A fall in the number of suppliers of healthcare
E)An expectation of an increase in the price of healthcare products in future
Question
Figure 5.2. The figure shows the supply and demand curves of a firm.
Which of the following helps in determining whether health care cost rises because of government policy, or because of demand rising faster than supply?
A)Examining the market for health care away from the belief that the market outcome is unfair
B)Examining the market for health care with the belief that the market outcome is unfair
C)Examining the allocation system
D)Examining the changes in the price of health care products
E)Examining the changes in the number of suppliers of health care in the market
Question
Figure 5.1. The figure shows a linear production possibility curve representing a tradeoff faced by a country, between necessities and luxuries.
When people make choices that (at the time and with the information they have at their disposal) give them the greatest amount of satisfaction, they are said to be:
A)behaving irrationally.
B)applying econometric models to their everyday behavior.
C)living under a communist dictator.
D)acting in their own self-interest.
E)showing no willingness to plan for the future.
Question
Figure 5.2. The figure shows the supply and demand curves of a firm.
Which of the following statements is true?
A)The intention of a minimum wage is to raise the wage rate for the skilled workers.
B)The lowest of the federal or state minimum wage levels prevails in each state.
C)The federal minimum wage, in the United States, is followed by all the states as their minimum wage.
D)The minimum wage has the greatest impact on the unskilled labor market.
E)The minimum wage has the greatest impact on the skilled labor market.
Question
Figure 5.2. The figure shows the supply and demand curves of a firm.
Which of the following statements about health care is true?
A)The demand for health care is inversely related to price.
B)The demand for health care is positively related to price.
C)Healthcare is an inferior good.
D)Health care and health insurance is only provided by the government in the U.S.
E)The supply of health care is inversely related to price.
Question
Figure 5.2. The figure shows the supply and demand curves of a firm.
Which of the following statements is true?
A)With an increase in the demand for health care, the quantity supplied increases but supply does not change.
B)With an increase in the demand for health care, the supply curve shifts to the right.
C)With an increase in the demand for health care, the supply curve shifts to the left.
D)With an increase in the demand for health care, the price of the product decreases.
E)With an increase in the demand for health care, the quantity supplied decreases but the supply does not change.
Question
Figure 5.2. The figure shows the supply and demand curves of a firm.
Which of the following statements is true?
A)Over time, when demand for health care continues to rise relatively more than supply, the cost of health care falls.
B)Over time, when demand for health care continues to rise relatively more than supply , the cost of health care continues to rise.
C)An increase in the demand for health care is accompanied by an outward shift in the supply curve.
D)The price of health care rises either with a fall in demand or an increase in supply.
E)The change in the demand for health care with no change in supply causes the price to fall continuously.
Question
Figure 5.2. The figure shows the supply and demand curves of a firm.
Refer to figure 5.2. Which of the following is true?
A)The supply curve of the product shifts to the left, with a fall in the cost of producing the commodity.
B)With a fall in the cost of production, sellers are willing to supply Q1 units of the product at a price of P2, which is lower than the initial price P.
C)With a fall in the cost of production, sellers are willing to supply Q units of the product at a price of P2, which is lower than the initial price P.
D)There is an increase in the demand for the product with a fall in the cost of producing the commodity.
E)An increase in the cost of producing the commodity leads to an upward movement along the supply curve of the product.
Question
Figure 5.2. The figure shows the supply and demand curves of a firm.
What do you mean by the term 'market process'?
A)It refers to the way that scarce goods and services are allocated through individual actions and self-interest of buyers and sellers.
B)It refers to the way that scarce resources are allocated by a government to firms that value them the most.
C)It refers to the way in which markets adjust to changes in demand and supply.
D)It refers to a system in which goods and services are exchanged through transactions by private households and firms.
E)It refers to a way in which final goods and services are distributed to potential consumers.
Question
Figure 5.2. The figure shows the supply and demand curves of a firm.
Which of the following is a possible cause of an increase in the demand for health care?
A)A young population
B)A fall in the purchasing power of households
C)An aging population
D)A fall in the total population of a country
E)Technological advancement
Which of the following is a possible cause of an increase in the demand for health care?
A)A young population
B)A fall in the purchasing power of households
C)An aging population
D)A fall in the total population of a country
E)Technological advancement
Question
Figure 5.2. The figure shows the supply and demand curves of a firm.
A wage that allows people to pay for the necessities of life is known as a(n):
A)equilibrium wage.
B)minimum wage.
C)living wage.
D)fair wage.
E)subsistence wage.
A wage that allows people to pay for the necessities of life is known as a(n):
A)equilibrium wage.
B)minimum wage.
C)living wage.
D)fair wage.
E)subsistence wage.
Question
Figure 5.3. The figure shows the wage rate and the quantity of labor supplied in an unskilled labor market. 
One of the drawbacks of horizontal fracking is that it drew workers from other industries to the fracking industry.
One of the drawbacks of horizontal fracking is that it drew workers from other industries to the fracking industry.
Question
Figure 5.2. The figure shows the supply and demand curves of a firm.
Which of the following is true with regard to minimum wages?
A)A minimum wage does little to alleviate poverty.
B)A minimum wage helps deal with the problem of poverty.
C)A minimum wage leads to a surplus or unemployment in the skilled labor market.
D)A minimum wage adversely affects the unskilled laborers between the age group 40 and 45.
E)A minimum wage helps provide employment to teenagers and improve their standard of living.
Question
Figure 5.2. The figure shows the supply and demand curves of a firm.
Which of the following is a possible outcome of a minimum wage imposed by a government?
A)It leads to an increase in consumer surplus.
B)It favors women and children and helps improve their standard of living.
C)It eradicates the problem of unemployment from the market.
D)It creates a labor surplus or unemployment.
E)It creates a labor deficit.
Question
Figure 5.3. The figure shows the wage rate and the quantity of labor supplied in an unskilled labor market.
Refer to figure 5.3. The surplus or unemployment in the labor market is represented by:
A)a rightward shift in the labor demand curve.
B)a fall in price from $6 to $4.
C)the distance between QII and Q.
D)the distance between Q and QI.
E)the distance between the points A and B.
Refer to figure 5.3. The surplus or unemployment in the labor market is represented by:
A)a rightward shift in the labor demand curve.
B)a fall in price from $6 to $4.
C)the distance between QII and Q.
D)the distance between Q and QI.
E)the distance between the points A and B.
Question
Figure 5.2. The figure shows the supply and demand curves of a firm.
Which of the following is true?
A)If minimum wage is set below the equilibrium wage, it leads to a labor surplus.
B)If anything interferes with the voluntary exchanges that make up a market, equilibrium does not occur.
C)Minimum wage helps deal with the problem of unemployment in the market for unskilled labor.
D)Producers are willing to employ more labor at a minimum wage.
E)Minimum wage leads to a situation of labor deficit in a market.
Question
Figure 5.3. The figure shows the wage rate and the quantity of labor supplied in an unskilled labor market.
Refer to figure 5.3. Suppose the government imposes a minimum wage of $8. Which of the following is a possible outcome of the imposition of a minimum wage above the equilibrium wage rate?
A)There will be a rightward shift in the labor supply curve.
B)There will be a rightward shift in the labor demand curve.
C)There will be an increase in the quantity of jobs offered, from Q to QII, and a fall in the quantity of labor supplied, from Q to QI.
D)There will be a fall in the quantity of jobs offered, from Q to QI, and an increase in the quantity of labor supplied, from Q to QII.
E)There will be an increase in the producer surplus, at the minimum wage rate.
Question
Figure 5.3. The figure shows the wage rate and the quantity of labor supplied in an unskilled labor market.
Hydraulic fracking involves pumping millions of gallons of chemically treated water into the wells at pressures of 9,000 pounds per square inch or more.
Hydraulic fracking involves pumping millions of gallons of chemically treated water into the wells at pressures of 9,000 pounds per square inch or more.
Question
Figure 5.3. The figure shows the wage rate and the quantity of labor supplied in an unskilled labor market.
Refer to figure 5.3. Which of the following is true?
A)The labor market equilibrium is represented by the price and quantity combination of $6 and Q.
B)The labor market equilibrium is represented by the price and quantity combination of $6 and QI.
C)The labor market equilibrium is represented by the price and quantity combination of $4 and Q.
D)The labor market equilibrium is represented by the price and quantity combination of $4 and QII.
E)The labor market equilibrium is represented by the price and quantity combination of $8 and Q.
Question
Figure 5.3. The figure shows the wage rate and the quantity of labor supplied in an unskilled labor market.
People are compelled to make a choice because of the lack of time and money to buy everything they want.
People are compelled to make a choice because of the lack of time and money to buy everything they want.
Question
Figure 5.3. The figure shows the wage rate and the quantity of labor supplied in an unskilled labor market.
One of the assumptions of an economic analysis is that market functions are controlled by the government.
One of the assumptions of an economic analysis is that market functions are controlled by the government.
Question
Figure 5.3. The figure shows the wage rate and the quantity of labor supplied in an unskilled labor market.
To examine a real-world issue, economists look at the real-world results to see how they differ from those of a free market.
To examine a real-world issue, economists look at the real-world results to see how they differ from those of a free market.
Question
Figure 5.3. The figure shows the wage rate and the quantity of labor supplied in an unskilled labor market.
Refer to figure 5.3. Which of the following is a possible outcome of a fall in the wage rate from $6 to $4?
A)There will be an increase in both, the supply of and the demand for labor.
B)There will be a fall in the supply of labor and an increase in the demand for labor.
C)There will be a fall in the demand for labor and an increase in the supply of labor.
D)There will be a shift in the equilibrium point.
E)There will be a fall in both the supply of and the demand for labor.
Question
Figure 5.3. The figure shows the wage rate and the quantity of labor supplied in an unskilled labor market.
Refer to figure 5.3. If people refuse to offer labor unless they receive a wage higher than the equilibrium wage, then:
A)there will be a shift in the equilibrium point.
B)the quantity of labor demanded will increase from Q to QII.
C)the quantity of labor demanded will fall from Q to QI.
D)the wage rate will move up, from $6 to $8.
E)the wage rate will fall from $6 to $4.
Question
Figure 5.3. The figure shows the wage rate and the quantity of labor supplied in an unskilled labor market.
The demand for health care is perfectly elastic.
The demand for health care is perfectly elastic.
Question
Figure 5.3. The figure shows the wage rate and the quantity of labor supplied in an unskilled labor market.
The production possibilities curve of a low income country lies outside the production possibilities curve of a high income country.
The production possibilities curve of a low income country lies outside the production possibilities curve of a high income country.
Question
Figure 5.3. The figure shows the wage rate and the quantity of labor supplied in an unskilled labor market.
Sellers are more willing to supply a good or service for which the profit is low than to supply a good or service for which the profit is high.
Sellers are more willing to supply a good or service for which the profit is low than to supply a good or service for which the profit is high.
Question
Figure 5.3. The figure shows the wage rate and the quantity of labor supplied in an unskilled labor market.
Economic growth is represented by an inward shift of the production possibility curve.
Economic growth is represented by an inward shift of the production possibility curve.
Question
Figure 5.3. The figure shows the wage rate and the quantity of labor supplied in an unskilled labor market.
Scarcity impels an individual to make choices.
Scarcity impels an individual to make choices.
Question
Figure 5.2. The figure shows the supply and demand curves of a firm.
Which of the following statements is true?
A)Minimum wage creates a labor deficit in a market.
B)Minimum wage intends to increase the consumer surplus.
C)Minimum wage is a wage set below the equilibrium wage in order to create more job opportunities.
D)Minimum wage harms the unskilled workers between the age group 40 and 50.
E)Minimum wage harms the unskilled workers between the age group 16 and 19.
Question
Figure 5.3. The figure shows the wage rate and the quantity of labor supplied in an unskilled labor market.
In the United States, there is a federal minimum wage that is followed by each state.
In the United States, there is a federal minimum wage that is followed by each state.
Question
Figure 5.3. The figure shows the wage rate and the quantity of labor supplied in an unskilled labor market.
Programs like Medicaid in the United States provide low-income households with medical care, because of the attitude of unfairness associated with the allocation of health care.
Programs like Medicaid in the United States provide low-income households with medical care, because of the attitude of unfairness associated with the allocation of health care.
Question
Figure 5.3. The figure shows the wage rate and the quantity of labor supplied in an unskilled labor market.
The items held constant in the study of economic theory is known as the determinants of demand and the determinants of supply.
The items held constant in the study of economic theory is known as the determinants of demand and the determinants of supply.
Question
Figure 5.3. The figure shows the wage rate and the quantity of labor supplied in an unskilled labor market.
The lowest of the federal or state minimum wage levels prevails in each state.
The lowest of the federal or state minimum wage levels prevails in each state.
Question
Figure 5.3. The figure shows the wage rate and the quantity of labor supplied in an unskilled labor market.
Medicare subsidizes or provides health care to the poor and medicaid provides health care to the elderly.
Medicare subsidizes or provides health care to the poor and medicaid provides health care to the elderly.
Question
Figure 5.3. The figure shows the wage rate and the quantity of labor supplied in an unskilled labor market.
The market process ensures that, when all transactions are voluntary, resources get allocated to the use where they are valued the most.
The market process ensures that, when all transactions are voluntary, resources get allocated to the use where they are valued the most.
Question
Figure 5.3. The figure shows the wage rate and the quantity of labor supplied in an unskilled labor market.
The imposition of a minimum wage in the unskilled labor market creates labor surplus or unemployment.
The imposition of a minimum wage in the unskilled labor market creates labor surplus or unemployment.
Question
Figure 5.3. The figure shows the wage rate and the quantity of labor supplied in an unskilled labor market.
Minimum wage adversely affects unskilled workers who do not have work, aged 16 to 19.
Minimum wage adversely affects unskilled workers who do not have work, aged 16 to 19.

Unlock Deck
Sign up to unlock the cards in this deck!
Unlock Deck
Unlock Deck
1/68
Play
Full screen (f)
Deck 5: Using Economics to Understand the World Around You
1
Scenario 4-1
In a given year, country A exported $12 million worth of goods to country B and $6 million worth of goods to country C; country B exported $4 million worth of goods to country A and $7 million worth of goods to country C; and country C exported $5 million worth of goods to country A and $2 million worth of goods to country B.
Which of the following is a basic assumption of an economic analysis?
A)Private property rights exist and are secure.
B)A controlled market structure is the key to economic growth.
C)In a free market, resources are owned by the government.
D)There are no private property rights under a free market economy.
E)Social well-being is the prime objective of an entrepreneur.
Private property rights exist and are secure.
2
Scenario 4-1
In a given year, country A exported $12 million worth of goods to country B and $6 million worth of goods to country C; country B exported $4 million worth of goods to country A and $7 million worth of goods to country C; and country C exported $5 million worth of goods to country A and $2 million worth of goods to country B.
Which of the following is a possible advantage of a free market condition?
A)In a free market, consumers are offered discounts on the purchase of products.
B)In a free market, all goods and services are offered for free to households below the poverty line.
C)In a free market, continuous government intervention helps keep the price of products under control.
D)In a free market, competition among sellers helps the consumers purchase a product at the lowest possible price.
E)In a free market, consumers have limited products to choose from, thereby assuring less confusion and better quality.
In a free market, competition among sellers helps the consumers purchase a product at the lowest possible price.
3
Figure 5.1. The figure shows a linear production possibility curve representing a tradeoff faced by a country, between necessities and luxuries.
Refer to figure 5.1. Assume that the economy is initially at point G on the production possibility curve. To consume an amount of luxury good, shown by the distance O to L, the country will have to give up a quantity of necessity good, indicated by the distance _____.
A)G to NI
B)G to N
C)N to A
D)A to B
E)NI to B
G to N
4
Scenario 4-1
In a given year, country A exported $12 million worth of goods to country B and $6 million worth of goods to country C; country B exported $4 million worth of goods to country A and $7 million worth of goods to country C; and country C exported $5 million worth of goods to country A and $2 million worth of goods to country B.
What do you mean by the term 'free market'?
A)It refers to the process whereby buyers and sellers interact or trade under government regulation.
B)It refers to the process whereby buyers and sellers voluntarily interact or trade without any interference or restrictions.
C)It refers to a market where buyers and sellers pay for goods and services in kind and not in cash.
D)It refers to a market where assets are traded after they have been sold in the primary market.
E)It refers to a market where the demand for the product being traded is not affected by a change in the price of the product.
Unlock Deck
Unlock for access to all 68 flashcards in this deck.
Unlock Deck
k this deck
5
Figure 5.1. The figure shows a linear production possibility curve representing a tradeoff faced by a country, between necessities and luxuries.
Which of the following is a possible cause of an increase in profit from the sale of goods and services?
A)A decrease in the per capita income of consumers
B)A decrease in the price of a substitute good or a service
C)An increase in the availability of raw materials
D)A decrease in the price of a good or service, everything else held constant
E)An increase in the price of a good or service, everything else held constant
Unlock Deck
Unlock for access to all 68 flashcards in this deck.
Unlock Deck
k this deck
6
Scenario 4-1
In a given year, country A exported $12 million worth of goods to country B and $6 million worth of goods to country C; country B exported $4 million worth of goods to country A and $7 million worth of goods to country C; and country C exported $5 million worth of goods to country A and $2 million worth of goods to country B.
Which of the following will possibly cause a leftward shift in the production possibility curve, representing good X and good Y?
A)A decrease in a country's GDP
B)An increase in the price of good X
C)An increase in the price of good Y
D)A decrease in the price of good Y
E)A decrease in the price of good X
Unlock Deck
Unlock for access to all 68 flashcards in this deck.
Unlock Deck
k this deck
7
Figure 5.1. The figure shows a linear production possibility curve representing a tradeoff faced by a country, between necessities and luxuries.
The phrase in the text, 'human beings are self-interested, not selfish' means that:
A)people are never selfish.
B)people never act in a spiteful or belligerent manner.
C)people never act in a fit of rage.
D)people contribute to charities and they help others.
E)people care only about themselves and their families.
Unlock Deck
Unlock for access to all 68 flashcards in this deck.
Unlock Deck
k this deck
8
Figure 5.1. The figure shows a linear production possibility curve representing a tradeoff faced by a country, between necessities and luxuries.
To say that "there is a scarcity of gold" means that:
A)gold prices will plummet.
B)there is not enough gold to satisfy people's demand.
C)there are a very few substitutes for gold.
D)gold is relatively less expensive than other metals.
E)the demand for gold is changing.
To say that "there is a scarcity of gold" means that:
A)gold prices will plummet.
B)there is not enough gold to satisfy people's demand.
C)there are a very few substitutes for gold.
D)gold is relatively less expensive than other metals.
E)the demand for gold is changing.
Unlock Deck
Unlock for access to all 68 flashcards in this deck.
Unlock Deck
k this deck
9
Figure 5.1. The figure shows a linear production possibility curve representing a tradeoff faced by a country, between necessities and luxuries.
The term self-interest, as viewed by economists, means that:
A)consumers never pay more for a good simply because it carries a certain designer label.
B)only economists are capable of making choices according to rational self-interest.
C)people never act in their self-interest until they have perfect information.
D)consumers always seek the least expensive option when making a purchase, regardless of individual preferences.
E)people make choices that, given the information available, gives them the greatest amount of satisfaction.
Unlock Deck
Unlock for access to all 68 flashcards in this deck.
Unlock Deck
k this deck
10
Figure 5.1. The figure shows a linear production possibility curve representing a tradeoff faced by a country, between necessities and luxuries.
Refer to figure 5.1. What does the movement from point A to point B on the production possibility curve indicate?
A)It indicates that there is an increase in the demand for luxury goods in the country.
B)It indicates that there is an increase in the demand for necessities in the country.
C)It indicates that there is a fall in the per capita income of the people in the country.
D)It indicates that there is an increase in the price of the luxury goods.
E)It indicates that there is a tax rebate provided by the government of the country.
Unlock Deck
Unlock for access to all 68 flashcards in this deck.
Unlock Deck
k this deck
11
Scenario 4-1
In a given year, country A exported $12 million worth of goods to country B and $6 million worth of goods to country C; country B exported $4 million worth of goods to country A and $7 million worth of goods to country C; and country C exported $5 million worth of goods to country A and $2 million worth of goods to country B.
Which of the following is likely to cause an outward shift of a production possibility curve?
A)An increase in the price of the commodity represented on the horizontal axis
B)A fall in the cost of producing the commodity represented on the vertical axis
C)An improvement in the available technology
D)A fall in the supply of resources
E)An increase in the supply of unskilled workers
Unlock Deck
Unlock for access to all 68 flashcards in this deck.
Unlock Deck
k this deck
12
Figure 5.1. The figure shows a linear production possibility curve representing a tradeoff faced by a country, between necessities and luxuries.
Refer to figure 5.1. A fall in the gross domestic product of the country will lead to:
A)a leftward shift in the production possibility curve.
B)a rightward shift in the production possibility curve.
C)an increase in the consumption of luxury goods.
D)an upward movement along the production possibility curve.
E)no change in the consumption pattern of the country.
Unlock Deck
Unlock for access to all 68 flashcards in this deck.
Unlock Deck
k this deck
13
Figure 5.1. The figure shows a linear production possibility curve representing a tradeoff faced by a country, between necessities and luxuries.
Refer to figure 5.1. Suppose the country represented in the figure is a low income country. Given a voluntary choice, the country will choose to be:
A)on a new production possibility curve.
B)on point C, on the production possibility curve.
C)near point G or A, on the production possibility curve.
D)near point C, on the production possibility curve.
E)near point B, on the production possibility curve.
Unlock Deck
Unlock for access to all 68 flashcards in this deck.
Unlock Deck
k this deck
14
Figure 5.1. The figure shows a linear production possibility curve representing a tradeoff faced by a country, between necessities and luxuries.
A good or service is said to be scarce when:
A)its price is too low.
B)it is offered only to high income earners.
C)no one wishes to purchase it.
D)it cannot be transported easily.
E)at a price of zero, there is not enough to satisfy everyone's desire for it.
A good or service is said to be scarce when:
A)its price is too low.
B)it is offered only to high income earners.
C)no one wishes to purchase it.
D)it cannot be transported easily.
E)at a price of zero, there is not enough to satisfy everyone's desire for it.
Unlock Deck
Unlock for access to all 68 flashcards in this deck.
Unlock Deck
k this deck
15
Figure 5.1. The figure shows a linear production possibility curve representing a tradeoff faced by a country, between necessities and luxuries.
Refer to figure 5.1. An increase in the country's gross domestic product will cause:
A)no change in the production possibility curve of the country.
B)an upward movement along the production possibility curve.
C)a downward movement along the production possibility curve.
D)an inward shift in the production possibility curve.
E)a rightward shift in the production possibility curve.
Unlock Deck
Unlock for access to all 68 flashcards in this deck.
Unlock Deck
k this deck
16
Scenario 4-1
In a given year, country A exported $12 million worth of goods to country B and $6 million worth of goods to country C; country B exported $4 million worth of goods to country A and $7 million worth of goods to country C; and country C exported $5 million worth of goods to country A and $2 million worth of goods to country B.
Which of the following is true?
A)Economists assume that there are no private property rights in a free market.
B)A free market is also known as a fettered market.
C)A voluntary transaction means that all parties to the transaction must expect to benefit.
D)People always receive goods and services at a discounted price in a free market.
E)An economic growth is represented by an inward shift of the production possibility curve.
Unlock Deck
Unlock for access to all 68 flashcards in this deck.
Unlock Deck
k this deck
17
Scenario 4-1
In a given year, country A exported $12 million worth of goods to country B and $6 million worth of goods to country C; country B exported $4 million worth of goods to country A and $7 million worth of goods to country C; and country C exported $5 million worth of goods to country A and $2 million worth of goods to country B.
Which of the following is a step that economists take in order to examine a real-world issue?
A)Determine the results that will occur if the market being considered is a controlled market
B)Look at the real-world results to see the similarities they hold with the results of a free market
C)Suggest remedies and policies to alter the results of a free-market
D)Suggest remedies or policies to alter the real-world result
E)Assume that the market transactions, in a real-world, is completely controlled by the government
Unlock Deck
Unlock for access to all 68 flashcards in this deck.
Unlock Deck
k this deck
18
Figure 5.1. The figure shows a linear production possibility curve representing a tradeoff faced by a country, between necessities and luxuries.
Refer to figure 5.1. Under which of the following conditions, would the residents of the country choose to consume luxury goods?
A)When there is an increase in the price of luxury goods
B)When there is a decrease in the prices of inferior goods
C)When there is an increase in the prices of goods that are necessities
D)When there is an increase in the per capita income of households
E)When there is a decrease in the per capita income of households
Unlock Deck
Unlock for access to all 68 flashcards in this deck.
Unlock Deck
k this deck
19
Figure 5.1. The figure shows a linear production possibility curve representing a tradeoff faced by a country, between necessities and luxuries.
Individuals acting with self-interest:
A)always choose the same options as other rational individuals.
B)never do voluntary work.
C)always try to attain satisfaction at the expense of others.
D)choose options that give them the greatest amount of satisfaction.
E)have a perfectly elastic demand curve.
Unlock Deck
Unlock for access to all 68 flashcards in this deck.
Unlock Deck
k this deck
20
Figure 5.1. The figure shows a linear production possibility curve representing a tradeoff faced by a country, between necessities and luxuries.
Which of the following is a possible drawback of horizontal fracking?
A)A fall in the cost of recovering natural gas and oil
B)An increase in the price of gas and oil as a result of a decline in the supply of natural gas and oil
C)A fall in imports of natural gas and oil
D)A fall in environmental exploitation due to the means employed to extract oil
E)An increase in harmful air emissions, water contamination, and problems associated with the disposal of harmful waste fluids
Unlock Deck
Unlock for access to all 68 flashcards in this deck.
Unlock Deck
k this deck
21
Figure 5.2. The figure shows the supply and demand curves of a firm.
Which of the following is true?
A)Sellers are willing to supply more of a good or service at every price after costs have increased.
B)A fall in the price of a product leads to an increase in the profits earned by sellers.
C)A fall in the cost of production leads to a downward movement along the supply curve of a product.
D)Sellers are willing to supply more of a good or service at every price after costs have decreased.
E)An increase in the price of a product leads to a fall in the profits earned by sellers.
Unlock Deck
Unlock for access to all 68 flashcards in this deck.
Unlock Deck
k this deck
22
Figure 5.2. The figure shows the supply and demand curves of a firm.
Refer to figure 5.2. Which of the following will cause a shift in the supply curve from S to S1?
A)A decline in the cost of producing the commodity
B)An increase in the cost of producing the commodity
C)An increase in the price of the commodity
D)A decline in the price of the commodity
E)A leftward shift in the demand curve of the product
Unlock Deck
Unlock for access to all 68 flashcards in this deck.
Unlock Deck
k this deck
23
Figure 5.2. The figure shows the supply and demand curves of a firm.
Which of the following is a possible reason for a comparatively steeper demand curve for health care?
A)A large increase in the price of health care leads to a more than proportionate fall in the quantity demanded for health care.
B)The demand curve for health care is comparatively steeper than other products, because health care is a Giffen good.
C)A change in the price of health care leads to no change in the profit earned by the suppliers.
D)A large increase in the income of households leads to a less than proportionate increase in the quantity demanded.
E)A large increase in price does not cause a reduction in the purchase of health care by the same proportion.
Unlock Deck
Unlock for access to all 68 flashcards in this deck.
Unlock Deck
k this deck
24
Figure 5.2. The figure shows the supply and demand curves of a firm.
What do you mean by the term 'equilibrium wage'?
A)It is the wage that is determined when potential employers and potential employees are free to transact as they wish.
B)It is a wage determined by the government with an intention to narrow the gap between the higher and the lower income groups.
C)It is a wage at which the workers refuse to offer labor.
D)It is a minimum possible rate that an employer must pay in order to hire a labor.
E)It is a wage at which there is an excess supply of workers.
Unlock Deck
Unlock for access to all 68 flashcards in this deck.
Unlock Deck
k this deck
25
Figure 5.2. The figure shows the supply and demand curves of a firm.
Which of the following is a possible difference between health care and other products?
A)The demand curve for health care may be steeper than the demand curve for other products.
B)The demand curve for health care is a horizontal line, whereas the demand curve for other products is downward sloping.
C)The supply curve for health care is fixed, whereas the supply curve of other products change with a change in its determinants.
D)The demand for health care is positively related to price, whereas the demand for other products is inversely related to price.
E)The supply of health care is inversely related to price whereas the supply of other products are positively related to price.
Unlock Deck
Unlock for access to all 68 flashcards in this deck.
Unlock Deck
k this deck
26
Figure 5.2. The figure shows the supply and demand curves of a firm.
Which of the following is the purpose of a minimum wage?
A)To reduce the wage rates of high-income workers
B)To keep a track of the changes in the wage rate in an unskilled labor market
C)To deal with the problem of unemployment in the market
D)To help increase the profits earned by the producers
E)To raise the wage rate for the lowest income workers
Unlock Deck
Unlock for access to all 68 flashcards in this deck.
Unlock Deck
k this deck
27
Figure 5.2. The figure shows the supply and demand curves of a firm.
Refer to figure 5.2. An increase in the cost of production will lead to a(n):
A)rightward shift in the supply curve of the product, S.
B)leftward shift in the supply curve of the product, S.
C)upward movement along the supply curve of the product, S.
D)downward movement along the supply curve of the product, S.
E)rightward movement along the demand curve of the product.
Unlock Deck
Unlock for access to all 68 flashcards in this deck.
Unlock Deck
k this deck
28
Figure 5.2. The figure shows the supply and demand curves of a firm.
Which of the following possibly determines the allocation of goods and services in a free market?
A)The availability of raw materials
B)The cost of production
C)The level of government intervention
D)The ability of the producers to produce a differentiated product
E)The willingness and ability of consumers to pay for the product
Unlock Deck
Unlock for access to all 68 flashcards in this deck.
Unlock Deck
k this deck
29
Figure 5.2. The figure shows the supply and demand curves of a firm.
In which of the following situations will the price of medical care decrease with an increase in its demand?
A)When the supply of medical care is the same as the demand for medical care
B)When there is an increase in productivity as a result of a technological advancement
C)When there is an increase in the price of resources used to produce medical care
D)When the supply of medical care increases more than the demand for medical care
E)When there is an increase in future profit expectations
Unlock Deck
Unlock for access to all 68 flashcards in this deck.
Unlock Deck
k this deck
30
Figure 5.2. The figure shows the supply and demand curves of a firm.
Refer to figure 5.2. A shift in the supply curve from S to S1leads to:
A)a fall in price from P to P2 and an increase in quantity supplied from Q to Q1.
B)a fall in price from P to P1 and an increase in quantity supplied from Q to Q1.
C)an increase in price from P1 to P and a fall in quantity supplied from Q1 to Q.
D)a leftward movement along the demand curve of the product.
E)a leftward shift of the demand curve of the product.
Unlock Deck
Unlock for access to all 68 flashcards in this deck.
Unlock Deck
k this deck
31
Figure 5.2. The figure shows the supply and demand curves of a firm.
Which of the following is a possible cause of a rightward shift in the supply of healthcare?
A)A fall in the price of resources used to produce healthcare products
B)An increase in the price of resources used to produce healthcare products
C)A fall in the profit expectations of healthcare providers
D)A fall in the number of suppliers of healthcare
E)An expectation of an increase in the price of healthcare products in future
Unlock Deck
Unlock for access to all 68 flashcards in this deck.
Unlock Deck
k this deck
32
Figure 5.2. The figure shows the supply and demand curves of a firm.
Which of the following helps in determining whether health care cost rises because of government policy, or because of demand rising faster than supply?
A)Examining the market for health care away from the belief that the market outcome is unfair
B)Examining the market for health care with the belief that the market outcome is unfair
C)Examining the allocation system
D)Examining the changes in the price of health care products
E)Examining the changes in the number of suppliers of health care in the market
Unlock Deck
Unlock for access to all 68 flashcards in this deck.
Unlock Deck
k this deck
33
Figure 5.1. The figure shows a linear production possibility curve representing a tradeoff faced by a country, between necessities and luxuries.
When people make choices that (at the time and with the information they have at their disposal) give them the greatest amount of satisfaction, they are said to be:
A)behaving irrationally.
B)applying econometric models to their everyday behavior.
C)living under a communist dictator.
D)acting in their own self-interest.
E)showing no willingness to plan for the future.
Unlock Deck
Unlock for access to all 68 flashcards in this deck.
Unlock Deck
k this deck
34
Figure 5.2. The figure shows the supply and demand curves of a firm.
Which of the following statements is true?
A)The intention of a minimum wage is to raise the wage rate for the skilled workers.
B)The lowest of the federal or state minimum wage levels prevails in each state.
C)The federal minimum wage, in the United States, is followed by all the states as their minimum wage.
D)The minimum wage has the greatest impact on the unskilled labor market.
E)The minimum wage has the greatest impact on the skilled labor market.
Unlock Deck
Unlock for access to all 68 flashcards in this deck.
Unlock Deck
k this deck
35
Figure 5.2. The figure shows the supply and demand curves of a firm.
Which of the following statements about health care is true?
A)The demand for health care is inversely related to price.
B)The demand for health care is positively related to price.
C)Healthcare is an inferior good.
D)Health care and health insurance is only provided by the government in the U.S.
E)The supply of health care is inversely related to price.
Unlock Deck
Unlock for access to all 68 flashcards in this deck.
Unlock Deck
k this deck
36
Figure 5.2. The figure shows the supply and demand curves of a firm.
Which of the following statements is true?
A)With an increase in the demand for health care, the quantity supplied increases but supply does not change.
B)With an increase in the demand for health care, the supply curve shifts to the right.
C)With an increase in the demand for health care, the supply curve shifts to the left.
D)With an increase in the demand for health care, the price of the product decreases.
E)With an increase in the demand for health care, the quantity supplied decreases but the supply does not change.
Unlock Deck
Unlock for access to all 68 flashcards in this deck.
Unlock Deck
k this deck
37
Figure 5.2. The figure shows the supply and demand curves of a firm.
Which of the following statements is true?
A)Over time, when demand for health care continues to rise relatively more than supply, the cost of health care falls.
B)Over time, when demand for health care continues to rise relatively more than supply , the cost of health care continues to rise.
C)An increase in the demand for health care is accompanied by an outward shift in the supply curve.
D)The price of health care rises either with a fall in demand or an increase in supply.
E)The change in the demand for health care with no change in supply causes the price to fall continuously.
Unlock Deck
Unlock for access to all 68 flashcards in this deck.
Unlock Deck
k this deck
38
Figure 5.2. The figure shows the supply and demand curves of a firm.
Refer to figure 5.2. Which of the following is true?
A)The supply curve of the product shifts to the left, with a fall in the cost of producing the commodity.
B)With a fall in the cost of production, sellers are willing to supply Q1 units of the product at a price of P2, which is lower than the initial price P.
C)With a fall in the cost of production, sellers are willing to supply Q units of the product at a price of P2, which is lower than the initial price P.
D)There is an increase in the demand for the product with a fall in the cost of producing the commodity.
E)An increase in the cost of producing the commodity leads to an upward movement along the supply curve of the product.
Unlock Deck
Unlock for access to all 68 flashcards in this deck.
Unlock Deck
k this deck
39
Figure 5.2. The figure shows the supply and demand curves of a firm.
What do you mean by the term 'market process'?
A)It refers to the way that scarce goods and services are allocated through individual actions and self-interest of buyers and sellers.
B)It refers to the way that scarce resources are allocated by a government to firms that value them the most.
C)It refers to the way in which markets adjust to changes in demand and supply.
D)It refers to a system in which goods and services are exchanged through transactions by private households and firms.
E)It refers to a way in which final goods and services are distributed to potential consumers.
Unlock Deck
Unlock for access to all 68 flashcards in this deck.
Unlock Deck
k this deck
40
Figure 5.2. The figure shows the supply and demand curves of a firm.
Which of the following is a possible cause of an increase in the demand for health care?
A)A young population
B)A fall in the purchasing power of households
C)An aging population
D)A fall in the total population of a country
E)Technological advancement
Which of the following is a possible cause of an increase in the demand for health care?
A)A young population
B)A fall in the purchasing power of households
C)An aging population
D)A fall in the total population of a country
E)Technological advancement
Unlock Deck
Unlock for access to all 68 flashcards in this deck.
Unlock Deck
k this deck
41
Figure 5.2. The figure shows the supply and demand curves of a firm.
A wage that allows people to pay for the necessities of life is known as a(n):
A)equilibrium wage.
B)minimum wage.
C)living wage.
D)fair wage.
E)subsistence wage.
A wage that allows people to pay for the necessities of life is known as a(n):
A)equilibrium wage.
B)minimum wage.
C)living wage.
D)fair wage.
E)subsistence wage.
Unlock Deck
Unlock for access to all 68 flashcards in this deck.
Unlock Deck
k this deck
42
Figure 5.3. The figure shows the wage rate and the quantity of labor supplied in an unskilled labor market.
One of the drawbacks of horizontal fracking is that it drew workers from other industries to the fracking industry.
One of the drawbacks of horizontal fracking is that it drew workers from other industries to the fracking industry.
Unlock Deck
Unlock for access to all 68 flashcards in this deck.
Unlock Deck
k this deck
43
Figure 5.2. The figure shows the supply and demand curves of a firm.
Which of the following is true with regard to minimum wages?
A)A minimum wage does little to alleviate poverty.
B)A minimum wage helps deal with the problem of poverty.
C)A minimum wage leads to a surplus or unemployment in the skilled labor market.
D)A minimum wage adversely affects the unskilled laborers between the age group 40 and 45.
E)A minimum wage helps provide employment to teenagers and improve their standard of living.
Unlock Deck
Unlock for access to all 68 flashcards in this deck.
Unlock Deck
k this deck
44
Figure 5.2. The figure shows the supply and demand curves of a firm.
Which of the following is a possible outcome of a minimum wage imposed by a government?
A)It leads to an increase in consumer surplus.
B)It favors women and children and helps improve their standard of living.
C)It eradicates the problem of unemployment from the market.
D)It creates a labor surplus or unemployment.
E)It creates a labor deficit.
Unlock Deck
Unlock for access to all 68 flashcards in this deck.
Unlock Deck
k this deck
45
Figure 5.3. The figure shows the wage rate and the quantity of labor supplied in an unskilled labor market.
Refer to figure 5.3. The surplus or unemployment in the labor market is represented by:
A)a rightward shift in the labor demand curve.
B)a fall in price from $6 to $4.
C)the distance between QII and Q.
D)the distance between Q and QI.
E)the distance between the points A and B.
Refer to figure 5.3. The surplus or unemployment in the labor market is represented by:
A)a rightward shift in the labor demand curve.
B)a fall in price from $6 to $4.
C)the distance between QII and Q.
D)the distance between Q and QI.
E)the distance between the points A and B.
Unlock Deck
Unlock for access to all 68 flashcards in this deck.
Unlock Deck
k this deck
46
Figure 5.2. The figure shows the supply and demand curves of a firm.
Which of the following is true?
A)If minimum wage is set below the equilibrium wage, it leads to a labor surplus.
B)If anything interferes with the voluntary exchanges that make up a market, equilibrium does not occur.
C)Minimum wage helps deal with the problem of unemployment in the market for unskilled labor.
D)Producers are willing to employ more labor at a minimum wage.
E)Minimum wage leads to a situation of labor deficit in a market.
Unlock Deck
Unlock for access to all 68 flashcards in this deck.
Unlock Deck
k this deck
47
Figure 5.3. The figure shows the wage rate and the quantity of labor supplied in an unskilled labor market.
Refer to figure 5.3. Suppose the government imposes a minimum wage of $8. Which of the following is a possible outcome of the imposition of a minimum wage above the equilibrium wage rate?
A)There will be a rightward shift in the labor supply curve.
B)There will be a rightward shift in the labor demand curve.
C)There will be an increase in the quantity of jobs offered, from Q to QII, and a fall in the quantity of labor supplied, from Q to QI.
D)There will be a fall in the quantity of jobs offered, from Q to QI, and an increase in the quantity of labor supplied, from Q to QII.
E)There will be an increase in the producer surplus, at the minimum wage rate.
Unlock Deck
Unlock for access to all 68 flashcards in this deck.
Unlock Deck
k this deck
48
Figure 5.3. The figure shows the wage rate and the quantity of labor supplied in an unskilled labor market.
Hydraulic fracking involves pumping millions of gallons of chemically treated water into the wells at pressures of 9,000 pounds per square inch or more.
Hydraulic fracking involves pumping millions of gallons of chemically treated water into the wells at pressures of 9,000 pounds per square inch or more.
Unlock Deck
Unlock for access to all 68 flashcards in this deck.
Unlock Deck
k this deck
49
Figure 5.3. The figure shows the wage rate and the quantity of labor supplied in an unskilled labor market.
Refer to figure 5.3. Which of the following is true?
A)The labor market equilibrium is represented by the price and quantity combination of $6 and Q.
B)The labor market equilibrium is represented by the price and quantity combination of $6 and QI.
C)The labor market equilibrium is represented by the price and quantity combination of $4 and Q.
D)The labor market equilibrium is represented by the price and quantity combination of $4 and QII.
E)The labor market equilibrium is represented by the price and quantity combination of $8 and Q.
Unlock Deck
Unlock for access to all 68 flashcards in this deck.
Unlock Deck
k this deck
50
Figure 5.3. The figure shows the wage rate and the quantity of labor supplied in an unskilled labor market.
People are compelled to make a choice because of the lack of time and money to buy everything they want.
People are compelled to make a choice because of the lack of time and money to buy everything they want.
Unlock Deck
Unlock for access to all 68 flashcards in this deck.
Unlock Deck
k this deck
51
Figure 5.3. The figure shows the wage rate and the quantity of labor supplied in an unskilled labor market.
One of the assumptions of an economic analysis is that market functions are controlled by the government.
One of the assumptions of an economic analysis is that market functions are controlled by the government.
Unlock Deck
Unlock for access to all 68 flashcards in this deck.
Unlock Deck
k this deck
52
Figure 5.3. The figure shows the wage rate and the quantity of labor supplied in an unskilled labor market.
To examine a real-world issue, economists look at the real-world results to see how they differ from those of a free market.
To examine a real-world issue, economists look at the real-world results to see how they differ from those of a free market.
Unlock Deck
Unlock for access to all 68 flashcards in this deck.
Unlock Deck
k this deck
53
Figure 5.3. The figure shows the wage rate and the quantity of labor supplied in an unskilled labor market.
Refer to figure 5.3. Which of the following is a possible outcome of a fall in the wage rate from $6 to $4?
A)There will be an increase in both, the supply of and the demand for labor.
B)There will be a fall in the supply of labor and an increase in the demand for labor.
C)There will be a fall in the demand for labor and an increase in the supply of labor.
D)There will be a shift in the equilibrium point.
E)There will be a fall in both the supply of and the demand for labor.
Unlock Deck
Unlock for access to all 68 flashcards in this deck.
Unlock Deck
k this deck
54
Figure 5.3. The figure shows the wage rate and the quantity of labor supplied in an unskilled labor market.
Refer to figure 5.3. If people refuse to offer labor unless they receive a wage higher than the equilibrium wage, then:
A)there will be a shift in the equilibrium point.
B)the quantity of labor demanded will increase from Q to QII.
C)the quantity of labor demanded will fall from Q to QI.
D)the wage rate will move up, from $6 to $8.
E)the wage rate will fall from $6 to $4.
Unlock Deck
Unlock for access to all 68 flashcards in this deck.
Unlock Deck
k this deck
55
Figure 5.3. The figure shows the wage rate and the quantity of labor supplied in an unskilled labor market.
The demand for health care is perfectly elastic.
The demand for health care is perfectly elastic.
Unlock Deck
Unlock for access to all 68 flashcards in this deck.
Unlock Deck
k this deck
56
Figure 5.3. The figure shows the wage rate and the quantity of labor supplied in an unskilled labor market.
The production possibilities curve of a low income country lies outside the production possibilities curve of a high income country.
The production possibilities curve of a low income country lies outside the production possibilities curve of a high income country.
Unlock Deck
Unlock for access to all 68 flashcards in this deck.
Unlock Deck
k this deck
57
Figure 5.3. The figure shows the wage rate and the quantity of labor supplied in an unskilled labor market.
Sellers are more willing to supply a good or service for which the profit is low than to supply a good or service for which the profit is high.
Sellers are more willing to supply a good or service for which the profit is low than to supply a good or service for which the profit is high.
Unlock Deck
Unlock for access to all 68 flashcards in this deck.
Unlock Deck
k this deck
58
Figure 5.3. The figure shows the wage rate and the quantity of labor supplied in an unskilled labor market.
Economic growth is represented by an inward shift of the production possibility curve.
Economic growth is represented by an inward shift of the production possibility curve.
Unlock Deck
Unlock for access to all 68 flashcards in this deck.
Unlock Deck
k this deck
59
Figure 5.3. The figure shows the wage rate and the quantity of labor supplied in an unskilled labor market.
Scarcity impels an individual to make choices.
Scarcity impels an individual to make choices.
Unlock Deck
Unlock for access to all 68 flashcards in this deck.
Unlock Deck
k this deck
60
Figure 5.2. The figure shows the supply and demand curves of a firm.
Which of the following statements is true?
A)Minimum wage creates a labor deficit in a market.
B)Minimum wage intends to increase the consumer surplus.
C)Minimum wage is a wage set below the equilibrium wage in order to create more job opportunities.
D)Minimum wage harms the unskilled workers between the age group 40 and 50.
E)Minimum wage harms the unskilled workers between the age group 16 and 19.
Unlock Deck
Unlock for access to all 68 flashcards in this deck.
Unlock Deck
k this deck
61
Figure 5.3. The figure shows the wage rate and the quantity of labor supplied in an unskilled labor market.
In the United States, there is a federal minimum wage that is followed by each state.
In the United States, there is a federal minimum wage that is followed by each state.
Unlock Deck
Unlock for access to all 68 flashcards in this deck.
Unlock Deck
k this deck
62
Figure 5.3. The figure shows the wage rate and the quantity of labor supplied in an unskilled labor market.
Programs like Medicaid in the United States provide low-income households with medical care, because of the attitude of unfairness associated with the allocation of health care.
Programs like Medicaid in the United States provide low-income households with medical care, because of the attitude of unfairness associated with the allocation of health care.
Unlock Deck
Unlock for access to all 68 flashcards in this deck.
Unlock Deck
k this deck
63
Figure 5.3. The figure shows the wage rate and the quantity of labor supplied in an unskilled labor market.
The items held constant in the study of economic theory is known as the determinants of demand and the determinants of supply.
The items held constant in the study of economic theory is known as the determinants of demand and the determinants of supply.
Unlock Deck
Unlock for access to all 68 flashcards in this deck.
Unlock Deck
k this deck
64
Figure 5.3. The figure shows the wage rate and the quantity of labor supplied in an unskilled labor market.
The lowest of the federal or state minimum wage levels prevails in each state.
The lowest of the federal or state minimum wage levels prevails in each state.
Unlock Deck
Unlock for access to all 68 flashcards in this deck.
Unlock Deck
k this deck
65
Figure 5.3. The figure shows the wage rate and the quantity of labor supplied in an unskilled labor market.
Medicare subsidizes or provides health care to the poor and medicaid provides health care to the elderly.
Medicare subsidizes or provides health care to the poor and medicaid provides health care to the elderly.
Unlock Deck
Unlock for access to all 68 flashcards in this deck.
Unlock Deck
k this deck
66
Figure 5.3. The figure shows the wage rate and the quantity of labor supplied in an unskilled labor market.
The market process ensures that, when all transactions are voluntary, resources get allocated to the use where they are valued the most.
The market process ensures that, when all transactions are voluntary, resources get allocated to the use where they are valued the most.
Unlock Deck
Unlock for access to all 68 flashcards in this deck.
Unlock Deck
k this deck
67
Figure 5.3. The figure shows the wage rate and the quantity of labor supplied in an unskilled labor market.
The imposition of a minimum wage in the unskilled labor market creates labor surplus or unemployment.
The imposition of a minimum wage in the unskilled labor market creates labor surplus or unemployment.
Unlock Deck
Unlock for access to all 68 flashcards in this deck.
Unlock Deck
k this deck
68
Figure 5.3. The figure shows the wage rate and the quantity of labor supplied in an unskilled labor market.
Minimum wage adversely affects unskilled workers who do not have work, aged 16 to 19.
Minimum wage adversely affects unskilled workers who do not have work, aged 16 to 19.
Unlock Deck
Unlock for access to all 68 flashcards in this deck.
Unlock Deck
k this deck
Unlock Deck
Unlock for access to all 68 flashcards in this deck.


