Deck 11: Income and Expenditure
Full screen (f)
Question
Question
Question
Question
Question
Question
Question
Question
Question
Question
Question
Question
Question
Question
Question
Question
Question
Question
Question
Question
Question
Question
Question
Question
Use the following to answer questions: 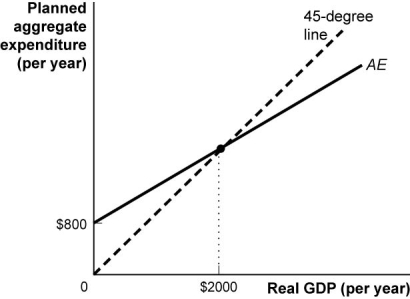
(Figure: Planned Aggregate Expenditures Curve II)Use Figure: Planned Aggregate Expenditures Curve II.Suppose that the consumption function in this figure rises by $100.The planned aggregate expenditures curve would shift upwards by:
A) $100.
B) $250.
C) $100 times the multiplier.
D) $150.
(Figure: Planned Aggregate Expenditures Curve II)Use Figure: Planned Aggregate Expenditures Curve II.Suppose that the consumption function in this figure rises by $100.The planned aggregate expenditures curve would shift upwards by:
A) $100.
B) $250.
C) $100 times the multiplier.
D) $150.
Question
Question
Question
Use the following to answer questions:
(Figure: Planned Aggregate Expenditures Curve II)Use Figure: Planned Aggregate Expenditures Curve II.The slope of the planned aggregate expenditures curve is:
A) 0.25.
B) 0.5.
C) 0.6.
D) 45 degrees.
(Figure: Planned Aggregate Expenditures Curve II)Use Figure: Planned Aggregate Expenditures Curve II.The slope of the planned aggregate expenditures curve is:
A) 0.25.
B) 0.5.
C) 0.6.
D) 45 degrees.
Question
Question
Use the following to answer questions:
(Figure: Planned Aggregate Expenditures Curve II)Use Figure: Planned Aggregate Expenditures Curve II.Suppose that the consumption function in this economy rises by $200.Equilibrium real GDP would rise by:
A) $100.
B) $200.
C) $250.
D) $500.
(Figure: Planned Aggregate Expenditures Curve II)Use Figure: Planned Aggregate Expenditures Curve II.Suppose that the consumption function in this economy rises by $200.Equilibrium real GDP would rise by:
A) $100.
B) $200.
C) $250.
D) $500.
Question
Question
Use the following to answer questions:
(Figure: Planned Aggregate Expenditures Curve II)Use Figure: Planned Aggregate Expenditures Curve II.Suppose that the consumption function rises by $100.The equilibrium level of real GDP would rise by:
A) $100.
B) $200.
C) $250.
D) $50.
(Figure: Planned Aggregate Expenditures Curve II)Use Figure: Planned Aggregate Expenditures Curve II.Suppose that the consumption function rises by $100.The equilibrium level of real GDP would rise by:
A) $100.
B) $200.
C) $250.
D) $50.
Question
Question
Question
Question
Question
Use the following to answer questions:
(Figure: Planned Aggregate Expenditures Curve II)Use Figure: Planned Aggregate Expenditures Curve II.The multiplier is:
A) 1.0.
B) 2.0.
C) 2.5.
D) 5.0.
(Figure: Planned Aggregate Expenditures Curve II)Use Figure: Planned Aggregate Expenditures Curve II.The multiplier is:
A) 1.0.
B) 2.0.
C) 2.5.
D) 5.0.
Question
Use the following to answer questions:
(Figure: Planned Aggregate Expenditures Curve II)Use Figure: Planned Aggregate Expenditures Curve II.The equilibrium level of real GDP in the planned aggregate expenditure model shown in this figure is:
A) $800.
B) $1 000.
C) $2 000.
D) $4 000.
(Figure: Planned Aggregate Expenditures Curve II)Use Figure: Planned Aggregate Expenditures Curve II.The equilibrium level of real GDP in the planned aggregate expenditure model shown in this figure is:
A) $800.
B) $1 000.
C) $2 000.
D) $4 000.
Question
Question
Question
Use the following to answer questions: 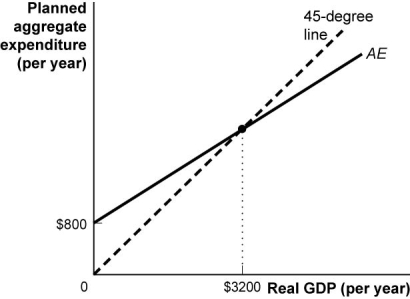
(Figure: Planned Aggregate Expenditures Curve III)Use Figure: Planned Aggregate Expenditures Curve III.Suppose that the consumption function in this figure rises by $100.The planned aggregate expenditures curve will shift upwards by:
A) $100.
B) $400.
C) $100 times the multiplier.
D) $200 times the multiplier.
Question
Use the following to answer questions: 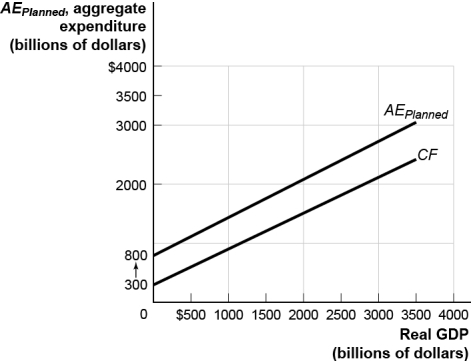
(Figure: The Aggregate Consumption Function and Planned Aggregate Expenditure)Use Figure: The Aggregate Consumption Function and Planned Aggregate Expenditure.If expected disposable income increases,then the:
A) planned aggregate expenditure curve will shift up.
B) planned aggregate expenditure curve will shift down.
C) economy will move upwards along the planned aggregate expenditure curve.
D) economy will move downwards along the planned aggregate expenditure curve.
Question
Question
Question
Use the following to answer questions:
(Figure: The Aggregate Consumption Function and Planned Aggregate Expenditure)Use Figure: The Aggregate Consumption Function and Planned Aggregate Expenditure.If aggregate wealth increases,the:
A) planned aggregate expenditure curve will shift up.
B) planned aggregate expenditure curve will shift down.
C) economy will move upwards along the planned aggregate expenditure curve.
D) economy will move downwards along the planned aggregate expenditure curve.
Question
Question
Question
Use the following to answer questions:
(Figure: The Aggregate Consumption Function and Planned Aggregate Expenditure)Use Figure: The Aggregate Consumption Function and Planned Aggregate Expenditure.If disposable income decreases,then the:
A) planned aggregate expenditure curve will shift up.
B) planned aggregate expenditure curve will shift down.
C) economy will move upwards along the planned aggregate expenditure curve.
D) economy will move downwards along the planned aggregate expenditure curve.
Question
Use the following to answer questions:
(Figure: The Aggregate Consumption Function and Planned Aggregate Expenditure)Use Figure: The Aggregate Consumption Function and Planned Aggregate Expenditure.If current disposable income increases in this economy,then the:
A) planned aggregate expenditure curve will shift up.
B) planned aggregate expenditure curve will shift down.
C) economy will move upwards along the planned aggregate expenditure curve.
D) economy will move downwards along the planned aggregate expenditure curve.
Question
Question
Use the following to answer questions:
The digital revolution led to a decline in Finnish paper exports.
The digital revolution led to a decline in Finnish paper exports.
Question
Question
Question
Use the following to answer questions:
(Figure: The Aggregate Consumption Function and Planned Aggregate Expenditure)Use Figure: The Aggregate Consumption Function and Planned Aggregate Expenditure.If expected disposable income decreases in this economy,then the:
A) planned aggregate expenditure curve will shift up.
B) planned aggregate expenditure curve will shift down.
C) economy will move upwards along the planned aggregate expenditure curve.
D) economy will move downwards along the planned aggregate expenditure curve.
Question
Question
Use the following to answer questions:
(Figure: The Aggregate Consumption Function and Planned Aggregate Expenditure)Use Figure: The Aggregate Consumption Function and Planned Aggregate Expenditure.If aggregate wealth decreases,then the:
A) planned aggregate expenditure curve will shift up.
B) planned aggregate expenditure curve will shift down.
C) economy will move upwards along the planned aggregate expenditure curve.
D) economy will move downwards along the planned aggregate expenditure curve.
Question
Question
Use the following to answer questions:
(Figure: Planned Aggregate Expenditures Curve III)Use Figure: Planned Aggregate Expenditures Curve III.Suppose that the consumption function shifts upwards by $100.Equilibrium real GDP will rise by:
A) $100.
B) $400.
C) $800.
D) $3 200.
(Figure: Planned Aggregate Expenditures Curve III)Use Figure: Planned Aggregate Expenditures Curve III.Suppose that the consumption function shifts upwards by $100.Equilibrium real GDP will rise by:
A) $100.
B) $400.
C) $800.
D) $3 200.
Question
Question
Question
Question
Question
Question
Question
Question
Question
Question
Question
Question
Question
Question
Question
Question
Question
Question
Question
Question
Question
Question
Question

Unlock Deck
Sign up to unlock the cards in this deck!
Unlock Deck
Unlock Deck
1/130
Play
Full screen (f)
Deck 11: Income and Expenditure
1
The multiplier is:
A) 1 / (1 - MPC).
B) MPS / MPC.
C) 1 / (MPC).
D) 1 (1 + MPC).
A) 1 / (1 - MPC).
B) MPS / MPC.
C) 1 / (MPC).
D) 1 (1 + MPC).
1 / (1 - MPC).
2
The changes in the economy of Finland in 2016 provide an example of:
A) the risk associated with an agricultural economy.
B) illustrating the way booms and busts happen for the economy as a whole.
C) how public assistance programs can stimulate the economy.
D) the benefits of government budget surpluses.
A) the risk associated with an agricultural economy.
B) illustrating the way booms and busts happen for the economy as a whole.
C) how public assistance programs can stimulate the economy.
D) the benefits of government budget surpluses.
illustrating the way booms and busts happen for the economy as a whole.
3
The marginal propensity to save plus the marginal propensity to consume must equal:
A) zero.
B) one.
C) income.
D) savings.
A) zero.
B) one.
C) income.
D) savings.
one.
4
Suppose that the marginal propensity to consume is 0.8 and investment spending increases by $100 billion.The increase in real GDP is:
A) $100 billion,the same amount as investment spending.
B) $125 billion,composed of $100 billion in investment spending and $25 billion in consumption.
C) $80 billion,composed of $100 billion in investment spending and a decrease in consumption of $20 billion.
D) $500 billion,composed of $100 billion in investment spending and $400 billion in consumption.
Unlock Deck
Unlock for access to all 130 flashcards in this deck.
Unlock Deck
k this deck
5
Suppose that investment spending increases by $50 billion,and as a result the equilibrium income increases by $200 billion.The value of the marginal propensity to consume is:
A) 0.8.
B) 0.4.
C) 0.75.
D) 4.
A) 0.8.
B) 0.4.
C) 0.75.
D) 4.
Unlock Deck
Unlock for access to all 130 flashcards in this deck.
Unlock Deck
k this deck
6
If the multiplier equals 4,then the marginal propensity to save must be equal to:
A) 0.25.
B) 0.5.
C) 0.75.
D) the marginal propensity to consume.
A) 0.25.
B) 0.5.
C) 0.75.
D) the marginal propensity to consume.
Unlock Deck
Unlock for access to all 130 flashcards in this deck.
Unlock Deck
k this deck
7
The marginal propensity to consume equals the:
A) proportion of consumer spending as a function of aggregate disposable income.
B) change in savings divided by the change in aggregate disposable income.
C) ratio of the change in consumer spending to the change in aggregate disposable income.
D) change in savings divided by the change in consumer spending.
Unlock Deck
Unlock for access to all 130 flashcards in this deck.
Unlock Deck
k this deck
8
If the marginal propensity to save is 0.3,the size of the multiplier is:
A) 3.3.
B) 2.3.
C) 1.3.
D) 0.7.
A) 3.3.
B) 2.3.
C) 1.3.
D) 0.7.
Unlock Deck
Unlock for access to all 130 flashcards in this deck.
Unlock Deck
k this deck
9
The economy of Finland experienced a setback in 2016 because of:
A) the advent of digital technology.
B) a drop in the price of oil.
C) poor business practices at Nokia.
D) climate change.
A) the advent of digital technology.
B) a drop in the price of oil.
C) poor business practices at Nokia.
D) climate change.
Unlock Deck
Unlock for access to all 130 flashcards in this deck.
Unlock Deck
k this deck
10
The main reasons that retail sales fell in Finland during 2016 were:
A) a decrease in imports and declining sales at Nokia,which led to reduced household incomes.
B) an increase in imports and declining sales at Nokia,which led to reduced household incomes.
C) an increase in exports and rising sales at Nokia,which led to reduced household incomes.
D) a decrease in exports and declining sales at Nokia,which led to reduced household incomes.
Unlock Deck
Unlock for access to all 130 flashcards in this deck.
Unlock Deck
k this deck
11
The marginal propensity to save is:
A) savings divided by aggregate income.
B) the fraction of an additional dollar of disposable income that is saved.
C) 1 + MPC.
D) savings divided by aggregate income,or 1 + MPC.
A) savings divided by aggregate income.
B) the fraction of an additional dollar of disposable income that is saved.
C) 1 + MPC.
D) savings divided by aggregate income,or 1 + MPC.
Unlock Deck
Unlock for access to all 130 flashcards in this deck.
Unlock Deck
k this deck
12
The decline in the Finnish economy of 2016 is primarily an example of how:
A) too much government regulation is harmful to the economy.
B) changes in consumer spending can be multiplied through the entire economy.
C) immigration affects local economies.
D) high tax rates can decrease the economic activity in an area.
A) too much government regulation is harmful to the economy.
B) changes in consumer spending can be multiplied through the entire economy.
C) immigration affects local economies.
D) high tax rates can decrease the economic activity in an area.
Unlock Deck
Unlock for access to all 130 flashcards in this deck.
Unlock Deck
k this deck
13
The marginal propensity to save is the increase in household savings when _____ increase(s)by $1.
A) investment spending
B) taxes
C) consumption
D) disposable income
A) investment spending
B) taxes
C) consumption
D) disposable income
Unlock Deck
Unlock for access to all 130 flashcards in this deck.
Unlock Deck
k this deck
14
Suppose that the government increases spending by $100 billion as a stimulus package.If the marginal propensity to consume is 0.6,then real GDP will:
A) decrease by $250 billion.
B) increase by $250 billion.
C) increase by $600 billion.
D) decrease by $400 billion.
A) decrease by $250 billion.
B) increase by $250 billion.
C) increase by $600 billion.
D) decrease by $400 billion.
Unlock Deck
Unlock for access to all 130 flashcards in this deck.
Unlock Deck
k this deck
15
The marginal propensity to consume is the increase in consumer spending when _____ increase(s)by $1.
A) investment spending
B) taxes
C) disposable income
D) savings
A) investment spending
B) taxes
C) disposable income
D) savings
Unlock Deck
Unlock for access to all 130 flashcards in this deck.
Unlock Deck
k this deck
16
The marginal propensity to consume is:
A) increasing if the marginal propensity to save is increasing.
B) the proportion of total disposable income that the average family saves.
C) the change in consumer spending divided by the change in aggregate disposable income.
D) the change in consumer spending minus the change in aggregate disposable income.
Unlock Deck
Unlock for access to all 130 flashcards in this deck.
Unlock Deck
k this deck
17
In a simple,closed economy (no government or foreign sector),if disposable income increases by $100 and $70 is consumed,_____ is saved.
A) $30
B) $70
C) $100
D) $170
A) $30
B) $70
C) $100
D) $170
Unlock Deck
Unlock for access to all 130 flashcards in this deck.
Unlock Deck
k this deck
18
If the marginal propensity to save is small,it will:
A) make the multiplier smaller.
B) make the multiplier larger.
C) not affect the value of the multiplier.
D) increase the interest rate.
A) make the multiplier smaller.
B) make the multiplier larger.
C) not affect the value of the multiplier.
D) increase the interest rate.
Unlock Deck
Unlock for access to all 130 flashcards in this deck.
Unlock Deck
k this deck
19
If the multiplier is 4 and investment spending falls by $100 billion,the change in real GDP will be:
A) -$400 billion.
B) $400 billion.
C) $25 billion.
D) -$25 billion.
A) -$400 billion.
B) $400 billion.
C) $25 billion.
D) -$25 billion.
Unlock Deck
Unlock for access to all 130 flashcards in this deck.
Unlock Deck
k this deck
20
Suppose that the Canadian economy is in a severe recession.Most households are trying to save more of their income than before.This increase in private savings will lead to:
A) an increase in real GDP,as more savings means more funds for business investment.
B) a fall in real GDP,as more savings means people will spend less.
C) no change in real GDP,because there is no savings multiplier.
D) an increase in real GDP,as an increase in savings will make people wealthier.
A) an increase in real GDP,as more savings means more funds for business investment.
B) a fall in real GDP,as more savings means people will spend less.
C) no change in real GDP,because there is no savings multiplier.
D) an increase in real GDP,as an increase in savings will make people wealthier.
Unlock Deck
Unlock for access to all 130 flashcards in this deck.
Unlock Deck
k this deck
21
In a simple,closed economy (no government or foreign sector),if disposable income increases by $1 000 and consumption increases by $600,the marginal propensity to consume is:
A) $600.
B) $400.
C) 1.67.
D) 0.60.
A) $600.
B) $400.
C) 1.67.
D) 0.60.
Unlock Deck
Unlock for access to all 130 flashcards in this deck.
Unlock Deck
k this deck
22
In a simple,closed economy (no government or foreign sector),if the marginal propensity to save decreases,the marginal propensity to consume will:
A) increase.
B) decrease.
C) remain constant.
D) fluctuate randomly.
A) increase.
B) decrease.
C) remain constant.
D) fluctuate randomly.
Unlock Deck
Unlock for access to all 130 flashcards in this deck.
Unlock Deck
k this deck
23
In a simple,closed economy (no government or foreign sector),if the marginal propensity to consume increases,the marginal propensity to save will:
A) increase.
B) decrease.
C) remain constant.
D) fluctuate randomly.
A) increase.
B) decrease.
C) remain constant.
D) fluctuate randomly.
Unlock Deck
Unlock for access to all 130 flashcards in this deck.
Unlock Deck
k this deck
24
Use the following to answer questions:
(Figure: Planned Aggregate Expenditures Curve II)Use Figure: Planned Aggregate Expenditures Curve II.Suppose that the consumption function in this figure rises by $100.The planned aggregate expenditures curve would shift upwards by:
A) $100.
B) $250.
C) $100 times the multiplier.
D) $150.
(Figure: Planned Aggregate Expenditures Curve II)Use Figure: Planned Aggregate Expenditures Curve II.Suppose that the consumption function in this figure rises by $100.The planned aggregate expenditures curve would shift upwards by:
A) $100.
B) $250.
C) $100 times the multiplier.
D) $150.
Unlock Deck
Unlock for access to all 130 flashcards in this deck.
Unlock Deck
k this deck
25
In a simple,closed economy (no government or foreign sector),if the marginal propensity to consume is 0.7,the marginal propensity to save must be:
A) 1.7.
B) 0.7.
C) 0.3.
D) 0.21.
A) 1.7.
B) 0.7.
C) 0.3.
D) 0.21.
Unlock Deck
Unlock for access to all 130 flashcards in this deck.
Unlock Deck
k this deck
26
In a simple,closed economy (no government or foreign sector),disposable income increases from $2 000 to $3 000.If consumption increases from $1 500 to $2 100,the marginal propensity to consume is:
A) $600.
B) 0.71.
C) 0.60.
D) 0.50.
A) $600.
B) 0.71.
C) 0.60.
D) 0.50.
Unlock Deck
Unlock for access to all 130 flashcards in this deck.
Unlock Deck
k this deck
27
Use the following to answer questions:
(Figure: Planned Aggregate Expenditures Curve II)Use Figure: Planned Aggregate Expenditures Curve II.The slope of the planned aggregate expenditures curve is:
A) 0.25.
B) 0.5.
C) 0.6.
D) 45 degrees.
(Figure: Planned Aggregate Expenditures Curve II)Use Figure: Planned Aggregate Expenditures Curve II.The slope of the planned aggregate expenditures curve is:
A) 0.25.
B) 0.5.
C) 0.6.
D) 45 degrees.
Unlock Deck
Unlock for access to all 130 flashcards in this deck.
Unlock Deck
k this deck
28
A $70 million decrease in investment spending will cause real GDP to:
A) decrease by $70 million.
B) increase by $70 million.
C) decrease by less than $70 million.
D) decrease by more than $70 million.
A) decrease by $70 million.
B) increase by $70 million.
C) decrease by less than $70 million.
D) decrease by more than $70 million.
Unlock Deck
Unlock for access to all 130 flashcards in this deck.
Unlock Deck
k this deck
29
Use the following to answer questions:
(Figure: Planned Aggregate Expenditures Curve II)Use Figure: Planned Aggregate Expenditures Curve II.Suppose that the consumption function in this economy rises by $200.Equilibrium real GDP would rise by:
A) $100.
B) $200.
C) $250.
D) $500.
(Figure: Planned Aggregate Expenditures Curve II)Use Figure: Planned Aggregate Expenditures Curve II.Suppose that the consumption function in this economy rises by $200.Equilibrium real GDP would rise by:
A) $100.
B) $200.
C) $250.
D) $500.
Unlock Deck
Unlock for access to all 130 flashcards in this deck.
Unlock Deck
k this deck
30
An initial change in the desired level of spending by firms,households,or government at a given level of real GDP is a(n):
A) autonomous change in aggregate expenditure.
B) multiplier-induced change in spending.
C) endogenous spending.
D) budget surplus.
A) autonomous change in aggregate expenditure.
B) multiplier-induced change in spending.
C) endogenous spending.
D) budget surplus.
Unlock Deck
Unlock for access to all 130 flashcards in this deck.
Unlock Deck
k this deck
31
Use the following to answer questions:
(Figure: Planned Aggregate Expenditures Curve II)Use Figure: Planned Aggregate Expenditures Curve II.Suppose that the consumption function rises by $100.The equilibrium level of real GDP would rise by:
A) $100.
B) $200.
C) $250.
D) $50.
(Figure: Planned Aggregate Expenditures Curve II)Use Figure: Planned Aggregate Expenditures Curve II.Suppose that the consumption function rises by $100.The equilibrium level of real GDP would rise by:
A) $100.
B) $200.
C) $250.
D) $50.
Unlock Deck
Unlock for access to all 130 flashcards in this deck.
Unlock Deck
k this deck
32
A $50 million increase in investment spending will eventually cause equilibrium real GDP to:
A) decrease by $50 million.
B) increase by $50 million.
C) increase by more than $50 million.
D) increase by less than $50 million.
A) decrease by $50 million.
B) increase by $50 million.
C) increase by more than $50 million.
D) increase by less than $50 million.
Unlock Deck
Unlock for access to all 130 flashcards in this deck.
Unlock Deck
k this deck
33
In a simple,closed economy (no government or foreign sector),if disposable income increases by $100 and $30 is saved,_____ is consumed.
A) $30
B) $70
C) $100
D) $170
A) $30
B) $70
C) $100
D) $170
Unlock Deck
Unlock for access to all 130 flashcards in this deck.
Unlock Deck
k this deck
34
In a simple,closed economy (no government or foreign sector),if disposable income increases by $1000 and consumption increases by $600,the marginal propensity to save is:
A) $600.
B) $400.
C) 2.5.
D) 0.40.
A) $600.
B) $400.
C) 2.5.
D) 0.40.
Unlock Deck
Unlock for access to all 130 flashcards in this deck.
Unlock Deck
k this deck
35
In a simple,closed economy (no government or foreign sector),if the marginal propensity to save is 0.2,the marginal propensity to consume must be:
A) 0.2.
B) 0.8.
C) 1.2.
D) 0.16.
A) 0.2.
B) 0.8.
C) 1.2.
D) 0.16.
Unlock Deck
Unlock for access to all 130 flashcards in this deck.
Unlock Deck
k this deck
36
Use the following to answer questions:
(Figure: Planned Aggregate Expenditures Curve II)Use Figure: Planned Aggregate Expenditures Curve II.The multiplier is:
A) 1.0.
B) 2.0.
C) 2.5.
D) 5.0.
(Figure: Planned Aggregate Expenditures Curve II)Use Figure: Planned Aggregate Expenditures Curve II.The multiplier is:
A) 1.0.
B) 2.0.
C) 2.5.
D) 5.0.
Unlock Deck
Unlock for access to all 130 flashcards in this deck.
Unlock Deck
k this deck
37
Use the following to answer questions:
(Figure: Planned Aggregate Expenditures Curve II)Use Figure: Planned Aggregate Expenditures Curve II.The equilibrium level of real GDP in the planned aggregate expenditure model shown in this figure is:
A) $800.
B) $1 000.
C) $2 000.
D) $4 000.
(Figure: Planned Aggregate Expenditures Curve II)Use Figure: Planned Aggregate Expenditures Curve II.The equilibrium level of real GDP in the planned aggregate expenditure model shown in this figure is:
A) $800.
B) $1 000.
C) $2 000.
D) $4 000.
Unlock Deck
Unlock for access to all 130 flashcards in this deck.
Unlock Deck
k this deck
38
In a simple,closed economy (no government or foreign sector),disposable income increases from $2 000 to $3 000.If consumption increases from $1 500 to $2 100,the marginal propensity to save is:
A) $600.
B) $400.
C) 0.80.
D) 0.40.
A) $600.
B) $400.
C) 0.80.
D) 0.40.
Unlock Deck
Unlock for access to all 130 flashcards in this deck.
Unlock Deck
k this deck
39
In a simple,closed economy (no government or foreign sector),if disposable income increases by $1 000 and consumption increases by $600,the multiplier is:
A) $600.
B) 0.6.
C) 2.5.
D) 0.40.
A) $600.
B) 0.6.
C) 2.5.
D) 0.40.
Unlock Deck
Unlock for access to all 130 flashcards in this deck.
Unlock Deck
k this deck
40
Use the following to answer questions:
(Figure: Planned Aggregate Expenditures Curve III)Use Figure: Planned Aggregate Expenditures Curve III.Suppose that the consumption function in this figure rises by $100.The planned aggregate expenditures curve will shift upwards by:
A) $100.
B) $400.
C) $100 times the multiplier.
D) $200 times the multiplier.
Unlock Deck
Unlock for access to all 130 flashcards in this deck.
Unlock Deck
k this deck
41
Use the following to answer questions:
(Figure: The Aggregate Consumption Function and Planned Aggregate Expenditure)Use Figure: The Aggregate Consumption Function and Planned Aggregate Expenditure.If expected disposable income increases,then the:
A) planned aggregate expenditure curve will shift up.
B) planned aggregate expenditure curve will shift down.
C) economy will move upwards along the planned aggregate expenditure curve.
D) economy will move downwards along the planned aggregate expenditure curve.
Unlock Deck
Unlock for access to all 130 flashcards in this deck.
Unlock Deck
k this deck
42
In a simple,closed economy (no government or foreign sector),any disposable income that is not consumed is saved.
Unlock Deck
Unlock for access to all 130 flashcards in this deck.
Unlock Deck
k this deck
43
In a simple,closed economy (no government or foreign sector),if disposable income increases by $500 and $450 is consumed,$950 is saved.
Unlock Deck
Unlock for access to all 130 flashcards in this deck.
Unlock Deck
k this deck
44
Use the following to answer questions:
(Figure: The Aggregate Consumption Function and Planned Aggregate Expenditure)Use Figure: The Aggregate Consumption Function and Planned Aggregate Expenditure.If aggregate wealth increases,the:
A) planned aggregate expenditure curve will shift up.
B) planned aggregate expenditure curve will shift down.
C) economy will move upwards along the planned aggregate expenditure curve.
D) economy will move downwards along the planned aggregate expenditure curve.
Unlock Deck
Unlock for access to all 130 flashcards in this deck.
Unlock Deck
k this deck
45
A $200 million increase in investment spending will increase real GDP by more than $200 million.
Unlock Deck
Unlock for access to all 130 flashcards in this deck.
Unlock Deck
k this deck
46
A $200 million increase in investment spending will increase real GDP by exactly $200 million.
Unlock Deck
Unlock for access to all 130 flashcards in this deck.
Unlock Deck
k this deck
47
Use the following to answer questions:
(Figure: The Aggregate Consumption Function and Planned Aggregate Expenditure)Use Figure: The Aggregate Consumption Function and Planned Aggregate Expenditure.If disposable income decreases,then the:
A) planned aggregate expenditure curve will shift up.
B) planned aggregate expenditure curve will shift down.
C) economy will move upwards along the planned aggregate expenditure curve.
D) economy will move downwards along the planned aggregate expenditure curve.
Unlock Deck
Unlock for access to all 130 flashcards in this deck.
Unlock Deck
k this deck
48
Use the following to answer questions:
(Figure: The Aggregate Consumption Function and Planned Aggregate Expenditure)Use Figure: The Aggregate Consumption Function and Planned Aggregate Expenditure.If current disposable income increases in this economy,then the:
A) planned aggregate expenditure curve will shift up.
B) planned aggregate expenditure curve will shift down.
C) economy will move upwards along the planned aggregate expenditure curve.
D) economy will move downwards along the planned aggregate expenditure curve.
Unlock Deck
Unlock for access to all 130 flashcards in this deck.
Unlock Deck
k this deck
49
From 2010 to 2012,Alberta's economy grew at an annual growth rate of 17%,more than 5 times the growth of the Canadian economy as a whole,due to rapid growth in its biotechnology sector.
Unlock Deck
Unlock for access to all 130 flashcards in this deck.
Unlock Deck
k this deck
50
Use the following to answer questions:
The digital revolution led to a decline in Finnish paper exports.
The digital revolution led to a decline in Finnish paper exports.
Unlock Deck
Unlock for access to all 130 flashcards in this deck.
Unlock Deck
k this deck
51
The marginal propensity to save is the increase in household savings when investment spending increases by $1.
Unlock Deck
Unlock for access to all 130 flashcards in this deck.
Unlock Deck
k this deck
52
A $600 million decrease in investment spending will decrease real GDP by more than $600 million.
Unlock Deck
Unlock for access to all 130 flashcards in this deck.
Unlock Deck
k this deck
53
Use the following to answer questions:
(Figure: The Aggregate Consumption Function and Planned Aggregate Expenditure)Use Figure: The Aggregate Consumption Function and Planned Aggregate Expenditure.If expected disposable income decreases in this economy,then the:
A) planned aggregate expenditure curve will shift up.
B) planned aggregate expenditure curve will shift down.
C) economy will move upwards along the planned aggregate expenditure curve.
D) economy will move downwards along the planned aggregate expenditure curve.
Unlock Deck
Unlock for access to all 130 flashcards in this deck.
Unlock Deck
k this deck
54
A $300 million decrease in investment spending will increase real GDP by more than $300 million.
Unlock Deck
Unlock for access to all 130 flashcards in this deck.
Unlock Deck
k this deck
55
Use the following to answer questions:
(Figure: The Aggregate Consumption Function and Planned Aggregate Expenditure)Use Figure: The Aggregate Consumption Function and Planned Aggregate Expenditure.If aggregate wealth decreases,then the:
A) planned aggregate expenditure curve will shift up.
B) planned aggregate expenditure curve will shift down.
C) economy will move upwards along the planned aggregate expenditure curve.
D) economy will move downwards along the planned aggregate expenditure curve.
Unlock Deck
Unlock for access to all 130 flashcards in this deck.
Unlock Deck
k this deck
56
From 2010 to 2012,Alberta's economy grew at an annual growth rate of 22%,more than 5 times the growth of the Canadian economy as a whole due to the mining of shale.
Unlock Deck
Unlock for access to all 130 flashcards in this deck.
Unlock Deck
k this deck
57
Use the following to answer questions:
(Figure: Planned Aggregate Expenditures Curve III)Use Figure: Planned Aggregate Expenditures Curve III.Suppose that the consumption function shifts upwards by $100.Equilibrium real GDP will rise by:
A) $100.
B) $400.
C) $800.
D) $3 200.
(Figure: Planned Aggregate Expenditures Curve III)Use Figure: Planned Aggregate Expenditures Curve III.Suppose that the consumption function shifts upwards by $100.Equilibrium real GDP will rise by:
A) $100.
B) $400.
C) $800.
D) $3 200.
Unlock Deck
Unlock for access to all 130 flashcards in this deck.
Unlock Deck
k this deck
58
Finland's real GDP per capita grew rapidly in 2008 due to Nokia's ability to innovate and stay ahead of its competition.
Unlock Deck
Unlock for access to all 130 flashcards in this deck.
Unlock Deck
k this deck
59
In a simple,closed economy (no government or foreign sector),if disposable income increases by $500 and $450 is consumed,$50 is saved.
Unlock Deck
Unlock for access to all 130 flashcards in this deck.
Unlock Deck
k this deck
60
The marginal propensity to consume is the increase in consumer spending when disposable income increases by $1.
Unlock Deck
Unlock for access to all 130 flashcards in this deck.
Unlock Deck
k this deck
61
If the marginal propensity to consume is 0.9,the multiplier will be 0.1.
Unlock Deck
Unlock for access to all 130 flashcards in this deck.
Unlock Deck
k this deck
62
If the marginal propensity to save decreases,the multiplier will increase.
Unlock Deck
Unlock for access to all 130 flashcards in this deck.
Unlock Deck
k this deck
63
If the marginal propensity to save is 0.25 in an economy with no taxes and no imports,the marginal propensity to consume is 0.75.
Unlock Deck
Unlock for access to all 130 flashcards in this deck.
Unlock Deck
k this deck
64
In an economy with no taxes and no imports,disposable income increases from $1 000 to $2 000.If consumption increases from $800 to $1 500,the marginal propensity to save is 0.3.
Unlock Deck
Unlock for access to all 130 flashcards in this deck.
Unlock Deck
k this deck
65
If the marginal propensity to consume is 0.9 and investment spending increases by $50 billion,the change in real GDP will be $5 billion.
Unlock Deck
Unlock for access to all 130 flashcards in this deck.
Unlock Deck
k this deck
66
Autonomous expenditure occurs in the second round of expenditure increases caused by the multiplier.
Unlock Deck
Unlock for access to all 130 flashcards in this deck.
Unlock Deck
k this deck
67
In an economy with no taxes or imports,if disposable income decreases by $2 000 and consumption decreases by $1 400,the multiplier is 7.
Unlock Deck
Unlock for access to all 130 flashcards in this deck.
Unlock Deck
k this deck
68
In an economy with no taxes and no imports,disposable income increases from $1 000 to $2 000.If consumption increases from $800 to $1 500,the multiplier is 3.33.
Unlock Deck
Unlock for access to all 130 flashcards in this deck.
Unlock Deck
k this deck
69
In an economy with no taxes and no imports,disposable income increases from $1 000 to $2 000.If consumption increases from $800 to $1 500,the marginal propensity to save is 0.25.
Unlock Deck
Unlock for access to all 130 flashcards in this deck.
Unlock Deck
k this deck
70
If the marginal propensity to save is 0.25 in an economy with no taxes and no imports,the marginal propensity to consume is 1.25.
Unlock Deck
Unlock for access to all 130 flashcards in this deck.
Unlock Deck
k this deck
71
In an economy with no taxes or imports,if disposable income decreases by $2 000 and consumption decreases by $1 500,the multiplier is -4.
Unlock Deck
Unlock for access to all 130 flashcards in this deck.
Unlock Deck
k this deck
72
In an economy with no taxes or imports,if disposable income increases by $2 000 and consumption increases by $1 400,the marginal propensity to save is 0.21.
Unlock Deck
Unlock for access to all 130 flashcards in this deck.
Unlock Deck
k this deck
73
Autonomous expenditure is an initial change in the desired level of expenditure by firms,households,or government at a given level of real GDP.
Unlock Deck
Unlock for access to all 130 flashcards in this deck.
Unlock Deck
k this deck
74
In an economy with no taxes or imports,if disposable income decreases by $2 000 and consumption decreases by $1 400,the marginal propensity to save is 0.3.
Unlock Deck
Unlock for access to all 130 flashcards in this deck.
Unlock Deck
k this deck
75
In an economy with no taxes or imports,if the marginal propensity to consume increases,the marginal propensity to save will also increase.
Unlock Deck
Unlock for access to all 130 flashcards in this deck.
Unlock Deck
k this deck
76
In an economy with no taxes and no imports,disposable income increases from $1 000 to $2 000.If consumption increases from $800 to $1 500,the marginal propensity to consume is 0.7.
Unlock Deck
Unlock for access to all 130 flashcards in this deck.
Unlock Deck
k this deck
77
In an economy with no taxes or imports,if disposable income decreases by $2 000 and consumption decreases by $1 500,the marginal propensity to consume is -0.25.
Unlock Deck
Unlock for access to all 130 flashcards in this deck.
Unlock Deck
k this deck
78
If the marginal propensity to consume decreases,the multiplier will increase.
Unlock Deck
Unlock for access to all 130 flashcards in this deck.
Unlock Deck
k this deck
79
If the marginal propensity to save is 0.2,the multiplier will be 5.
Unlock Deck
Unlock for access to all 130 flashcards in this deck.
Unlock Deck
k this deck
80
In an economy with no taxes or imports,if the marginal propensity to consume increases,the marginal propensity to save will decrease.
Unlock Deck
Unlock for access to all 130 flashcards in this deck.
Unlock Deck
k this deck
Unlock Deck
Unlock for access to all 130 flashcards in this deck.


