Deck 7: Crosstab Tables
Question
Question
Question
Question
Question
Question
Question
Question
Question
Question
Question
Question
Question
Question
Question
Question
Question
Question
Question
Question
Question
Question
Question
Question
Question
Question
Question
Question
Question
Question
Question
Question
Question
Question
Question
Question
Question

Unlock Deck
Sign up to unlock the cards in this deck!
Unlock Deck
Unlock Deck
1/37
Play
Full screen (f)
Deck 7: Crosstab Tables
1
In the following Crosstabs, what is the modal class of persons currently married?
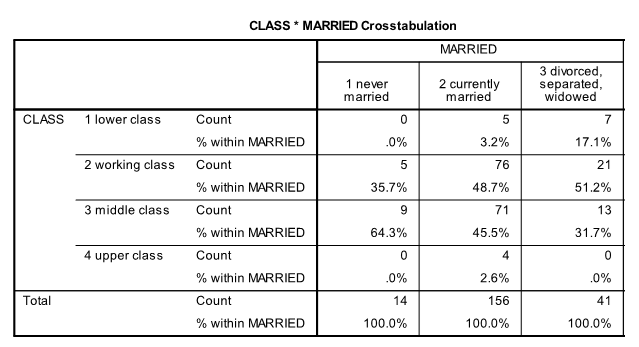
A) lower class
B) working class
C) 48.7%
D) 45.5%

A) lower class
B) working class
C) 48.7%
D) 45.5%
working class
2
In the CROSSTABS procedure, the lowest level of measurement that the column variable can be is
A) nominal
B) ordinal
C) interval/ratio
A) nominal
B) ordinal
C) interval/ratio
nominal
3
In the following Crosstabs, what is the median political orientation of males?
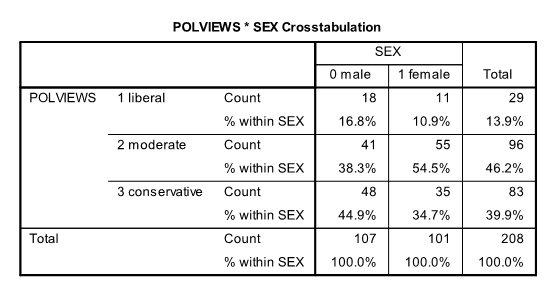
A) moderate
B) liberal
C) 38.3%
D) 55.1%

A) moderate
B) liberal
C) 38.3%
D) 55.1%
moderate
4
A crosstab is created with the independent variable as the column variable and the dependent variable as the row variable. In order to determine the effect of the independent variable on the dependent variable, should you use
A) column percentages
B) row percentages
C) total percentages
D) it doesn't matter which percentages you use
A) column percentages
B) row percentages
C) total percentages
D) it doesn't matter which percentages you use

Unlock Deck
Unlock for access to all 37 flashcards in this deck.
Unlock Deck
k this deck
5
In the following Crosstabs, what percent of 2010 GSS young adults are conservative?
A) 92
B) 23.8%
C) 27.9%
D) 7.5%
A) 92
B) 23.8%
C) 27.9%
D) 7.5%

Unlock Deck
Unlock for access to all 37 flashcards in this deck.
Unlock Deck
k this deck
6
In the following Crosstabs, a number has been replaced with xxx. What number should go there?
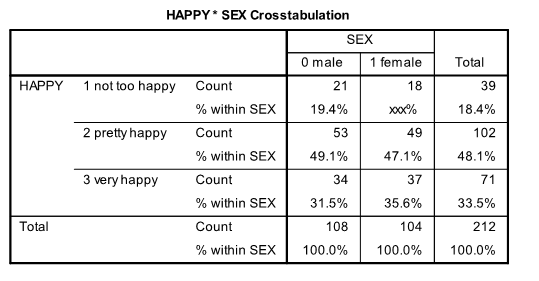
A) 8.5
B) 17.3
C) 46.2
D) 80.6

A) 8.5
B) 17.3
C) 46.2
D) 80.6

Unlock Deck
Unlock for access to all 37 flashcards in this deck.
Unlock Deck
k this deck
7
In the following Crosstabs, what is the most common political orientation of males?
A) moderate
B) conservative
C) 38.3%
D) 44.9%
A) moderate
B) conservative
C) 38.3%
D) 44.9%

Unlock Deck
Unlock for access to all 37 flashcards in this deck.
Unlock Deck
k this deck
8
The following Crosstab supports which conclusion about the cases in the data set?
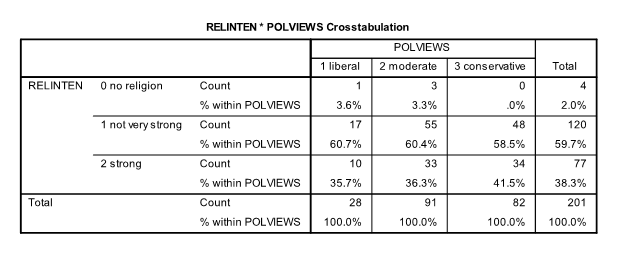
A) Of those who have no religion, 3.6% are liberals.
B) The median level of attachment to a religion for moderates is strong.
C) Of the three political orientations, conservatives are the most likely to report a strong attachment to a religion.
D) The most common level of attachment to a religion for conservatives was strong.

Unlock Deck
Unlock for access to all 37 flashcards in this deck.
Unlock Deck
k this deck
9
In the CROSSTABS procedure, the lowest level of measurement that the row variable can be is
A) nominal
B) ordinal
C) interval/ratio
A) nominal
B) ordinal
C) interval/ratio

Unlock Deck
Unlock for access to all 37 flashcards in this deck.
Unlock Deck
k this deck
10
In the following Crosstabs, a number has been replaced with xxx. What number should go there?
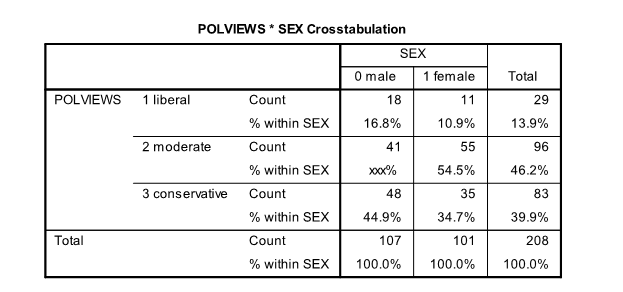
A) 19.7
B) 38.3
C) 42.7
D) 50.4

A) 19.7
B) 38.3
C) 42.7
D) 50.4

Unlock Deck
Unlock for access to all 37 flashcards in this deck.
Unlock Deck
k this deck
11
In the following Crosstabs, the percents labeled "% within POLVIEWS" are
A) cell counts
B) column percents
C) row percents
D) table percents
A) cell counts
B) column percents
C) row percents
D) table percents

Unlock Deck
Unlock for access to all 37 flashcards in this deck.
Unlock Deck
k this deck
12
The following clustered bar chart supports which conclusion about the cases in the data set?
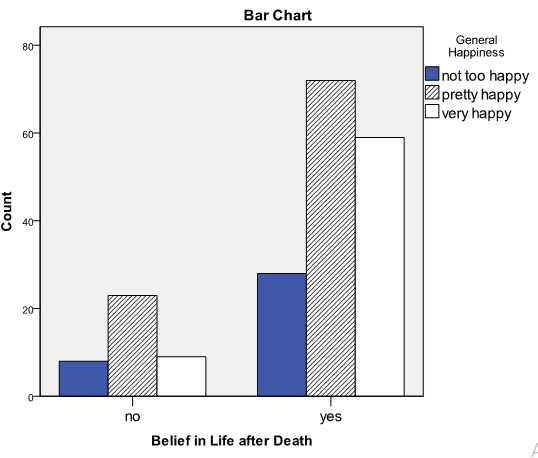
A) There were more persons who believed in life after death than persons who did not.
B) There are more very happy persons who do not believe in life after death than very happy persons who do believe in life after death.
C) The median level of happiness for persons who believe in life after death is very happy.
D) The most common level of happiness for both those who do believe in life after death and those who don't is very happy.

Unlock Deck
Unlock for access to all 37 flashcards in this deck.
Unlock Deck
k this deck
13
In the following Crosstabs, a number has been replaced with xxx. What number should go there?
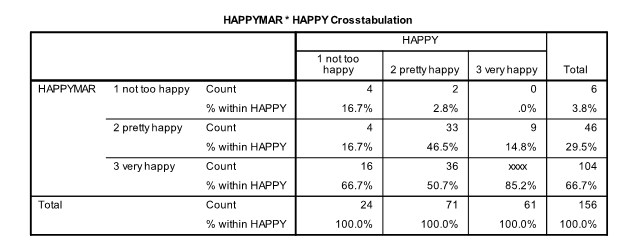
A) 9
B) 52
C) 68
D) 85

A) 9
B) 52
C) 68
D) 85

Unlock Deck
Unlock for access to all 37 flashcards in this deck.
Unlock Deck
k this deck
14
In a Crosstab table, a row percentage tells you
A) the percent of cases in that cell that are in that cell
B) the percent of cases in that column that are in that cell
C) the percent of cases in that row that are in that cell
D) the percent of cases in the entire table that are in that cell
A) the percent of cases in that cell that are in that cell
B) the percent of cases in that column that are in that cell
C) the percent of cases in that row that are in that cell
D) the percent of cases in the entire table that are in that cell

Unlock Deck
Unlock for access to all 37 flashcards in this deck.
Unlock Deck
k this deck
15
The following Crosstab supports which conclusion about the cases in the data set?
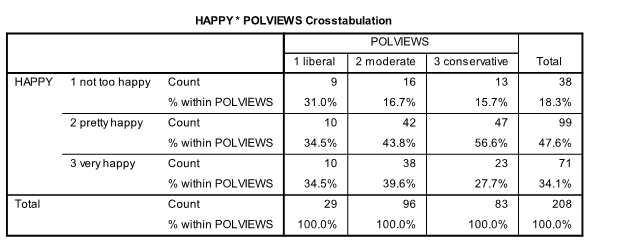
A) Liberals made up the largest share of those who were not too happy.
B) The median response of moderates was not too happy.
C) The median response of moderates was very happy.
D) The median response of conservatives was pretty happy.

A) Liberals made up the largest share of those who were not too happy.
B) The median response of moderates was not too happy.
C) The median response of moderates was very happy.
D) The median response of conservatives was pretty happy.

Unlock Deck
Unlock for access to all 37 flashcards in this deck.
Unlock Deck
k this deck
16
Which is the layering variable in the following crosstab??
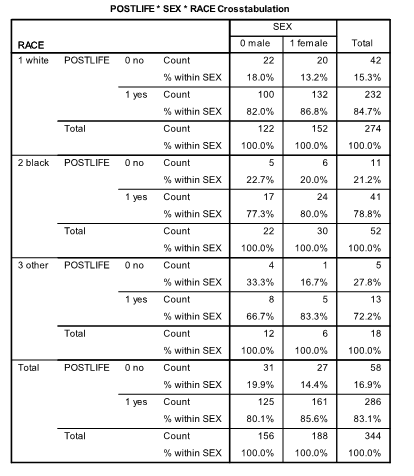
A) POSTLIFE
B) RACE
C) SEX
D) There is no layering variable.
Multiple-Choice Questions from Online Student Quizzes

A) POSTLIFE
B) RACE
C) SEX
D) There is no layering variable.
Multiple-Choice Questions from Online Student Quizzes

Unlock Deck
Unlock for access to all 37 flashcards in this deck.
Unlock Deck
k this deck
17
If you combine all four groups together in the following Crosstabs, which political orientation is the largest?
A) liberals
B) moderates
C) conservatives
D) all three are equally large
A) liberals
B) moderates
C) conservatives
D) all three are equally large

Unlock Deck
Unlock for access to all 37 flashcards in this deck.
Unlock Deck
k this deck
18
If you create a Crosstab with GENDER as the column variable, RACE as the row variable, and REGION as the layer variable, you will get separate crosstab tables for each
A) gender
B) race
C) region
D) gender by race by region combination
A) gender
B) race
C) region
D) gender by race by region combination

Unlock Deck
Unlock for access to all 37 flashcards in this deck.
Unlock Deck
k this deck
19
On the basis of the following Crosstabs, which group had the highest percentage that was liberal?
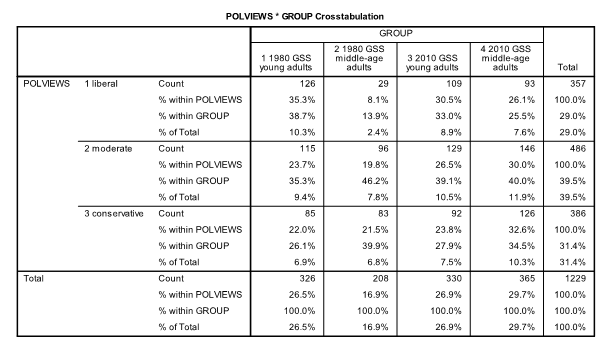
A) 1980 GSS young adults
B) 1980 GSS middle-age adults
C) 2010 GSS young adults
D) 2010 GSS middle-age adults

A) 1980 GSS young adults
B) 1980 GSS middle-age adults
C) 2010 GSS young adults
D) 2010 GSS middle-age adults

Unlock Deck
Unlock for access to all 37 flashcards in this deck.
Unlock Deck
k this deck
20
In the following Crosstabs, what is the median attachment to a religion of never-married persons? (RELINTEN is strength of attachment to a religion.)
A) no religion
B) not very strong
C) strong
D) total
A) no religion
B) not very strong
C) strong
D) total

Unlock Deck
Unlock for access to all 37 flashcards in this deck.
Unlock Deck
k this deck
21
Answer the questions that follow this SPSS output:
![<strong>Answer the questions that follow this SPSS output: </strong> A) What percent of Catholics believe abortion should not be available if the pregnancy is a result of rape? [Hint: you must calculate the answer.] __________ B) What is the median response of Protestants to the question of whether abortion should be available if a pregnancy is a result of rape? __________ C) What is the total number of cases included in this crosstabs? __________ D) If you wanted to assess the effect of the independent variable (Religious Affiliation) on the dependent variable (Whether abortion should be available), should you use row percents, column percents, or total percents? _______________](https://d2lvgg3v3hfg70.cloudfront.net/TB6020/11ecab74_3c89_e9e7_a32e_c16d7cfb16a1_TB6020_00.jpg)
A) What percent of Catholics believe abortion should not be available if the pregnancy is a result of rape? [Hint: you must calculate the answer.] __________
B) What is the median response of Protestants to the question of whether abortion should be available if a pregnancy is a result of rape? __________
C) What is the total number of cases included in this crosstabs? __________
D) If you wanted to assess the effect of the independent variable (Religious Affiliation) on the dependent variable (Whether abortion should be available), should you use row percents, column percents, or total percents? _______________

Unlock Deck
Unlock for access to all 37 flashcards in this deck.
Unlock Deck
k this deck
22
In a clustered bar chart, why should the cases be clustered by categories of the independent variable?

Unlock Deck
Unlock for access to all 37 flashcards in this deck.
Unlock Deck
k this deck
23
What conclusions about the job satisfaction of never-married, currently-married, and previously-married persons can you draw from the following clustered bar chart?
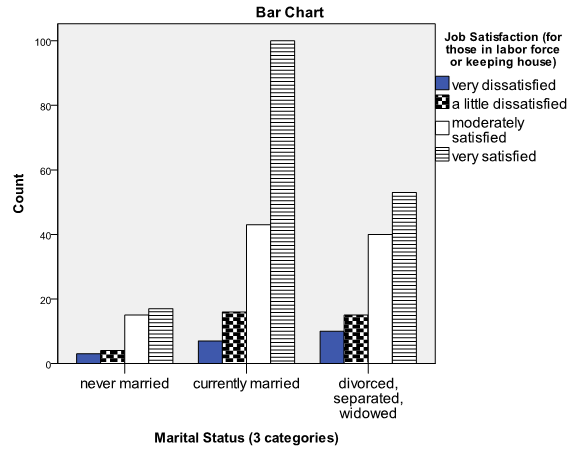


Unlock Deck
Unlock for access to all 37 flashcards in this deck.
Unlock Deck
k this deck
24
You want to compare groups on a nominal variable (for example, preferred Presidential candidate of students at different colleges). Which SPSS procedure should you run?
A) Crosstabs
B) Display Data File Information
C) Frequencies
D) Means
A) Crosstabs
B) Display Data File Information
C) Frequencies
D) Means

Unlock Deck
Unlock for access to all 37 flashcards in this deck.
Unlock Deck
k this deck
25
Answer the questions that follow this SPSS output:
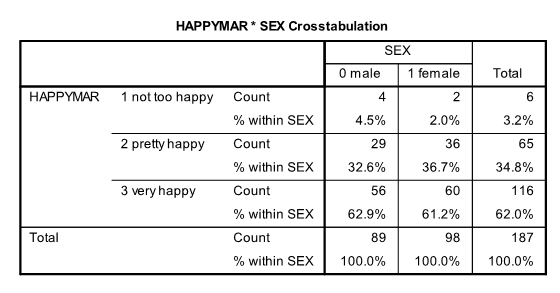
Someone makes the claim that women are happier than men with their marriage. (HAPPYMAR is happiness with one's marriage.)
A) Does the information in this table support the claim? (yes or no)
B) Support your conclusion by citing relevant (and only relevant) information from the table.

Someone makes the claim that women are happier than men with their marriage. (HAPPYMAR is happiness with one's marriage.)
A) Does the information in this table support the claim? (yes or no)
B) Support your conclusion by citing relevant (and only relevant) information from the table.

Unlock Deck
Unlock for access to all 37 flashcards in this deck.
Unlock Deck
k this deck
26
Answer the questions that follow this SPSS output:
![<strong>Answer the questions that follow this SPSS output: </strong> A) What percentage of those who have guns at home are white? [Hint: you must calculate the answer.] __________ B) What percentage of all the respondents represented in the table are blacks who have guns at home? [Hint: you must calculate the answer.] __________ C) If you wanted to assess the effect of the independent variable (race) on the dependent variable (do you have a gun at home?), should you use row percents, column percents, or total percents? _______________](https://d2lvgg3v3hfg70.cloudfront.net/TB6020/11ecab74_31e6_3846_a32e_4977e098167b_TB6020_00.jpg)
A) What percentage of those who have guns at home are white? [Hint: you must calculate the answer.] __________
B) What percentage of all the respondents represented in the table are blacks who have guns at home? [Hint: you must calculate the answer.] __________
C) If you wanted to assess the effect of the independent variable (race) on the dependent variable (do you have a gun at home?), should you use row percents, column percents, or total percents? _______________

Unlock Deck
Unlock for access to all 37 flashcards in this deck.
Unlock Deck
k this deck
27
What is the difference between a column percent and a row percent?

Unlock Deck
Unlock for access to all 37 flashcards in this deck.
Unlock Deck
k this deck
28
Answer the questions that follow this SPSS output:
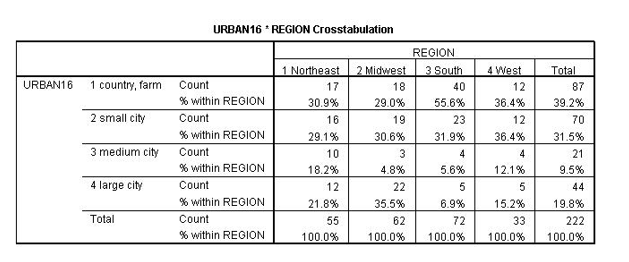
A) What percent of persons from the South were living in a large city when they were 16 years of age? __________
B) What was the modal response of persons from the South regarding where they were living when they were 16 years of age? __________
C) What was the median response of persons from the South regarding where they were living when they were 16 years of age? __________
D) What is the total number of cases from the South in this crosstabs? __________

Unlock Deck
Unlock for access to all 37 flashcards in this deck.
Unlock Deck
k this deck
29
Answer the questions that follow this SPSS output:
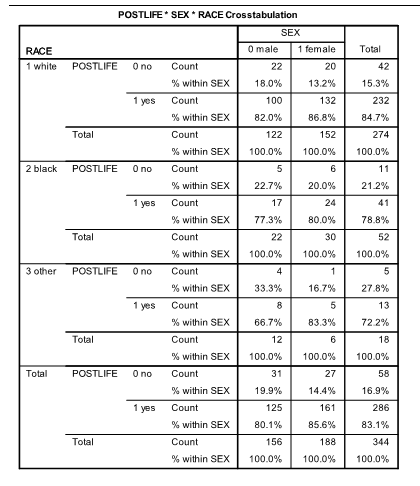
Describe how, if at all, the relationship between sex and belief in life after death (POSTLIFE) differs between whites, blacks, and persons neither white nor black.

Describe how, if at all, the relationship between sex and belief in life after death (POSTLIFE) differs between whites, blacks, and persons neither white nor black.

Unlock Deck
Unlock for access to all 37 flashcards in this deck.
Unlock Deck
k this deck
30
What kinds of questions can you answer using a crosstab table?

Unlock Deck
Unlock for access to all 37 flashcards in this deck.
Unlock Deck
k this deck
31
How can you use column percents to identify the median?

Unlock Deck
Unlock for access to all 37 flashcards in this deck.
Unlock Deck
k this deck
32
Answer the questions that follow this SPSS output:
![<strong>Answer the questions that follow this SPSS output: </strong> A) What percent of Catholics approve of women working? [Hint: you must calculate the answer.] __________ B) What percentage of all the respondents represented in the table are Catholics who disapprove of women working? [Hint: you must calculate the answer.] __________ C) If you wanted to assess the effect of the independent variable (RELIG) on the dependent variable (FEWORK), should you use row percents, column percents, or total percents? _______________](https://d2lvgg3v3hfg70.cloudfront.net/TB6020/11ecab74_20ae_90e5_a32e_b99eaaaee3e8_TB6020_00.jpg)
A) What percent of Catholics approve of women working? [Hint: you must calculate the answer.] __________
B) What percentage of all the respondents represented in the table are Catholics who disapprove of women working? [Hint: you must calculate the answer.] __________
C) If you wanted to assess the effect of the independent variable (RELIG) on the dependent variable (FEWORK), should you use row percents, column percents, or total percents? _______________

Unlock Deck
Unlock for access to all 37 flashcards in this deck.
Unlock Deck
k this deck
33
Answer the questions that follow this SPSS output:
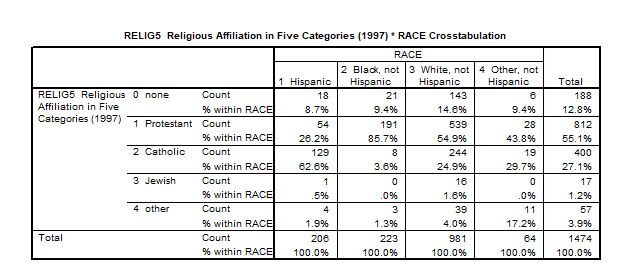
A) What percent of Hispanics are Catholic? __________
B) What is the total number of cases included in this crosstabs? __________
C) What is the modal religious affiliation of Blacks? _______________
D) What is the total number of Catholics in this crosstabs? __________

A) What percent of Hispanics are Catholic? __________
B) What is the total number of cases included in this crosstabs? __________
C) What is the modal religious affiliation of Blacks? _______________
D) What is the total number of Catholics in this crosstabs? __________

Unlock Deck
Unlock for access to all 37 flashcards in this deck.
Unlock Deck
k this deck
34
Why are column percents more useful than row percents for seeing if the column (independent) variable affects the row (dependent) variable?

Unlock Deck
Unlock for access to all 37 flashcards in this deck.
Unlock Deck
k this deck
35
Answer the questions that follow this SPSS output:
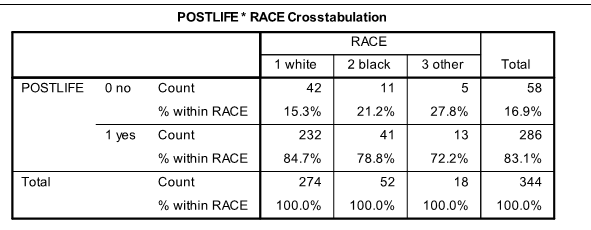
Someone makes the claim that blacks are more likely than whites to believe in an afterlife. (POSTLIFE is belief in an afterlife.)
A) Does the information in this table support the claim? (yes or no)
B) Support your conclusion by citing relevant (and only relevant) information from the table.

Someone makes the claim that blacks are more likely than whites to believe in an afterlife. (POSTLIFE is belief in an afterlife.)
A) Does the information in this table support the claim? (yes or no)
B) Support your conclusion by citing relevant (and only relevant) information from the table.

Unlock Deck
Unlock for access to all 37 flashcards in this deck.
Unlock Deck
k this deck
36
How can layering reveal if the relationship between the original two variables was spurious or not?

Unlock Deck
Unlock for access to all 37 flashcards in this deck.
Unlock Deck
k this deck
37
How can comparing percents indicate the independent variable's effect on the dependent variable?

Unlock Deck
Unlock for access to all 37 flashcards in this deck.
Unlock Deck
k this deck


