Deck 7: The Wealth of Nations and Economic Growth
Full screen (f)
Question
Question
Question
Question
Question
Question
Question
Question
Question
Question
Question
Question
Question
Question
Question
Question
Question
Question
Question
Question
Question
Question
Question
Question
Question
Question
Question
Question
Question
Question
Question
Question
Question
Question
Question
Question
Question
Question
Question
Question
Question
Use the following to answer questions
Figure: Economic Growth in Major World Regions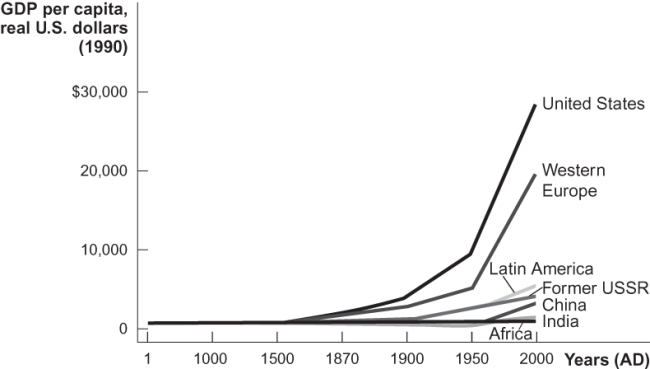
(Figure: Economic Growth in Major World Regions)Refer to the figure,which shows real GDP per capita over time in different regions of the world.The chart shows that all regions of the world:
A) were poor at one time.
B) have been relatively rich throughout most of human history.
C) have experienced moderate growth throughout most of human history.
D) remain poor today.
Question
Question
Question
Question
Question
Question
Question
Question
Question
Question
Question
Question
Question
Use the following to answer questions
Figure: The Distribution of World Income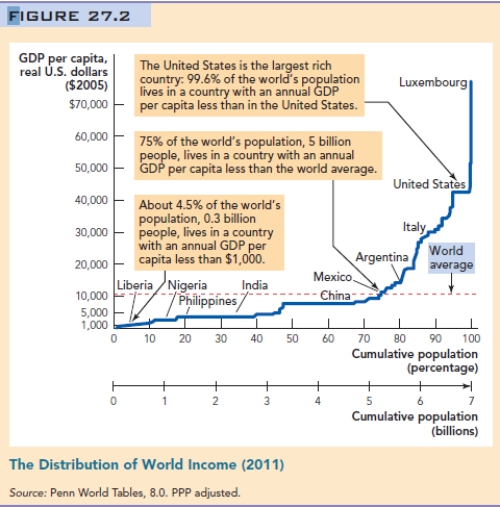
(Figure: The Distribution of World Income)Refer to the figure.Based on the data in the figure,about how many times wealthier is the richest country when compared to the poorest countries in the world?
A) 500 times
B) 100 times
C) 10 times
D) 30 times
Figure: The Distribution of World Income
(Figure: The Distribution of World Income)Refer to the figure.Based on the data in the figure,about how many times wealthier is the richest country when compared to the poorest countries in the world?
A) 500 times
B) 100 times
C) 10 times
D) 30 times
Question
Use the following to answer questions
Figure: The Distribution of World Income
What percentage of the world's population lives in a country that has a GDP per capita above the world average?
A) 10%
B) 20%
C) 50%
D) 75%
Figure: The Distribution of World Income
What percentage of the world's population lives in a country that has a GDP per capita above the world average?
A) 10%
B) 20%
C) 50%
D) 75%
Question
Use the following to answer questions
Figure: The Distribution of World Income
In the year 2011,the world's average per capita GDP was $10,515.What percent of the world's population lived in a country with per capita GDP that was below $10,515?
A) 20%
B) 40%
C) 50%
D) 80%
Figure: The Distribution of World Income
In the year 2011,the world's average per capita GDP was $10,515.What percent of the world's population lived in a country with per capita GDP that was below $10,515?
A) 20%
B) 40%
C) 50%
D) 80%
Question
Question
Question
Question
Use the following to answer questions
Figure: The Distribution of World Income
(Figure: The Distribution of World Income)Refer to the figure.Based on the data in the figure,living standards in the United States are about how many times higher than the world average?
A) 4 times
B) 10 times
C) 40 times
D) 50 times
Figure: The Distribution of World Income
(Figure: The Distribution of World Income)Refer to the figure.Based on the data in the figure,living standards in the United States are about how many times higher than the world average?
A) 4 times
B) 10 times
C) 40 times
D) 50 times
Question
Question
Question
Use the following to answer questions
Figure: Economic Growth in Major World Regions
(Figure: Economic Growth in Major World Regions)Refer to the figure,which shows real GDP per capita over time in different regions of the world.The chart shows that:
A) all regions of the world eventually achieved significant growth.
B) some regions of the world have always experienced growth.
C) significant growth has occurred in some regions only since 1950.
D) all regions of the world remain poor today.
Question
Use the following to answer questions
Figure: Economic Growth in Major World Regions
The United States and Western European countries began to experience accelerated economic growth during which century?
A) twelfth
B) sixteenth
C) seventeenth
D) nineteenth
Figure: Economic Growth in Major World Regions
The United States and Western European countries began to experience accelerated economic growth during which century?
A) twelfth
B) sixteenth
C) seventeenth
D) nineteenth
Question
Question
Question
Question
Question
Question
Question
Question
Use the following to answer questions
Figure: Economic Growth in Major World Regions
If real GDP per capita in the United States is currently $50,000 and grows at 2.5% per year,it will take approximately how many years to reach $200,000?
A) 28 years
B) 56 years
C) 84 years
D) 112 years
Figure: Economic Growth in Major World Regions
If real GDP per capita in the United States is currently $50,000 and grows at 2.5% per year,it will take approximately how many years to reach $200,000?
A) 28 years
B) 56 years
C) 84 years
D) 112 years
Question
Question
Question
Question
Question
Question
Question
Question
Use the following to answer questions
Figure: Economic Growth in Major World Regions
(Figure: Economic Growth in Major World Regions)Refer to the figure,which shows real GDP per capita over time in different regions of the world.The chart shows that living standards in different regions began to _____ at the beginning of the nineteenth century.
A) diverge
B) converge
C) equalize
D) fall

Unlock Deck
Sign up to unlock the cards in this deck!
Unlock Deck
Unlock Deck
1/269
Play
Full screen (f)
Deck 7: The Wealth of Nations and Economic Growth
1
Every year,1.8 million children in poor countries die of diarrhea.Which is most effective in preventing these deaths?
A) government subsidies
B) political reform
C) economic growth
D) humanitarian aid
A) government subsidies
B) political reform
C) economic growth
D) humanitarian aid
economic growth
2
Which statement best describes the cross-country evidence on the relationship between a nation's GDP per capita and standard measures of societal well-being?
A) GDP per capita is negatively related to measures of societal well-being.
B) GDP per capita is positively related to measures of societal well-being.
C) There is no relationship between GDP per capita and measures of societal well-being.
D) The relationship between GDP per capita and societal well-being is positive at times and negative at times.
GDP per capita is positively related to measures of societal well-being.
3
Data from countries around the world suggest that "health and wealth" (measured by infant survival rates and real GDP per capita)are:
A) positively related.
B) negatively related.
C) unrelated.
D) constant.
A) positively related.
B) negatively related.
C) unrelated.
D) constant.
positively related.
4
If real GDP per capita in a country was $14,000 in year 1 and $14,140 in year 2,then the economic growth rate for this country from year 1 to year 2 was:
A) 1%.
B) 2%.
C) 3%.
D) 4%.
A) 1%.
B) 2%.
C) 3%.
D) 4%.
Unlock Deck
Unlock for access to all 269 flashcards in this deck.
Unlock Deck
k this deck
5
When economists speak of "long-run economic growth," they mean increasing the:
A) real GDP of a country.
B) per capita real GDP of a country.
C) geographic size of a country.
D) population of a country.
A) real GDP of a country.
B) per capita real GDP of a country.
C) geographic size of a country.
D) population of a country.
Unlock Deck
Unlock for access to all 269 flashcards in this deck.
Unlock Deck
k this deck
6
A country's GDP per capita and infant survival rates usually are:
A) not correlated.
B) somewhat correlated.
C) strongly correlated.
D) correlated only in poor countries.
A) not correlated.
B) somewhat correlated.
C) strongly correlated.
D) correlated only in poor countries.
Unlock Deck
Unlock for access to all 269 flashcards in this deck.
Unlock Deck
k this deck
7
Beginning in the _____ century,economic growth became a clear trend in parts of the world.
A) sixteenth
B) seventeenth
C) eighteenth
D) nineteenth
A) sixteenth
B) seventeenth
C) eighteenth
D) nineteenth
Unlock Deck
Unlock for access to all 269 flashcards in this deck.
Unlock Deck
k this deck
8
Most of the world's population:
A) is poor relative to the United States.
B) is about as well off as the average person in the United States.
C) is wealthy relative to the United States.
D) cannot be compared to the United States.
A) is poor relative to the United States.
B) is about as well off as the average person in the United States.
C) is wealthy relative to the United States.
D) cannot be compared to the United States.
Unlock Deck
Unlock for access to all 269 flashcards in this deck.
Unlock Deck
k this deck
9
Piped water and flush toilets together can reduce infant mortality from diarrhea by approximately:
A) 20%.
B) 40%.
C) 60%.
D) 70% or more.
A) 20%.
B) 40%.
C) 60%.
D) 70% or more.
Unlock Deck
Unlock for access to all 269 flashcards in this deck.
Unlock Deck
k this deck
10
In general,increases in a country's wealth will cause infant survival rates to:
A) increase.
B) decrease.
C) remain unchanged.
D) become unpredictable.
A) increase.
B) decrease.
C) remain unchanged.
D) become unpredictable.
Unlock Deck
Unlock for access to all 269 flashcards in this deck.
Unlock Deck
k this deck
11
Wealthier countries have:
A) more conflicts,such as riots and civil wars.
B) higher infant mortality rates.
C) fewer educational opportunities.
D) more material goods.
A) more conflicts,such as riots and civil wars.
B) higher infant mortality rates.
C) fewer educational opportunities.
D) more material goods.
Unlock Deck
Unlock for access to all 269 flashcards in this deck.
Unlock Deck
k this deck
12
There is:
A) a strong positive correlation between per capita GDP and infant survival.
B) a weak positive correlation between per capita GDP and infant survival.
C) no correlation between per capita GDP and infant survival.
D) a weak negative correlation between per capita GDP and infant survival.
A) a strong positive correlation between per capita GDP and infant survival.
B) a weak positive correlation between per capita GDP and infant survival.
C) no correlation between per capita GDP and infant survival.
D) a weak negative correlation between per capita GDP and infant survival.
Unlock Deck
Unlock for access to all 269 flashcards in this deck.
Unlock Deck
k this deck
13
If real GDP per capita in a country was $14,000 in year 1 and $14,420 in year 2,then the economic growth rate for this country from year 1 to year 2 was:
A) 1%.
B) 2%.
C) 3%.
D) 4%.
A) 1%.
B) 2%.
C) 3%.
D) 4%.
Unlock Deck
Unlock for access to all 269 flashcards in this deck.
Unlock Deck
k this deck
14
If real GDP per capita in a country were $14,000 in year 1 and $14,280 in year 2,then the economic growth rate for this country from year 1 to year 2 was:
A) 1%.
B) 2%.
C) 3%.
D) 4%.
A) 1%.
B) 2%.
C) 3%.
D) 4%.
Unlock Deck
Unlock for access to all 269 flashcards in this deck.
Unlock Deck
k this deck
15
Wealthier nations tend to have:
A) better educational opportunities.
B) lower infant survival rates.
C) lower life expectancy rates.
D) fewer opportunities for leisure and entertainment.
A) better educational opportunities.
B) lower infant survival rates.
C) lower life expectancy rates.
D) fewer opportunities for leisure and entertainment.
Unlock Deck
Unlock for access to all 269 flashcards in this deck.
Unlock Deck
k this deck
16
For most of recorded human history,real GDP per capita has:
A) increased at a rapid rate.
B) increased at a modest rate.
C) remained about the same.
D) decreased at a modest rate.
A) increased at a rapid rate.
B) increased at a modest rate.
C) remained about the same.
D) decreased at a modest rate.
Unlock Deck
Unlock for access to all 269 flashcards in this deck.
Unlock Deck
k this deck
17
If real GDP per capita in a country was $14,000 in year 1 and $14,560 in year 2,then the economic growth rate for this country from year 1 to year 2 was:
A) 1%.
B) 2%.
C) 3%.
D) 4%.
A) 1%.
B) 2%.
C) 3%.
D) 4%.
Unlock Deck
Unlock for access to all 269 flashcards in this deck.
Unlock Deck
k this deck
18
Two thousand years ago,per capita GDP (in 2010 dollars)was:
A) less than $1,000.
B) about $10,000.
C) more than $50,000.
D) about the same as today.
A) less than $1,000.
B) about $10,000.
C) more than $50,000.
D) about the same as today.
Unlock Deck
Unlock for access to all 269 flashcards in this deck.
Unlock Deck
k this deck
19
Around the world,about one _____ people have incomes of less than $2 per day.
A) thousand
B) million
C) billion
D) trillion
A) thousand
B) million
C) billion
D) trillion
Unlock Deck
Unlock for access to all 269 flashcards in this deck.
Unlock Deck
k this deck
20
The correlation between infant mortality and real GDP per capita is:
A) zero.
B) positive.
C) negative.
D) unpredictable.
A) zero.
B) positive.
C) negative.
D) unpredictable.
Unlock Deck
Unlock for access to all 269 flashcards in this deck.
Unlock Deck
k this deck
21
At an annual growth rate of 3.5%,approximately how long does it take for real GDP per capita to increase from $30,000 to $60,000 in a country?
A) 5 years
B) 10 years
C) 15 years
D) 20 years
A) 5 years
B) 10 years
C) 15 years
D) 20 years
Unlock Deck
Unlock for access to all 269 flashcards in this deck.
Unlock Deck
k this deck
22
Roughly what percent of the world's population live in countries with per capita GDP lower than the average world per capita GDP?
A) 80%
B) 50%
C) 25%
D) 10%
A) 80%
B) 50%
C) 25%
D) 10%
Unlock Deck
Unlock for access to all 269 flashcards in this deck.
Unlock Deck
k this deck
23
Slow economic growth sustained over long periods produces:
A) small changes in per capita GDP.
B) large changes in per capita GDP.
C) no changes in per capita GDP.
D) unpredictable changes in GDP.
A) small changes in per capita GDP.
B) large changes in per capita GDP.
C) no changes in per capita GDP.
D) unpredictable changes in GDP.
Unlock Deck
Unlock for access to all 269 flashcards in this deck.
Unlock Deck
k this deck
24
Economic growth refers to the growth rate of:
A) personal income.
B) GNP.
C) GDP.
D) GDP per capita.
A) personal income.
B) GNP.
C) GDP.
D) GDP per capita.
Unlock Deck
Unlock for access to all 269 flashcards in this deck.
Unlock Deck
k this deck
25
If U.S.per capita GDP is $50,000 and grows at 5% per year,what will U.S.per capita GDP be in 70 years?
A) $400,000
B) $800,000
C) $1.2 million
D) $1.6 million
A) $400,000
B) $800,000
C) $1.2 million
D) $1.6 million
Unlock Deck
Unlock for access to all 269 flashcards in this deck.
Unlock Deck
k this deck
26
At an annual growth rate of 2%,approximately how long does it take for real GDP per capita to increase from $30,000 to $60,000 in a country?
A) 15 years
B) 25 years
C) 35 years
D) 45 years
A) 15 years
B) 25 years
C) 35 years
D) 45 years
Unlock Deck
Unlock for access to all 269 flashcards in this deck.
Unlock Deck
k this deck
27
According to the rule of 70,a country with an annual growth rate of 10% will double its GDP per capita in:
A) 70 years.
B) 10 years.
C) 7 years.
D) less than 1 year.
A) 70 years.
B) 10 years.
C) 7 years.
D) less than 1 year.
Unlock Deck
Unlock for access to all 269 flashcards in this deck.
Unlock Deck
k this deck
28
For most of recorded human history,long-run economic growth was:
A) much higher than it has been in recent decades.
B) the same as it is today.
C) the highest during the Dark Ages.
D) almost nonexistent.
A) much higher than it has been in recent decades.
B) the same as it is today.
C) the highest during the Dark Ages.
D) almost nonexistent.
Unlock Deck
Unlock for access to all 269 flashcards in this deck.
Unlock Deck
k this deck
29
At an annual growth rate of 1.4%,approximately how long does it take for real GDP per capita to increase from $30,000 to $60,000 in a country?
A) 50 years
B) 100 years
C) 200 years
D) 400 years
A) 50 years
B) 100 years
C) 200 years
D) 400 years
Unlock Deck
Unlock for access to all 269 flashcards in this deck.
Unlock Deck
k this deck
30
One key fact about economic growth around the world is that:
A) most poor countries lack natural resources.
B) all countries used to be poor.
C) growth has occurred throughout human history.
D) the dispersion of GDP per capita has become more equal across countries over time.
A) most poor countries lack natural resources.
B) all countries used to be poor.
C) growth has occurred throughout human history.
D) the dispersion of GDP per capita has become more equal across countries over time.
Unlock Deck
Unlock for access to all 269 flashcards in this deck.
Unlock Deck
k this deck
31
If U.S.per capita GDP is $50,000 and grows at 2% per year,what will U.S.per capita GDP be in 70 years?
A) $100,000
B) $200,000
C) $400,000
D) $800,000
A) $100,000
B) $200,000
C) $400,000
D) $800,000
Unlock Deck
Unlock for access to all 269 flashcards in this deck.
Unlock Deck
k this deck
32
The world's poorest country is:
A) Nigeria.
B) Argentina.
C) India.
D) the Democratic Republic of the Congo.
A) Nigeria.
B) Argentina.
C) India.
D) the Democratic Republic of the Congo.
Unlock Deck
Unlock for access to all 269 flashcards in this deck.
Unlock Deck
k this deck
33
If the GDP of country X is 4 times the GDP of country Y and if the GDP of country X remains constant while GDP of country Y grows at a rate of 7% per year,which of the following statements is true?
A) Country Y's GDP will be equal to country X's GDP in 10 years.
B) Country Y's GDP will be equal to country X's GDP in 20 years.
C) Country Y's GDP will be equal to country X's GDP in 40 years.
D) Country Y's GDP will never catch up with country X's GDP.
A) Country Y's GDP will be equal to country X's GDP in 10 years.
B) Country Y's GDP will be equal to country X's GDP in 20 years.
C) Country Y's GDP will be equal to country X's GDP in 40 years.
D) Country Y's GDP will never catch up with country X's GDP.
Unlock Deck
Unlock for access to all 269 flashcards in this deck.
Unlock Deck
k this deck
34
At an annual growth rate of 0.7%,approximately how long does it take for real GDP per capita to increase from $30,000 to $60,000 in a country?
A) 50 years
B) 100 years
C) 200 years
D) 400 years
A) 50 years
B) 100 years
C) 200 years
D) 400 years
Unlock Deck
Unlock for access to all 269 flashcards in this deck.
Unlock Deck
k this deck
35
Today,real GDP per capita is about _____ as large in the richest countries as in the poorest countries.
A) twice
B) 10 times
C) 20 times
D) 50 times
A) twice
B) 10 times
C) 20 times
D) 50 times
Unlock Deck
Unlock for access to all 269 flashcards in this deck.
Unlock Deck
k this deck
36
If U.S.per capita GDP is $50,000 and grows at 3% per year,what will U.S.per capita GDP be in 70 years?
A) $100,000
B) $200,000
C) $400,000
D) $800,000
A) $100,000
B) $200,000
C) $400,000
D) $800,000
Unlock Deck
Unlock for access to all 269 flashcards in this deck.
Unlock Deck
k this deck
37
For most of recorded history,economic growth has been:
A) about the same as today.
B) virtually nonexistent.
C) a source of continuously rising living standards.
D) a way to equalize the distribution of wealth around the world.
A) about the same as today.
B) virtually nonexistent.
C) a source of continuously rising living standards.
D) a way to equalize the distribution of wealth around the world.
Unlock Deck
Unlock for access to all 269 flashcards in this deck.
Unlock Deck
k this deck
38
Fully 80% of the world's population live in countries with a GDP:
A) less than the world average.
B) more than the world average.
C) per capita less than the world average.
D) per capita more than the world average.
A) less than the world average.
B) more than the world average.
C) per capita less than the world average.
D) per capita more than the world average.
Unlock Deck
Unlock for access to all 269 flashcards in this deck.
Unlock Deck
k this deck
39
If the average annual growth rate of a country increases from 2% to 3%,how much faster will its GDP double?
A) 10 years faster
B) 11 2/3 years faster
C) 17 years faster
D) 25 years faster
A) 10 years faster
B) 11 2/3 years faster
C) 17 years faster
D) 25 years faster
Unlock Deck
Unlock for access to all 269 flashcards in this deck.
Unlock Deck
k this deck
40
According to the rule of 70,a country with an annual growth rate of 7% will double its GDP per capita in:
A) 70 years.
B) 10 years.
C) 7 years.
D) less than 1 year.
A) 70 years.
B) 10 years.
C) 7 years.
D) less than 1 year.
Unlock Deck
Unlock for access to all 269 flashcards in this deck.
Unlock Deck
k this deck
41
Use the following to answer questions
Figure: Economic Growth in Major World Regions
(Figure: Economic Growth in Major World Regions)Refer to the figure,which shows real GDP per capita over time in different regions of the world.The chart shows that all regions of the world:
A) were poor at one time.
B) have been relatively rich throughout most of human history.
C) have experienced moderate growth throughout most of human history.
D) remain poor today.
Unlock Deck
Unlock for access to all 269 flashcards in this deck.
Unlock Deck
k this deck
42
Relative to South Korea,Argentina was _____ in 1950 and _____ in 2000.
A) poor;poor
B) rich;rich
C) poor;rich
D) rich;poor
A) poor;poor
B) rich;rich
C) poor;rich
D) rich;poor
Unlock Deck
Unlock for access to all 269 flashcards in this deck.
Unlock Deck
k this deck
43
Since 1974 Nigeria's growth rate has been:
A) high and positive.
B) low and positive.
C) approximately zero.
D) negative.
A) high and positive.
B) low and positive.
C) approximately zero.
D) negative.
Unlock Deck
Unlock for access to all 269 flashcards in this deck.
Unlock Deck
k this deck
44
Relative to China,Argentina was _____ in 1950 and _____ in 2007.
A) poor;poor
B) rich;rich
C) poor;rich
D) rich;poor
A) poor;poor
B) rich;rich
C) poor;rich
D) rich;poor
Unlock Deck
Unlock for access to all 269 flashcards in this deck.
Unlock Deck
k this deck
45
Relative to the United States,Argentina was _____ in 1950 and _____ in 2000.
A) poor;poor
B) rich;rich
C) poor;rich
D) rich;poor
A) poor;poor
B) rich;rich
C) poor;rich
D) rich;poor
Unlock Deck
Unlock for access to all 269 flashcards in this deck.
Unlock Deck
k this deck
46
Suppose a country's real GDP per capita was $9,000 in 1990,and it grew to $18,000 by 2000.What is the annual growth rate of the country's real GDP per capita during this period?
A) 7%
B) 10%
C) 20%
D) 25%
A) 7%
B) 10%
C) 20%
D) 25%
Unlock Deck
Unlock for access to all 269 flashcards in this deck.
Unlock Deck
k this deck
47
Two countries that may be considered examples of growth miracles are:
A) Mexico and China.
B) the United States and Spain.
C) Denmark and Luxembourg.
D) South Korea and Japan.
A) Mexico and China.
B) the United States and Spain.
C) Denmark and Luxembourg.
D) South Korea and Japan.
Unlock Deck
Unlock for access to all 269 flashcards in this deck.
Unlock Deck
k this deck
48
Over the past 200 years,economic growth in the United States has been:
A) among the slowest in the world.
B) the fastest in the world.
C) slow and consistent.
D) volatile.
A) among the slowest in the world.
B) the fastest in the world.
C) slow and consistent.
D) volatile.
Unlock Deck
Unlock for access to all 269 flashcards in this deck.
Unlock Deck
k this deck
49
From 1950 to 1970 Japan's growth rate was:
A) high and positive.
B) low and positive.
C) approximately zero.
D) negative.
A) high and positive.
B) low and positive.
C) approximately zero.
D) negative.
Unlock Deck
Unlock for access to all 269 flashcards in this deck.
Unlock Deck
k this deck
50
Relative to Japan,Argentina was _____ in 1950 and _____ in 2000.
A) poor;poor
B) rich;rich
C) poor;rich
D) rich;poor
A) poor;poor
B) rich;rich
C) poor;rich
D) rich;poor
Unlock Deck
Unlock for access to all 269 flashcards in this deck.
Unlock Deck
k this deck
51
Which statement best describes the economic growth patterns in the world since World War II?
A) Japan and South Korea experienced rapid growth while Argentina and Nigeria experienced slow growth.
B) Japan and South Korea experienced slow growth while Argentina and Nigeria experienced rapid growth.
C) Most countries in the world experienced rapid growth.
D) Most countries in the world except the United States experienced no growth at all.
Unlock Deck
Unlock for access to all 269 flashcards in this deck.
Unlock Deck
k this deck
52
Suppose a country's annual growth rate of real GDP per capita is approximately 2%.By which year would the country double its real GDP per capita from $10,000 in 1950 to $20,000?
A) 1970
B) 1985
C) 2000
D) 2005
A) 1970
B) 1985
C) 2000
D) 2005
Unlock Deck
Unlock for access to all 269 flashcards in this deck.
Unlock Deck
k this deck
53
The rule of 70 states that if the annual growth rate of a variable is x%,the necessary time for doubling is:
A) 70 plus x.
B) 70 minus x.
C) 70 times x.
D) 70 divided by x.
A) 70 plus x.
B) 70 minus x.
C) 70 times x.
D) 70 divided by x.
Unlock Deck
Unlock for access to all 269 flashcards in this deck.
Unlock Deck
k this deck
54
Use the following to answer questions
Figure: The Distribution of World Income
(Figure: The Distribution of World Income)Refer to the figure.Based on the data in the figure,about how many times wealthier is the richest country when compared to the poorest countries in the world?
A) 500 times
B) 100 times
C) 10 times
D) 30 times
Figure: The Distribution of World Income
(Figure: The Distribution of World Income)Refer to the figure.Based on the data in the figure,about how many times wealthier is the richest country when compared to the poorest countries in the world?
A) 500 times
B) 100 times
C) 10 times
D) 30 times
Unlock Deck
Unlock for access to all 269 flashcards in this deck.
Unlock Deck
k this deck
55
Use the following to answer questions
Figure: The Distribution of World Income
What percentage of the world's population lives in a country that has a GDP per capita above the world average?
A) 10%
B) 20%
C) 50%
D) 75%
Figure: The Distribution of World Income
What percentage of the world's population lives in a country that has a GDP per capita above the world average?
A) 10%
B) 20%
C) 50%
D) 75%
Unlock Deck
Unlock for access to all 269 flashcards in this deck.
Unlock Deck
k this deck
56
Use the following to answer questions
Figure: The Distribution of World Income
In the year 2011,the world's average per capita GDP was $10,515.What percent of the world's population lived in a country with per capita GDP that was below $10,515?
A) 20%
B) 40%
C) 50%
D) 80%
Figure: The Distribution of World Income
In the year 2011,the world's average per capita GDP was $10,515.What percent of the world's population lived in a country with per capita GDP that was below $10,515?
A) 20%
B) 40%
C) 50%
D) 80%
Unlock Deck
Unlock for access to all 269 flashcards in this deck.
Unlock Deck
k this deck
57
The rule of 70 indicates that an increase in the growth rate of a variable will _____ the time needed to double living standards.
A) reduce
B) increase
C) have no effect on
D) have an unpredictable effect on.
A) reduce
B) increase
C) have no effect on
D) have an unpredictable effect on.
Unlock Deck
Unlock for access to all 269 flashcards in this deck.
Unlock Deck
k this deck
58
The world's average level of GDP per capita is $10,515 as of 2011.This is about the same as the living standard in which nation?
A) China
B) Mexico
C) Nigeria
D) India
A) China
B) Mexico
C) Nigeria
D) India
Unlock Deck
Unlock for access to all 269 flashcards in this deck.
Unlock Deck
k this deck
59
Which country had a growth miracle beginning in the late 1970s?
A) United States
B) Japan
C) North Korea
D) China
A) United States
B) Japan
C) North Korea
D) China
Unlock Deck
Unlock for access to all 269 flashcards in this deck.
Unlock Deck
k this deck
60
Use the following to answer questions
Figure: The Distribution of World Income
(Figure: The Distribution of World Income)Refer to the figure.Based on the data in the figure,living standards in the United States are about how many times higher than the world average?
A) 4 times
B) 10 times
C) 40 times
D) 50 times
Figure: The Distribution of World Income
(Figure: The Distribution of World Income)Refer to the figure.Based on the data in the figure,living standards in the United States are about how many times higher than the world average?
A) 4 times
B) 10 times
C) 40 times
D) 50 times
Unlock Deck
Unlock for access to all 269 flashcards in this deck.
Unlock Deck
k this deck
61
Countries that have high per capita GDP tend to have:
A) high levels of physical capital per worker.
B) high levels of human capital per worker.
C) high levels of technology per worker.
D) high levels of all three factors of production.
A) high levels of physical capital per worker.
B) high levels of human capital per worker.
C) high levels of technology per worker.
D) high levels of all three factors of production.
Unlock Deck
Unlock for access to all 269 flashcards in this deck.
Unlock Deck
k this deck
62
A business that pays for its workers to attend a technical college is increasing its:
A) physical capital.
B) human capital.
C) organizational skills.
D) technical knowledge.
A) physical capital.
B) human capital.
C) organizational skills.
D) technical knowledge.
Unlock Deck
Unlock for access to all 269 flashcards in this deck.
Unlock Deck
k this deck
63
Use the following to answer questions
Figure: Economic Growth in Major World Regions
(Figure: Economic Growth in Major World Regions)Refer to the figure,which shows real GDP per capita over time in different regions of the world.The chart shows that:
A) all regions of the world eventually achieved significant growth.
B) some regions of the world have always experienced growth.
C) significant growth has occurred in some regions only since 1950.
D) all regions of the world remain poor today.
Unlock Deck
Unlock for access to all 269 flashcards in this deck.
Unlock Deck
k this deck
64
Use the following to answer questions
Figure: Economic Growth in Major World Regions
The United States and Western European countries began to experience accelerated economic growth during which century?
A) twelfth
B) sixteenth
C) seventeenth
D) nineteenth
Figure: Economic Growth in Major World Regions
The United States and Western European countries began to experience accelerated economic growth during which century?
A) twelfth
B) sixteenth
C) seventeenth
D) nineteenth
Unlock Deck
Unlock for access to all 269 flashcards in this deck.
Unlock Deck
k this deck
65
Technological knowledge is the:
A) stock of tools,including machines,structures,and equipment,used to produce output.
B) productive knowledge and skills that workers acquire through education,training,and experience.
C) knowledge about how the world works that is used to produce goods and services.
D) organizational skills of business owners.
Unlock Deck
Unlock for access to all 269 flashcards in this deck.
Unlock Deck
k this deck
66
Which statement is TRUE about economic growth?
A) All countries eventually grow rich.
B) Once a country starts to grow,it will continue to grow.
C) A country can grow and become wealthy,never grow,or grow and then begin to stagnate.
D) Growth is a random process;in some years a country grows and in other years it doesn't.
A) All countries eventually grow rich.
B) Once a country starts to grow,it will continue to grow.
C) A country can grow and become wealthy,never grow,or grow and then begin to stagnate.
D) Growth is a random process;in some years a country grows and in other years it doesn't.
Unlock Deck
Unlock for access to all 269 flashcards in this deck.
Unlock Deck
k this deck
67
Which are immediate causes of the wealth of nations?
A) institutions and incentives
B) technical knowledge and human capital
C) customs,practices,and social norms
D) property rights and honest government
A) institutions and incentives
B) technical knowledge and human capital
C) customs,practices,and social norms
D) property rights and honest government
Unlock Deck
Unlock for access to all 269 flashcards in this deck.
Unlock Deck
k this deck
68
Which is NOT an example of physical capital?
A) tractor
B) cell phone
C) computer
D) a share of Caterpillar,Inc.stock
A) tractor
B) cell phone
C) computer
D) a share of Caterpillar,Inc.stock
Unlock Deck
Unlock for access to all 269 flashcards in this deck.
Unlock Deck
k this deck
69
Physical capital is the:
A) stock of tools,including machines,structures,and equipment,used to produce output.
B) productive knowledge and skills that workers acquire through education,training,and experience.
C) knowledge about how the world works that is used to produce goods and services.
D) financial resources available to business owners.
Unlock Deck
Unlock for access to all 269 flashcards in this deck.
Unlock Deck
k this deck
70
What are the four factors of production that combine to contribute to the wealth of nations?
A) incentives,institutions,organization,and technical knowledge
B) international trading partners,natural resources,efficient government,and low taxes
C) human capital,physical capital,technical knowledge,and organization
D) property rights,honest government,political stability,and a dependable legal system
Unlock Deck
Unlock for access to all 269 flashcards in this deck.
Unlock Deck
k this deck
71
Human capital is the:
A) stock of tools,including machines,structures,and equipment,used by workers to produce output.
B) productive knowledge and skills that workers acquire through education,training,and experience.
C) knowledge about how the world works that is used to produce goods and services.
D) same thing as the overall population.
Unlock Deck
Unlock for access to all 269 flashcards in this deck.
Unlock Deck
k this deck
72
Use the following to answer questions
Figure: Economic Growth in Major World Regions
If real GDP per capita in the United States is currently $50,000 and grows at 2.5% per year,it will take approximately how many years to reach $200,000?
A) 28 years
B) 56 years
C) 84 years
D) 112 years
Figure: Economic Growth in Major World Regions
If real GDP per capita in the United States is currently $50,000 and grows at 2.5% per year,it will take approximately how many years to reach $200,000?
A) 28 years
B) 56 years
C) 84 years
D) 112 years
Unlock Deck
Unlock for access to all 269 flashcards in this deck.
Unlock Deck
k this deck
73
One measure of student output is number of completed math problems produced.Using pen and paper only,a student can complete 50 math problems in 2 hours.Using pen,paper,and a calculator,the same student can complete 100 math problems in 2 hours.(The student is already familiar with,and knows how to use,the calculator. )This scenario illustrates the use of which factor of production?
A) physical capital
B) human capital
C) technological knowledge
D) both human capital and technological knowledge
A) physical capital
B) human capital
C) technological knowledge
D) both human capital and technological knowledge
Unlock Deck
Unlock for access to all 269 flashcards in this deck.
Unlock Deck
k this deck
74
Factors of production that contribute to growth in per capita GDP include:
A) proximal and ultimate factors of production.
B) physical capital,skilled labor,and technological know-how.
C) organization of resources.
D) institutions.
A) proximal and ultimate factors of production.
B) physical capital,skilled labor,and technological know-how.
C) organization of resources.
D) institutions.
Unlock Deck
Unlock for access to all 269 flashcards in this deck.
Unlock Deck
k this deck
75
A rural village in a developing country has an economy based on agriculture.Then the government of the country provides the village with newly developed hybrid seeds that more than double the agricultural yield per acre.This story illustrates the growth of per capita GDP in the village through which factor(s)of production?
A) physical capital
B) human capital
C) technological knowledge
D) both human capital and technological knowledge
A) physical capital
B) human capital
C) technological knowledge
D) both human capital and technological knowledge
Unlock Deck
Unlock for access to all 269 flashcards in this deck.
Unlock Deck
k this deck
76
Workers' ability to use various tools is known as _____.
A) technological knowledge
B) human capital
C) knowledge
D) experience
A) technological knowledge
B) human capital
C) knowledge
D) experience
Unlock Deck
Unlock for access to all 269 flashcards in this deck.
Unlock Deck
k this deck
77
Increasing the amount of physical capital tends to _____ output per hour of workers and _____ the value of workers.
A) increase;increase
B) increase;decrease
C) decrease;decrease
D) decrease;increase
A) increase;increase
B) increase;decrease
C) decrease;decrease
D) decrease;increase
Unlock Deck
Unlock for access to all 269 flashcards in this deck.
Unlock Deck
k this deck
78
Farmers who use tractors instead of horse-drawn plows have greater yields.Which factor of production explains this result?
A) organizational skills
B) natural resources
C) technical knowledge
D) physical capital
A) organizational skills
B) natural resources
C) technical knowledge
D) physical capital
Unlock Deck
Unlock for access to all 269 flashcards in this deck.
Unlock Deck
k this deck
79
What is the most immediate (or direct)cause of growth in real GDP per capita?
A) factors of production
B) institutions
C) the political system in the economy
D) incentives
A) factors of production
B) institutions
C) the political system in the economy
D) incentives
Unlock Deck
Unlock for access to all 269 flashcards in this deck.
Unlock Deck
k this deck
80
Use the following to answer questions
Figure: Economic Growth in Major World Regions
(Figure: Economic Growth in Major World Regions)Refer to the figure,which shows real GDP per capita over time in different regions of the world.The chart shows that living standards in different regions began to _____ at the beginning of the nineteenth century.
A) diverge
B) converge
C) equalize
D) fall
Unlock Deck
Unlock for access to all 269 flashcards in this deck.
Unlock Deck
k this deck
Unlock Deck
Unlock for access to all 269 flashcards in this deck.


