Deck 22: understanding Graphs
Full screen (f)
Question
Exhibit 1-2 
In Exhibit 1-2,when y is greater than 12,the
A)value of x is larger on curve A than on curve B
B)value of x is smaller on curve A than on curve B
C)value of x is the same on curve A as on curve B
D)slope of line A is negative
E)slope of line B is positive
In Exhibit 1-2,when y is greater than 12,the
A)value of x is larger on curve A than on curve B
B)value of x is smaller on curve A than on curve B
C)value of x is the same on curve A as on curve B
D)slope of line A is negative
E)slope of line B is positive
Question
Exhibit 1-3 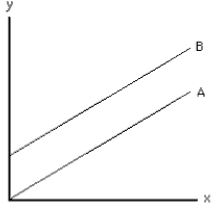
In Exhibit 1-3,for any value of x,the
A)value of y is larger on curve A than on curve B
B)value of y is smaller on curve A than on curve B
C)value of y is the same on curve A as on curve B
D)slope of line A is increasing
E)slope of line B is negative
In Exhibit 1-3,for any value of x,the
A)value of y is larger on curve A than on curve B
B)value of y is smaller on curve A than on curve B
C)value of y is the same on curve A as on curve B
D)slope of line A is increasing
E)slope of line B is negative
Question
Exhibit 1-1 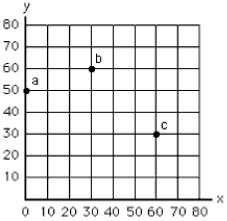
In Exhibit 1-1,point c represents
A)x = 30,y = 60
B)x = 60,y = 30
C)c = 90
D)x + y = 60
E)x + y = 30
In Exhibit 1-1,point c represents
A)x = 30,y = 60
B)x = 60,y = 30
C)c = 90
D)x + y = 60
E)x + y = 30
Question
Question
Question
Exhibit 1-1
In Exhibit 1-1 the movement from point a to point b represents
A)an increase in x of 30 units and an increase in y of 10 units
B)an increase in x of 10 units and an increase in y of 30 units
C)an increase in x of 60 units and a decrease in y of 20 units
D)an increase in x of 20 units and a decrease in y of 60 units
E)an increase in x of 20 units and a decrease in y of 30 units
Question
Exhibit 1-1
In Exhibit 1-1 the movement from point b to point c represents
A)an increase in x of 30 units and an increase in y of 10 units
B)an increase in x of 10 units and an increase in y of 30 units
C)an increase in x of 60 units and a decrease in y of 20 units
D)an increase in x of 20 units and a decrease in y of 60 units
E)an increase in x of 20 units and a decrease in y of 30 units
Question
Exhibit 1-1
Point a in Exhibit 1-1 represents
A)the origin
B)x = 0,y = 50
C)x = 50,y = 0
D)x + y = 50
E)y = 0; no information is given about x
Point a in Exhibit 1-1 represents
A)the origin
B)x = 0,y = 50
C)x = 50,y = 0
D)x + y = 50
E)y = 0; no information is given about x
Question
Exhibit 1-1
Point b in Exhibit 1-1 represents
A)x = 30,y = 60
B)x = 60,y = 30
C)x + y = 60
D)x + y = 30
E)b = 90
Point b in Exhibit 1-1 represents
A)x = 30,y = 60
B)x = 60,y = 30
C)x + y = 60
D)x + y = 30
E)b = 90
Question
Exhibit 1-2
In Exhibit 1-2,at x = 8,the
A)value of y is larger on curve A than on curve B
B)value of y is smaller on curve A than on curve B
C)value of y is the same on curve A as on curve B
D)slope of line A is negative
E)slope of line B is positive
In Exhibit 1-2,at x = 8,the
A)value of y is larger on curve A than on curve B
B)value of y is smaller on curve A than on curve B
C)value of y is the same on curve A as on curve B
D)slope of line A is negative
E)slope of line B is positive
Question
Exhibit 1-3
In Exhibit 1-3,for any value of y,the
A)value of x is larger on curve A than on curve B
B)value of x is smaller on curve A than on curve B
C)value of x is the same on curve A as on curve B
D)slope of line A is increasing
E)slope of line B is negative
In Exhibit 1-3,for any value of y,the
A)value of x is larger on curve A than on curve B
B)value of x is smaller on curve A than on curve B
C)value of x is the same on curve A as on curve B
D)slope of line A is increasing
E)slope of line B is negative
Question
Exhibit 1-2
In Exhibit 1-2,at x = 10,the
A)value of y is larger on curve A than on curve B
B)value of y is smaller on curve A than on curve B
C)value of y is the same on curve A as on curve B
D)slope of line A is negative
E)slope of line B is positive
In Exhibit 1-2,at x = 10,the
A)value of y is larger on curve A than on curve B
B)value of y is smaller on curve A than on curve B
C)value of y is the same on curve A as on curve B
D)slope of line A is negative
E)slope of line B is positive
Question
Exhibit 1-2
In Exhibit 1-2,at x = 12,the
A)value of y is larger on curve A than on curve B
B)value of y is smaller on curve A than on curve B
C)value of y is the same on curve A as on curve B
D)slope of line A is negative
E)slope of line B is positive
In Exhibit 1-2,at x = 12,the
A)value of y is larger on curve A than on curve B
B)value of y is smaller on curve A than on curve B
C)value of y is the same on curve A as on curve B
D)slope of line A is negative
E)slope of line B is positive
Question
Exhibit 1-2
In Exhibit 1-2,when y is less than 12,the
A)value of x is larger on curve A than on curve B
B)value of x is smaller on curve A than on curve B
C)value of x is the same on curve A as on curve B
D)slope of line A is negative
E)slope of line B is positive
In Exhibit 1-2,when y is less than 12,the
A)value of x is larger on curve A than on curve B
B)value of x is smaller on curve A than on curve B
C)value of x is the same on curve A as on curve B
D)slope of line A is negative
E)slope of line B is positive
Question
Exhibit 1-2
In Exhibit 1-2,when x is less than 10,the
A)value of y is larger on curve A than on curve B
B)value of y is smaller on curve A than on curve B
C)value of y is the same on curve A as on curve B
D)slope of line A is negative
E)slope of line B is positive
In Exhibit 1-2,when x is less than 10,the
A)value of y is larger on curve A than on curve B
B)value of y is smaller on curve A than on curve B
C)value of y is the same on curve A as on curve B
D)slope of line A is negative
E)slope of line B is positive
Question
Exhibit 1-2
In Exhibit 1-2,at y = 14,the
A)value of x is larger on curve A than on curve B
B)value of x is smaller on curve A than on curve B
C)value of x is the same on curve A as on curve B
D)slope of line A is negative
E)slope of line B is positive
In Exhibit 1-2,at y = 14,the
A)value of x is larger on curve A than on curve B
B)value of x is smaller on curve A than on curve B
C)value of x is the same on curve A as on curve B
D)slope of line A is negative
E)slope of line B is positive
Question
Question
Exhibit 1-1
In Exhibit 1-1 the movement from point a to point c represents
A)an increase in x of 30 units and an increase in y of 10 units
B)an increase in x of 10 units and an increase in y of 30 units
C)an increase in x of 60 units and a decrease in y of 20 units
D)an increase in x of 20 units and a decrease in y of 60 units
E)an increase in x of 20 units and a decrease in y of 30 units
Question
Exhibit 1-2
In Exhibit 1-2,when x is greater than 10,the
A)value of y is larger on curve A than on curve B
B)value of y is smaller on curve A than on curve B
C)value of y is the same on curve A as on curve B
D)slope of line A is negative
E)slope of line B is positive
In Exhibit 1-2,when x is greater than 10,the
A)value of y is larger on curve A than on curve B
B)value of y is smaller on curve A than on curve B
C)value of y is the same on curve A as on curve B
D)slope of line A is negative
E)slope of line B is positive
Question
Question
Question
Question
Question
Question
Exhibit 1-6 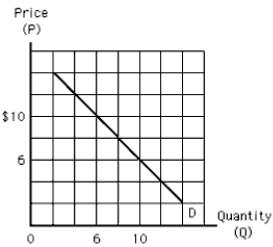
Along the curve in Exhibit 1-6,
A)if P = $6,then Q = 8
B)if Q = 10,then P = $4
C)the slope is equal to -1
D)Q increases as P increases
E)there is a positive relationship between Q and P
Along the curve in Exhibit 1-6,
A)if P = $6,then Q = 8
B)if Q = 10,then P = $4
C)the slope is equal to -1
D)Q increases as P increases
E)there is a positive relationship between Q and P
Question
Question
Question
Exhibit 1-5 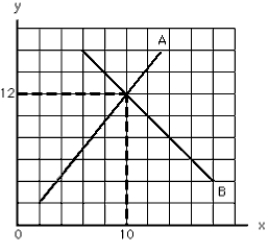
In Exhibit 1-5,curve A has a slope of
A)0
B)1.25
C)1.33
D)-1.25
E)-1.33
In Exhibit 1-5,curve A has a slope of
A)0
B)1.25
C)1.33
D)-1.25
E)-1.33
Question
Exhibit 1-4 
According to the curve in Exhibit 1-4,
A)if P = $8,then Q = 8
B)if P = $10,then Q = 10
C)Q increases as P increases
D)Q decreases as P decreases
E)there is a positive relation between Q and P
According to the curve in Exhibit 1-4,
A)if P = $8,then Q = 8
B)if P = $10,then Q = 10
C)Q increases as P increases
D)Q decreases as P decreases
E)there is a positive relation between Q and P
Question
Question
Exhibit 1-4
Which of the following must be true of line D in Exhibit 1-4?
A)A decrease in P is associated with a decrease in Q.
B)An increase in P is associated with an increase in Q.
C)There is no relation between P and Q.
D)There is an inverse relationship between P and Q.
E)There is a direct relationship between P and Q.
Question
Question
Exhibit 1-5
In Exhibit 1-5,curve B has a slope of
A)0
B)1.25
C)1.33
D)-1.25
E)-1.33
In Exhibit 1-5,curve B has a slope of
A)0
B)1.25
C)1.33
D)-1.25
E)-1.33
Question
Question
Question
Question
Exhibit 1-4
According to the curve in Exhibit 1-4,if P increases from $10 to $14,Q
A)stays the same
B)Q increases from 6 to 8
C)Q increases from 6 to 10
D)Q decreases from 6 to 2
E)Q decreases from 6 to 0
According to the curve in Exhibit 1-4,if P increases from $10 to $14,Q
A)stays the same
B)Q increases from 6 to 8
C)Q increases from 6 to 10
D)Q decreases from 6 to 2
E)Q decreases from 6 to 0
Question
Exhibit 1-5
In Exhibit 1-5,curve A has a __________ slope that is __________ at every point.
A)positive; constant
B)positive; changing
C)negative; constant
D)negative; changing
E)changing; constant
In Exhibit 1-5,curve A has a __________ slope that is __________ at every point.
A)positive; constant
B)positive; changing
C)negative; constant
D)negative; changing
E)changing; constant
Question
Exhibit 1-5
In Exhibit 1-5,curve B has a __________ slope that is __________ at every point.
A)positive; constant
B)positive; changing
C)negative; constant
D)negative; changing
E)changing; constant
In Exhibit 1-5,curve B has a __________ slope that is __________ at every point.
A)positive; constant
B)positive; changing
C)negative; constant
D)negative; changing
E)changing; constant
Question
Question
Question
Question
Question
Question
Question
Question
Question
Exhibit 1-10 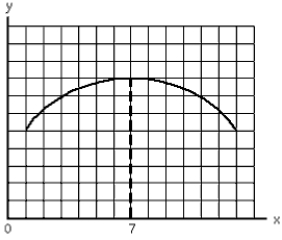
In Exhibit 1-10,the slope of the line is
A)negative for all values of x
B)positive for all values of x
C)zero at x = 7
D)first negative,then positive as x increases
E)negative for all values of y
In Exhibit 1-10,the slope of the line is
A)negative for all values of x
B)positive for all values of x
C)zero at x = 7
D)first negative,then positive as x increases
E)negative for all values of y
Question
Question
Question
Exhibit 1-8 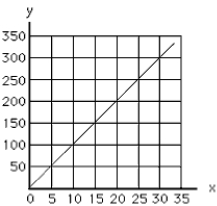
The slope of a vertical line is
A)infinitely large
B)zero
C)positive
D)negative
E)infinitely small
The slope of a vertical line is
A)infinitely large
B)zero
C)positive
D)negative
E)infinitely small
Question
Question
Question
Question
Question
Exhibit 1-8
The slope of the line in Exhibit 1-8 is
A)0.1
B)1
C)10
D)-0.1
E)-10
The slope of the line in Exhibit 1-8 is
A)0.1
B)1
C)10
D)-0.1
E)-10
Question
Exhibit 1-7 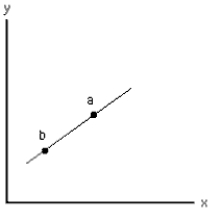
The slope of the straight line in Exhibit 1-7 is
A)greater at point a than at point b
B)the same at points a and b
C)zero because the line is straight
D)negative because an inverse relation is shown
E)positive because the line lies to the right of the y-axis
The slope of the straight line in Exhibit 1-7 is
A)greater at point a than at point b
B)the same at points a and b
C)zero because the line is straight
D)negative because an inverse relation is shown
E)positive because the line lies to the right of the y-axis
Question
Question
Question
Exhibit 1-8
The slope of a horizontal line is
A)infinitely large
B)zero
C)positive
D)negative
E)infinitely small
The slope of a horizontal line is
A)infinitely large
B)zero
C)positive
D)negative
E)infinitely small
Question
Exhibit 1-14 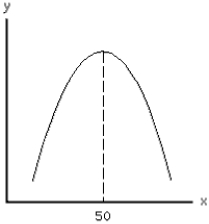
Using Exhibit 1-14,calculate the slope of the curve where x equals 50.
A)0
B)1
C)infinite
D)-1
E)the slope cannot be determined because there is no tangent line
Using Exhibit 1-14,calculate the slope of the curve where x equals 50.
A)0
B)1
C)infinite
D)-1
E)the slope cannot be determined because there is no tangent line
Question
Exhibit 1-16 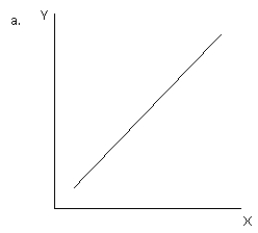
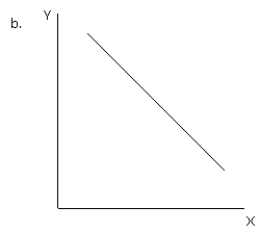
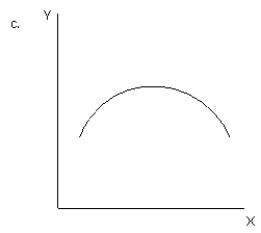
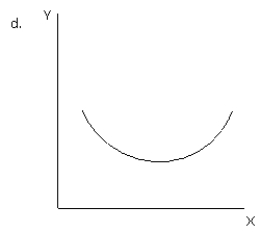
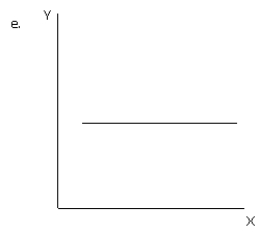
Refer to exhibit 1-16.Which of the graphs illustrates an inverse or negative relationship between variable X and variable Y?
A)a
B)b
C)c
D)d
E)e
Refer to exhibit 1-16.Which of the graphs illustrates an inverse or negative relationship between variable X and variable Y?
A)a
B)b
C)c
D)d
E)e
Question
Question
Exhibit 1-16
Refer to exhibit 1-16.Which of the graphs illustrates no relationship between variable X and variable Y?
A)a
B)b
C)c
D)d
E)e
Refer to exhibit 1-16.Which of the graphs illustrates no relationship between variable X and variable Y?
A)a
B)b
C)c
D)d
E)e
Question
Exhibit 1-16
Refer to exhibit 1-16.Which of the graphs illustrates a direct or positive relationship between variable X and variable Y?
A)a
B)b
C)c
D)d
E)e
Refer to exhibit 1-16.Which of the graphs illustrates a direct or positive relationship between variable X and variable Y?
A)a
B)b
C)c
D)d
E)e
Question
Question
Exhibit 1-16
Refer to Exhibit 1-16.Which graph illustrates a positive relationship between variable X and variable Y initially but then a negative relationship?
A)a
B)b
C)c
D)d
E)e
Refer to Exhibit 1-16.Which graph illustrates a positive relationship between variable X and variable Y initially but then a negative relationship?
A)a
B)b
C)c
D)d
E)e
Question
Exhibit 1-16
Refer to Exhibit 1-16.Which graph illustrates a negative relationship between variable X and variable Y initially but then a positive relationship?
A)a
B)b
C)c
D)d
E)e
Refer to Exhibit 1-16.Which graph illustrates a negative relationship between variable X and variable Y initially but then a positive relationship?
A)a
B)b
C)c
D)d
E)e
Question
Exhibit 1-15 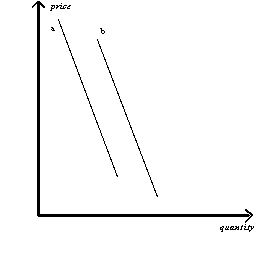
Refer to Exhibit 1-15.The reason that Line (a)would shift to the position of Line (b)is
A)a change in quantity
B)a change in price
C)a change in an assumption about the relationship between the two variables observed
D)a change from a positive relation to a negative relation
E)a change from a negative relation to a positive relation
Question
Exhibit 1-12 
The slope of the line in Exhibit 1-12 is
A)positive and constant
B)positive and increasing
C)positive and decreasing
D)negative and increasing
E)negative and decreasing
The slope of the line in Exhibit 1-12 is
A)positive and constant
B)positive and increasing
C)positive and decreasing
D)negative and increasing
E)negative and decreasing
Question
Question
Exhibit 1-11 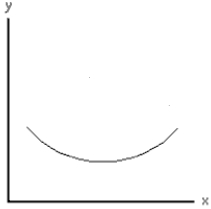
In Exhibit 1-11,the slope of the line is
A)negative for all values of x
B)positive for all values of x
C)never zero
D)first negative,then positive as x increases
E)first rising,then falling as x increases
In Exhibit 1-11,the slope of the line is
A)negative for all values of x
B)positive for all values of x
C)never zero
D)first negative,then positive as x increases
E)first rising,then falling as x increases
Question

Unlock Deck
Sign up to unlock the cards in this deck!
Unlock Deck
Unlock Deck
1/73
Play
Full screen (f)
Deck 22: understanding Graphs
1
Exhibit 1-2
In Exhibit 1-2,when y is greater than 12,the
A)value of x is larger on curve A than on curve B
B)value of x is smaller on curve A than on curve B
C)value of x is the same on curve A as on curve B
D)slope of line A is negative
E)slope of line B is positive
In Exhibit 1-2,when y is greater than 12,the
A)value of x is larger on curve A than on curve B
B)value of x is smaller on curve A than on curve B
C)value of x is the same on curve A as on curve B
D)slope of line A is negative
E)slope of line B is positive
A
2
Exhibit 1-3
In Exhibit 1-3,for any value of x,the
A)value of y is larger on curve A than on curve B
B)value of y is smaller on curve A than on curve B
C)value of y is the same on curve A as on curve B
D)slope of line A is increasing
E)slope of line B is negative
In Exhibit 1-3,for any value of x,the
A)value of y is larger on curve A than on curve B
B)value of y is smaller on curve A than on curve B
C)value of y is the same on curve A as on curve B
D)slope of line A is increasing
E)slope of line B is negative
B
3
Exhibit 1-1
In Exhibit 1-1,point c represents
A)x = 30,y = 60
B)x = 60,y = 30
C)c = 90
D)x + y = 60
E)x + y = 30
In Exhibit 1-1,point c represents
A)x = 30,y = 60
B)x = 60,y = 30
C)c = 90
D)x + y = 60
E)x + y = 30
B
4
If x causes y,then
A)x and y are inversely related
B)y is a dependent variable
C)other variables don't matter
D)y must,in turn,cause x
E)x and y are always in a direct relation to each other
A)x and y are inversely related
B)y is a dependent variable
C)other variables don't matter
D)y must,in turn,cause x
E)x and y are always in a direct relation to each other
Unlock Deck
Unlock for access to all 73 flashcards in this deck.
Unlock Deck
k this deck
5
If a given value of x is associated with a particular value of y,
A)then x causes y
B)then y causes x
C)then x and y must be logically connected
D)there are no other variables that affect the value of y
E)there may be no causal relationship between x and y
A)then x causes y
B)then y causes x
C)then x and y must be logically connected
D)there are no other variables that affect the value of y
E)there may be no causal relationship between x and y
Unlock Deck
Unlock for access to all 73 flashcards in this deck.
Unlock Deck
k this deck
6
Exhibit 1-1
In Exhibit 1-1 the movement from point a to point b represents
A)an increase in x of 30 units and an increase in y of 10 units
B)an increase in x of 10 units and an increase in y of 30 units
C)an increase in x of 60 units and a decrease in y of 20 units
D)an increase in x of 20 units and a decrease in y of 60 units
E)an increase in x of 20 units and a decrease in y of 30 units
Unlock Deck
Unlock for access to all 73 flashcards in this deck.
Unlock Deck
k this deck
7
Exhibit 1-1
In Exhibit 1-1 the movement from point b to point c represents
A)an increase in x of 30 units and an increase in y of 10 units
B)an increase in x of 10 units and an increase in y of 30 units
C)an increase in x of 60 units and a decrease in y of 20 units
D)an increase in x of 20 units and a decrease in y of 60 units
E)an increase in x of 20 units and a decrease in y of 30 units
Unlock Deck
Unlock for access to all 73 flashcards in this deck.
Unlock Deck
k this deck
8
Exhibit 1-1
Point a in Exhibit 1-1 represents
A)the origin
B)x = 0,y = 50
C)x = 50,y = 0
D)x + y = 50
E)y = 0; no information is given about x
Point a in Exhibit 1-1 represents
A)the origin
B)x = 0,y = 50
C)x = 50,y = 0
D)x + y = 50
E)y = 0; no information is given about x
Unlock Deck
Unlock for access to all 73 flashcards in this deck.
Unlock Deck
k this deck
9
Exhibit 1-1
Point b in Exhibit 1-1 represents
A)x = 30,y = 60
B)x = 60,y = 30
C)x + y = 60
D)x + y = 30
E)b = 90
Point b in Exhibit 1-1 represents
A)x = 30,y = 60
B)x = 60,y = 30
C)x + y = 60
D)x + y = 30
E)b = 90
Unlock Deck
Unlock for access to all 73 flashcards in this deck.
Unlock Deck
k this deck
10
Exhibit 1-2
In Exhibit 1-2,at x = 8,the
A)value of y is larger on curve A than on curve B
B)value of y is smaller on curve A than on curve B
C)value of y is the same on curve A as on curve B
D)slope of line A is negative
E)slope of line B is positive
In Exhibit 1-2,at x = 8,the
A)value of y is larger on curve A than on curve B
B)value of y is smaller on curve A than on curve B
C)value of y is the same on curve A as on curve B
D)slope of line A is negative
E)slope of line B is positive
Unlock Deck
Unlock for access to all 73 flashcards in this deck.
Unlock Deck
k this deck
11
Exhibit 1-3
In Exhibit 1-3,for any value of y,the
A)value of x is larger on curve A than on curve B
B)value of x is smaller on curve A than on curve B
C)value of x is the same on curve A as on curve B
D)slope of line A is increasing
E)slope of line B is negative
In Exhibit 1-3,for any value of y,the
A)value of x is larger on curve A than on curve B
B)value of x is smaller on curve A than on curve B
C)value of x is the same on curve A as on curve B
D)slope of line A is increasing
E)slope of line B is negative
Unlock Deck
Unlock for access to all 73 flashcards in this deck.
Unlock Deck
k this deck
12
Exhibit 1-2
In Exhibit 1-2,at x = 10,the
A)value of y is larger on curve A than on curve B
B)value of y is smaller on curve A than on curve B
C)value of y is the same on curve A as on curve B
D)slope of line A is negative
E)slope of line B is positive
In Exhibit 1-2,at x = 10,the
A)value of y is larger on curve A than on curve B
B)value of y is smaller on curve A than on curve B
C)value of y is the same on curve A as on curve B
D)slope of line A is negative
E)slope of line B is positive
Unlock Deck
Unlock for access to all 73 flashcards in this deck.
Unlock Deck
k this deck
13
Exhibit 1-2
In Exhibit 1-2,at x = 12,the
A)value of y is larger on curve A than on curve B
B)value of y is smaller on curve A than on curve B
C)value of y is the same on curve A as on curve B
D)slope of line A is negative
E)slope of line B is positive
In Exhibit 1-2,at x = 12,the
A)value of y is larger on curve A than on curve B
B)value of y is smaller on curve A than on curve B
C)value of y is the same on curve A as on curve B
D)slope of line A is negative
E)slope of line B is positive
Unlock Deck
Unlock for access to all 73 flashcards in this deck.
Unlock Deck
k this deck
14
Exhibit 1-2
In Exhibit 1-2,when y is less than 12,the
A)value of x is larger on curve A than on curve B
B)value of x is smaller on curve A than on curve B
C)value of x is the same on curve A as on curve B
D)slope of line A is negative
E)slope of line B is positive
In Exhibit 1-2,when y is less than 12,the
A)value of x is larger on curve A than on curve B
B)value of x is smaller on curve A than on curve B
C)value of x is the same on curve A as on curve B
D)slope of line A is negative
E)slope of line B is positive
Unlock Deck
Unlock for access to all 73 flashcards in this deck.
Unlock Deck
k this deck
15
Exhibit 1-2
In Exhibit 1-2,when x is less than 10,the
A)value of y is larger on curve A than on curve B
B)value of y is smaller on curve A than on curve B
C)value of y is the same on curve A as on curve B
D)slope of line A is negative
E)slope of line B is positive
In Exhibit 1-2,when x is less than 10,the
A)value of y is larger on curve A than on curve B
B)value of y is smaller on curve A than on curve B
C)value of y is the same on curve A as on curve B
D)slope of line A is negative
E)slope of line B is positive
Unlock Deck
Unlock for access to all 73 flashcards in this deck.
Unlock Deck
k this deck
16
Exhibit 1-2
In Exhibit 1-2,at y = 14,the
A)value of x is larger on curve A than on curve B
B)value of x is smaller on curve A than on curve B
C)value of x is the same on curve A as on curve B
D)slope of line A is negative
E)slope of line B is positive
In Exhibit 1-2,at y = 14,the
A)value of x is larger on curve A than on curve B
B)value of x is smaller on curve A than on curve B
C)value of x is the same on curve A as on curve B
D)slope of line A is negative
E)slope of line B is positive
Unlock Deck
Unlock for access to all 73 flashcards in this deck.
Unlock Deck
k this deck
17
Suppose y is measured on the vertical axis,x is on the horizontal axis,and the various combinations of x and y are shown by a nonvertical straight line.Which of the following must be true?
A)There is a negative relation between x and y.
B)There is a positive relation between x and y.
C)There is a causal relation between x and y.
D)If the value of x is known,the value of y can be determined.
E)The value of y is independent of the value of x.
A)There is a negative relation between x and y.
B)There is a positive relation between x and y.
C)There is a causal relation between x and y.
D)If the value of x is known,the value of y can be determined.
E)The value of y is independent of the value of x.
Unlock Deck
Unlock for access to all 73 flashcards in this deck.
Unlock Deck
k this deck
18
Exhibit 1-1
In Exhibit 1-1 the movement from point a to point c represents
A)an increase in x of 30 units and an increase in y of 10 units
B)an increase in x of 10 units and an increase in y of 30 units
C)an increase in x of 60 units and a decrease in y of 20 units
D)an increase in x of 20 units and a decrease in y of 60 units
E)an increase in x of 20 units and a decrease in y of 30 units
Unlock Deck
Unlock for access to all 73 flashcards in this deck.
Unlock Deck
k this deck
19
Exhibit 1-2
In Exhibit 1-2,when x is greater than 10,the
A)value of y is larger on curve A than on curve B
B)value of y is smaller on curve A than on curve B
C)value of y is the same on curve A as on curve B
D)slope of line A is negative
E)slope of line B is positive
In Exhibit 1-2,when x is greater than 10,the
A)value of y is larger on curve A than on curve B
B)value of y is smaller on curve A than on curve B
C)value of y is the same on curve A as on curve B
D)slope of line A is negative
E)slope of line B is positive
Unlock Deck
Unlock for access to all 73 flashcards in this deck.
Unlock Deck
k this deck
20
On a graph with x on the horizontal axis and y on the vertical axis,the origin is
A)the point where x = 0 and y = 0
B)any point where x = 0
C)any point where y = 0
D)where a curve intersects the vertical axis
E)where a curve intersects the horizontal axis
A)the point where x = 0 and y = 0
B)any point where x = 0
C)any point where y = 0
D)where a curve intersects the vertical axis
E)where a curve intersects the horizontal axis
Unlock Deck
Unlock for access to all 73 flashcards in this deck.
Unlock Deck
k this deck
21
The slope of a horizontal straight line is infinity.
Unlock Deck
Unlock for access to all 73 flashcards in this deck.
Unlock Deck
k this deck
22
The slope of a line is defined as the
A)change in the value of the variable on the vertical axis divided by the change in the value of the variable on the horizontal axis
B)value of the variable on the horizontal axis divided by the value of the intercept on the vertical axis
C)change in the value of the variable on the horizontal axis divided by the increase in the value of the variable on the vertical axis
D)value of the variable on the vertical axis divided by the value of the variable on the horizontal axis
E)change in the value of the variable on the vertical axis times the increase in the value of the variable on the horizontal axis
Unlock Deck
Unlock for access to all 73 flashcards in this deck.
Unlock Deck
k this deck
23
On a graph,the origin represents
A)the dependent variable
B)the variable that is the primary source of causation
C)a caption or explanatory description of the symbols,colors,and measurements used on the graph
D)the point at which the values of both variables are zero
E)ancestry
A)the dependent variable
B)the variable that is the primary source of causation
C)a caption or explanatory description of the symbols,colors,and measurements used on the graph
D)the point at which the values of both variables are zero
E)ancestry
Unlock Deck
Unlock for access to all 73 flashcards in this deck.
Unlock Deck
k this deck
24
The statement that there is an inverse relationship between x and y means that
A)x causes y
B)y causes x
C)x and y move in opposite directions
D)either y causes x or x causes y
E)there is no causal relationship between x and y
A)x causes y
B)y causes x
C)x and y move in opposite directions
D)either y causes x or x causes y
E)there is no causal relationship between x and y
Unlock Deck
Unlock for access to all 73 flashcards in this deck.
Unlock Deck
k this deck
25
Exhibit 1-6
Along the curve in Exhibit 1-6,
A)if P = $6,then Q = 8
B)if Q = 10,then P = $4
C)the slope is equal to -1
D)Q increases as P increases
E)there is a positive relationship between Q and P
Along the curve in Exhibit 1-6,
A)if P = $6,then Q = 8
B)if Q = 10,then P = $4
C)the slope is equal to -1
D)Q increases as P increases
E)there is a positive relationship between Q and P
Unlock Deck
Unlock for access to all 73 flashcards in this deck.
Unlock Deck
k this deck
26
A downward-sloping straight line has a decreasing slope.
Unlock Deck
Unlock for access to all 73 flashcards in this deck.
Unlock Deck
k this deck
27
If the dependent variable Y is directly related to the independent variable X,this means that changes in X cause changes in Y.
Unlock Deck
Unlock for access to all 73 flashcards in this deck.
Unlock Deck
k this deck
28
Exhibit 1-5
In Exhibit 1-5,curve A has a slope of
A)0
B)1.25
C)1.33
D)-1.25
E)-1.33
In Exhibit 1-5,curve A has a slope of
A)0
B)1.25
C)1.33
D)-1.25
E)-1.33
Unlock Deck
Unlock for access to all 73 flashcards in this deck.
Unlock Deck
k this deck
29
Exhibit 1-4
According to the curve in Exhibit 1-4,
A)if P = $8,then Q = 8
B)if P = $10,then Q = 10
C)Q increases as P increases
D)Q decreases as P decreases
E)there is a positive relation between Q and P
According to the curve in Exhibit 1-4,
A)if P = $8,then Q = 8
B)if P = $10,then Q = 10
C)Q increases as P increases
D)Q decreases as P decreases
E)there is a positive relation between Q and P
Unlock Deck
Unlock for access to all 73 flashcards in this deck.
Unlock Deck
k this deck
30
Any point on a graph represents a combination of particular values of two variables.
Unlock Deck
Unlock for access to all 73 flashcards in this deck.
Unlock Deck
k this deck
31
Exhibit 1-4
Which of the following must be true of line D in Exhibit 1-4?
A)A decrease in P is associated with a decrease in Q.
B)An increase in P is associated with an increase in Q.
C)There is no relation between P and Q.
D)There is an inverse relationship between P and Q.
E)There is a direct relationship between P and Q.
Unlock Deck
Unlock for access to all 73 flashcards in this deck.
Unlock Deck
k this deck
32
A graph is a
A)lengthy,inefficient,and inconvenient way to illustrate information
B)diagram illustrating a relationship between variables
C)method of proving causation
D)tool for incorporating all major and minor variables in one illustration
E)clear way to see how the fallacy of composition works
A)lengthy,inefficient,and inconvenient way to illustrate information
B)diagram illustrating a relationship between variables
C)method of proving causation
D)tool for incorporating all major and minor variables in one illustration
E)clear way to see how the fallacy of composition works
Unlock Deck
Unlock for access to all 73 flashcards in this deck.
Unlock Deck
k this deck
33
Exhibit 1-5
In Exhibit 1-5,curve B has a slope of
A)0
B)1.25
C)1.33
D)-1.25
E)-1.33
In Exhibit 1-5,curve B has a slope of
A)0
B)1.25
C)1.33
D)-1.25
E)-1.33
Unlock Deck
Unlock for access to all 73 flashcards in this deck.
Unlock Deck
k this deck
34
The slope of a vertical straight line is infinity.
Unlock Deck
Unlock for access to all 73 flashcards in this deck.
Unlock Deck
k this deck
35
A functional relationship exists between two variables if the value of one variable depends on the value of the other variable.
Unlock Deck
Unlock for access to all 73 flashcards in this deck.
Unlock Deck
k this deck
36
The slope of a steep upward-sloping line is a smaller value than the slope of a nearly flat upward-sloping line.
Unlock Deck
Unlock for access to all 73 flashcards in this deck.
Unlock Deck
k this deck
37
Exhibit 1-4
According to the curve in Exhibit 1-4,if P increases from $10 to $14,Q
A)stays the same
B)Q increases from 6 to 8
C)Q increases from 6 to 10
D)Q decreases from 6 to 2
E)Q decreases from 6 to 0
According to the curve in Exhibit 1-4,if P increases from $10 to $14,Q
A)stays the same
B)Q increases from 6 to 8
C)Q increases from 6 to 10
D)Q decreases from 6 to 2
E)Q decreases from 6 to 0
Unlock Deck
Unlock for access to all 73 flashcards in this deck.
Unlock Deck
k this deck
38
Exhibit 1-5
In Exhibit 1-5,curve A has a __________ slope that is __________ at every point.
A)positive; constant
B)positive; changing
C)negative; constant
D)negative; changing
E)changing; constant
In Exhibit 1-5,curve A has a __________ slope that is __________ at every point.
A)positive; constant
B)positive; changing
C)negative; constant
D)negative; changing
E)changing; constant
Unlock Deck
Unlock for access to all 73 flashcards in this deck.
Unlock Deck
k this deck
39
Exhibit 1-5
In Exhibit 1-5,curve B has a __________ slope that is __________ at every point.
A)positive; constant
B)positive; changing
C)negative; constant
D)negative; changing
E)changing; constant
In Exhibit 1-5,curve B has a __________ slope that is __________ at every point.
A)positive; constant
B)positive; changing
C)negative; constant
D)negative; changing
E)changing; constant
Unlock Deck
Unlock for access to all 73 flashcards in this deck.
Unlock Deck
k this deck
40
The statement that there is a direct relation between x and y means that
A)x and y move in the same direction
B)x causes y
C)y causes x
D)either y causes x or x causes y
E)the causal connection between x and y is immediate
A)x and y move in the same direction
B)x causes y
C)y causes x
D)either y causes x or x causes y
E)the causal connection between x and y is immediate
Unlock Deck
Unlock for access to all 73 flashcards in this deck.
Unlock Deck
k this deck
41
If slope = -2 for a line on a graph with x on the horizontal axis and y on the vertical axis,then if
A)x increases by 4,y increases by 8
B)x increases by 4,y increases by 2
C)y increases by 4,x increases by 8
D)x = 4,y = 8
E)x increases by 4,y decreases by 8
A)x increases by 4,y increases by 8
B)x increases by 4,y increases by 2
C)y increases by 4,x increases by 8
D)x = 4,y = 8
E)x increases by 4,y decreases by 8
Unlock Deck
Unlock for access to all 73 flashcards in this deck.
Unlock Deck
k this deck
42
Moderate exercise is better than none,but excessive exercise is harmful.What is the shape of the graph of health benefits versus hours of exercise per week if health benefits are measured on the vertical axis and exercise is measured on the horizontal axis?
A)a positively sloped straight line
B)a negatively sloped straight line
C)a vertical straight line
D)a U-shaped curve
E)a hill-shaped curve
A)a positively sloped straight line
B)a negatively sloped straight line
C)a vertical straight line
D)a U-shaped curve
E)a hill-shaped curve
Unlock Deck
Unlock for access to all 73 flashcards in this deck.
Unlock Deck
k this deck
43
Suppose a graph with Ron's weight on the vertical axis and his consumption of ice cream on the horizontal axis indicated that for each serving of ice cream he ate,Ron would gain 3 pounds,regardless of how much ice cream he had already eaten.This graph would show a
A)horizontal line at weight = 3
B)straight line with slope = 3
C)straight line with slope = 1/2
D)straight line with slope = -3
E)straight line with slope = -1/3
A)horizontal line at weight = 3
B)straight line with slope = 3
C)straight line with slope = 1/2
D)straight line with slope = -3
E)straight line with slope = -1/3
Unlock Deck
Unlock for access to all 73 flashcards in this deck.
Unlock Deck
k this deck
44
A U-shaped curve has a positive slope everywhere.
Unlock Deck
Unlock for access to all 73 flashcards in this deck.
Unlock Deck
k this deck
45
If slope = 2 for a line on a graph with x on the horizontal axis and y on the vertical axis,then if
A)x decreases by 4,y decreases by 8
B)x = -4,then y = -2
C)y decreases by 4,x decreases by 8
D)x = -4,y = -8
E)x increases by 4,y decreases by 8
A)x decreases by 4,y decreases by 8
B)x = -4,then y = -2
C)y decreases by 4,x decreases by 8
D)x = -4,y = -8
E)x increases by 4,y decreases by 8
Unlock Deck
Unlock for access to all 73 flashcards in this deck.
Unlock Deck
k this deck
46
A straight line tangent to a curved line at a point
A)crosses the curved line at that point
B)crosses the curved line at many points
C)has the same slope as the curved line at that point
D)is steeper than the curve at all other points
E)has a smaller slope than all other points on the curve
A)crosses the curved line at that point
B)crosses the curved line at many points
C)has the same slope as the curved line at that point
D)is steeper than the curve at all other points
E)has a smaller slope than all other points on the curve
Unlock Deck
Unlock for access to all 73 flashcards in this deck.
Unlock Deck
k this deck
47
Suppose the cost of producing copper tubing is $1 per foot.If production costs were measured on the vertical axis and quantity of copper tubing were measured on the horizontal axis,which of the following lines would have the smallest slope?
A)a line representing the quantity of tubing measured in inches
B)a line representing the quantity of tubing measured in feet
C)a line representing the quantity of tubing measured in yards
D)the 45-degree line
E)any vertical line
A)a line representing the quantity of tubing measured in inches
B)a line representing the quantity of tubing measured in feet
C)a line representing the quantity of tubing measured in yards
D)the 45-degree line
E)any vertical line
Unlock Deck
Unlock for access to all 73 flashcards in this deck.
Unlock Deck
k this deck
48
Exhibit 1-10
In Exhibit 1-10,the slope of the line is
A)negative for all values of x
B)positive for all values of x
C)zero at x = 7
D)first negative,then positive as x increases
E)negative for all values of y
In Exhibit 1-10,the slope of the line is
A)negative for all values of x
B)positive for all values of x
C)zero at x = 7
D)first negative,then positive as x increases
E)negative for all values of y
Unlock Deck
Unlock for access to all 73 flashcards in this deck.
Unlock Deck
k this deck
49
The slope of a U-shaped curve is infinity at the bottom of the U.
Unlock Deck
Unlock for access to all 73 flashcards in this deck.
Unlock Deck
k this deck
50
The slope of an inverted U-shaped curve is infinity at the top of the curve.
Unlock Deck
Unlock for access to all 73 flashcards in this deck.
Unlock Deck
k this deck
51
Exhibit 1-8
The slope of a vertical line is
A)infinitely large
B)zero
C)positive
D)negative
E)infinitely small
The slope of a vertical line is
A)infinitely large
B)zero
C)positive
D)negative
E)infinitely small
Unlock Deck
Unlock for access to all 73 flashcards in this deck.
Unlock Deck
k this deck
52
Ron weighs 150 pounds.A graph relating Ron's weight on the vertical axis to Nancy's consumption of ice cream on the horizontal axis would be
A)a horizontal line at weight = 150
B)a horizontal line at weight = 0
C)a positively sloped line with decreasing slope
D)a vertical line at weight = 150
E)the origin
A)a horizontal line at weight = 150
B)a horizontal line at weight = 0
C)a positively sloped line with decreasing slope
D)a vertical line at weight = 150
E)the origin
Unlock Deck
Unlock for access to all 73 flashcards in this deck.
Unlock Deck
k this deck
53
One economic application of the slope of a line is
A)measuring unlimited wants
B)behavioral analysis
C)marginal analysis
D)allocative efficiency
E)rational self-interest
A)measuring unlimited wants
B)behavioral analysis
C)marginal analysis
D)allocative efficiency
E)rational self-interest
Unlock Deck
Unlock for access to all 73 flashcards in this deck.
Unlock Deck
k this deck
54
The numerical value of the slope of a line depends in part on the units of measurement used.
Unlock Deck
Unlock for access to all 73 flashcards in this deck.
Unlock Deck
k this deck
55
The slope of a line
A)can only be calculated for straight lines
B)varies at different points along a straight line
C)indicates whether or not there is a causal relationship between variables
D)is independent of the units of measurement used
E)indicates how much the vertical variable changes for a given change in the horizontal variable
Unlock Deck
Unlock for access to all 73 flashcards in this deck.
Unlock Deck
k this deck
56
Exhibit 1-8
The slope of the line in Exhibit 1-8 is
A)0.1
B)1
C)10
D)-0.1
E)-10
The slope of the line in Exhibit 1-8 is
A)0.1
B)1
C)10
D)-0.1
E)-10
Unlock Deck
Unlock for access to all 73 flashcards in this deck.
Unlock Deck
k this deck
57
Exhibit 1-7
The slope of the straight line in Exhibit 1-7 is
A)greater at point a than at point b
B)the same at points a and b
C)zero because the line is straight
D)negative because an inverse relation is shown
E)positive because the line lies to the right of the y-axis
The slope of the straight line in Exhibit 1-7 is
A)greater at point a than at point b
B)the same at points a and b
C)zero because the line is straight
D)negative because an inverse relation is shown
E)positive because the line lies to the right of the y-axis
Unlock Deck
Unlock for access to all 73 flashcards in this deck.
Unlock Deck
k this deck
58
A curved line may have a positive slope or a negative slope,but it cannot have both positive and negative areas of slope.
Unlock Deck
Unlock for access to all 73 flashcards in this deck.
Unlock Deck
k this deck
59
A line is tangent to a curve if it
A)crosses the curve at one point
B)touches the curve at one point,without crossing it
C)crosses the curve at a minimum of two points
D)never touches the curve
E)forms a right triangle with the curve
A)crosses the curve at one point
B)touches the curve at one point,without crossing it
C)crosses the curve at a minimum of two points
D)never touches the curve
E)forms a right triangle with the curve
Unlock Deck
Unlock for access to all 73 flashcards in this deck.
Unlock Deck
k this deck
60
Exhibit 1-8
The slope of a horizontal line is
A)infinitely large
B)zero
C)positive
D)negative
E)infinitely small
The slope of a horizontal line is
A)infinitely large
B)zero
C)positive
D)negative
E)infinitely small
Unlock Deck
Unlock for access to all 73 flashcards in this deck.
Unlock Deck
k this deck
61
Exhibit 1-14
Using Exhibit 1-14,calculate the slope of the curve where x equals 50.
A)0
B)1
C)infinite
D)-1
E)the slope cannot be determined because there is no tangent line
Using Exhibit 1-14,calculate the slope of the curve where x equals 50.
A)0
B)1
C)infinite
D)-1
E)the slope cannot be determined because there is no tangent line
Unlock Deck
Unlock for access to all 73 flashcards in this deck.
Unlock Deck
k this deck
62
Exhibit 1-16
Refer to exhibit 1-16.Which of the graphs illustrates an inverse or negative relationship between variable X and variable Y?
A)a
B)b
C)c
D)d
E)e
Refer to exhibit 1-16.Which of the graphs illustrates an inverse or negative relationship between variable X and variable Y?
A)a
B)b
C)c
D)d
E)e
Unlock Deck
Unlock for access to all 73 flashcards in this deck.
Unlock Deck
k this deck
63
The part of a graph that is most applicable to marginal analysis is the
A)origin
B)slope
C)horizontal axis
D)dependent variable
E)inverse relation
A)origin
B)slope
C)horizontal axis
D)dependent variable
E)inverse relation
Unlock Deck
Unlock for access to all 73 flashcards in this deck.
Unlock Deck
k this deck
64
Exhibit 1-16
Refer to exhibit 1-16.Which of the graphs illustrates no relationship between variable X and variable Y?
A)a
B)b
C)c
D)d
E)e
Refer to exhibit 1-16.Which of the graphs illustrates no relationship between variable X and variable Y?
A)a
B)b
C)c
D)d
E)e
Unlock Deck
Unlock for access to all 73 flashcards in this deck.
Unlock Deck
k this deck
65
Exhibit 1-16
Refer to exhibit 1-16.Which of the graphs illustrates a direct or positive relationship between variable X and variable Y?
A)a
B)b
C)c
D)d
E)e
Refer to exhibit 1-16.Which of the graphs illustrates a direct or positive relationship between variable X and variable Y?
A)a
B)b
C)c
D)d
E)e
Unlock Deck
Unlock for access to all 73 flashcards in this deck.
Unlock Deck
k this deck
66
Most economics graphs reflect the relationship between how many economic variables?
A)three
B)two
C)four
D)thirty
E)twenty
A)three
B)two
C)four
D)thirty
E)twenty
Unlock Deck
Unlock for access to all 73 flashcards in this deck.
Unlock Deck
k this deck
67
Exhibit 1-16
Refer to Exhibit 1-16.Which graph illustrates a positive relationship between variable X and variable Y initially but then a negative relationship?
A)a
B)b
C)c
D)d
E)e
Refer to Exhibit 1-16.Which graph illustrates a positive relationship between variable X and variable Y initially but then a negative relationship?
A)a
B)b
C)c
D)d
E)e
Unlock Deck
Unlock for access to all 73 flashcards in this deck.
Unlock Deck
k this deck
68
Exhibit 1-16
Refer to Exhibit 1-16.Which graph illustrates a negative relationship between variable X and variable Y initially but then a positive relationship?
A)a
B)b
C)c
D)d
E)e
Refer to Exhibit 1-16.Which graph illustrates a negative relationship between variable X and variable Y initially but then a positive relationship?
A)a
B)b
C)c
D)d
E)e
Unlock Deck
Unlock for access to all 73 flashcards in this deck.
Unlock Deck
k this deck
69
Exhibit 1-15
Refer to Exhibit 1-15.The reason that Line (a)would shift to the position of Line (b)is
A)a change in quantity
B)a change in price
C)a change in an assumption about the relationship between the two variables observed
D)a change from a positive relation to a negative relation
E)a change from a negative relation to a positive relation
Unlock Deck
Unlock for access to all 73 flashcards in this deck.
Unlock Deck
k this deck
70
Exhibit 1-12
The slope of the line in Exhibit 1-12 is
A)positive and constant
B)positive and increasing
C)positive and decreasing
D)negative and increasing
E)negative and decreasing
The slope of the line in Exhibit 1-12 is
A)positive and constant
B)positive and increasing
C)positive and decreasing
D)negative and increasing
E)negative and decreasing
Unlock Deck
Unlock for access to all 73 flashcards in this deck.
Unlock Deck
k this deck
71
A tangent line is a straight line
A)that intersects a curved line twice
B)with a slope equal to infinity
C)that touches a curved line at only one point
D)that intersects a curved line at several points
E)that runs along the vertical axis
A)that intersects a curved line twice
B)with a slope equal to infinity
C)that touches a curved line at only one point
D)that intersects a curved line at several points
E)that runs along the vertical axis
Unlock Deck
Unlock for access to all 73 flashcards in this deck.
Unlock Deck
k this deck
72
Exhibit 1-11
In Exhibit 1-11,the slope of the line is
A)negative for all values of x
B)positive for all values of x
C)never zero
D)first negative,then positive as x increases
E)first rising,then falling as x increases
In Exhibit 1-11,the slope of the line is
A)negative for all values of x
B)positive for all values of x
C)never zero
D)first negative,then positive as x increases
E)first rising,then falling as x increases
Unlock Deck
Unlock for access to all 73 flashcards in this deck.
Unlock Deck
k this deck
73
A line on a graph will shift if
A)the independent variable changes
B)there are no changes in any variables considered in the model
C)there is a change in a variable that had previously been assumed to be constant
D)a change in the independent variable causes a change in the dependent variable
E)the independent variable and the dependent variable are unrelated
Unlock Deck
Unlock for access to all 73 flashcards in this deck.
Unlock Deck
k this deck
Unlock Deck
Unlock for access to all 73 flashcards in this deck.


