Deck 3: Descriptive Statistics: Numerical Methods
Full screen (f)
Question
Question
Question
Question
Question
Question
Question
Question
Question
Question
Question
Question
Question
Question
Question
Question
Question
Question
Question
Question
Question
Question
Question
Question
Question
Question
Question
Question
Question
Question
Question
Question
Question
Question
Question
Question
Question
Question
Question
Question
Question
A company CEO asked the marketing research department to find the average age of consumers who bought the most profitable product made by the company.From survey data gathered two years ago,the researchers found the following table.Calculate the average age to give to the CEO. 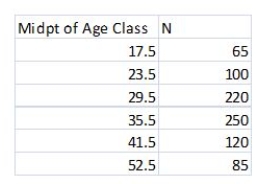
Question
Find the weighted mean per capita income for the following random sample of six cities in the Midwest. 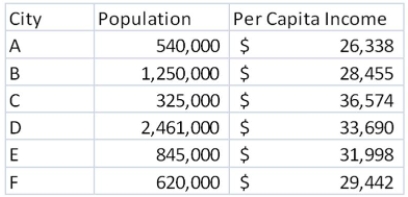
Question
Following a factor analysis of 15 personality characteristic ratings of politicians by a random sample of 40,000 registered voters,the following table of the first 7 factors and their corresponding eigenvalues and percentage of explained variation was produced.Which factors should an analyst choose when defining the characteristics of politicians? 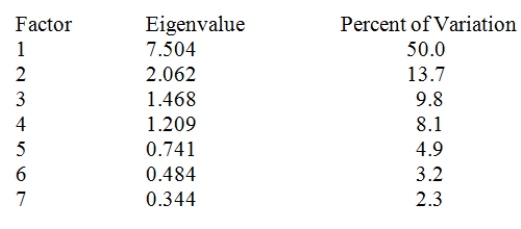
Question
Question
Question
A manufacturer of Product X has developed a model for predicting monthly sales of their product based on the sales from the same month of the previous year and the forecasted average daily temperature for the month.Using the regression tree below based on a random sample of 30 observations,predict sales for a future where the previous year's monthly sales were $15 million dollars and the forecasted average daily temperature for the month will be 45 degrees. 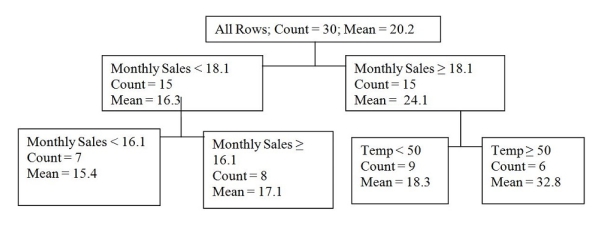
Question
Question
Question
Question
Question
A local grocery market is studying whether to offer a loyalty program to its customers.In its final analyses the following groups are being used to categorize loyalty card customers: family income and number of children.Using the classification tree below,estimate the percentage of customers with an income of $50,000 with 2 children who would use a loyalty card 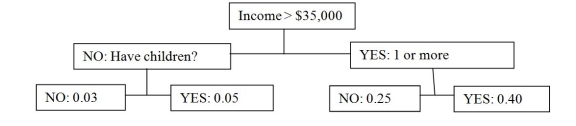
Question
Question
Question
Question
A manufacturer of Product X has developed a model for predicting monthly sales of their product based on the sales from the same month of the previous year and the forecasted average daily temperature for the month.Using the regression tree below based on a random sample of 30 observations predict sales for a future where the previous year's monthly sales were $21.2 million dollars and the forecasted average daily temperature for the month will be 45 degrees. 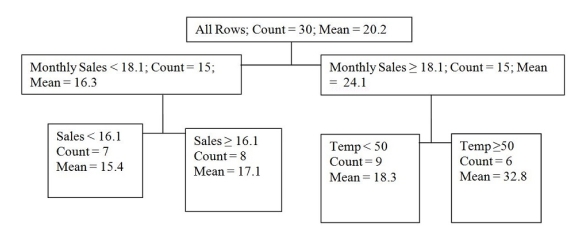
Question
Question

Unlock Deck
Sign up to unlock the cards in this deck!
Unlock Deck
Unlock Deck
1/57
Play
Full screen (f)
Deck 3: Descriptive Statistics: Numerical Methods
1
The median is the value below which and above which approximately 50 percent of the measurements lie.
True
2
If there are seven classes in a frequency distribution,then the fourth class will always contain the median.
False
3
In a symmetric population,the median equals the mode.
True
4
The line that minimizes the sum of the squared horizontal (x)distances between the points on the scatter plot and the line is the least squares line.
Unlock Deck
Unlock for access to all 57 flashcards in this deck.
Unlock Deck
k this deck
5
The mode is the measurement in a sample or population that occurs most frequently.
Unlock Deck
Unlock for access to all 57 flashcards in this deck.
Unlock Deck
k this deck
6
Range is a better measure of variation than standard deviation.
Unlock Deck
Unlock for access to all 57 flashcards in this deck.
Unlock Deck
k this deck
7
The weights that are used in calculating a weighted mean will vary depending on the situation.
Unlock Deck
Unlock for access to all 57 flashcards in this deck.
Unlock Deck
k this deck
8
The median is the measure of central tendency that divides a population or sample into four equal parts.
Unlock Deck
Unlock for access to all 57 flashcards in this deck.
Unlock Deck
k this deck
9
The mean is one component of the five-number summary.
Unlock Deck
Unlock for access to all 57 flashcards in this deck.
Unlock Deck
k this deck
10
The range of the measurement is the largest measurement plus the smallest measurement.
Unlock Deck
Unlock for access to all 57 flashcards in this deck.
Unlock Deck
k this deck
11
The population mean is the point estimate of the sample mean.
Unlock Deck
Unlock for access to all 57 flashcards in this deck.
Unlock Deck
k this deck
12
It is appropriate to use the Empirical Rule to describe a population that is extremely skewed.
Unlock Deck
Unlock for access to all 57 flashcards in this deck.
Unlock Deck
k this deck
13
The population mean is the average of the population measurements.
Unlock Deck
Unlock for access to all 57 flashcards in this deck.
Unlock Deck
k this deck
14
Chebyshev's Theorem is only of practical use when analyzing a non-mound-shaped population that is not very skewed.
Unlock Deck
Unlock for access to all 57 flashcards in this deck.
Unlock Deck
k this deck
15
The median is said to be resistant to extreme values.
Unlock Deck
Unlock for access to all 57 flashcards in this deck.
Unlock Deck
k this deck
16
The population variance is the average of the squared deviations of the individual population measurements from the population mean.
Unlock Deck
Unlock for access to all 57 flashcards in this deck.
Unlock Deck
k this deck
17
The pth percentile is a value such that (100−p)percent of the measurements fall at or below the value.
Unlock Deck
Unlock for access to all 57 flashcards in this deck.
Unlock Deck
k this deck
18
Z-score is often used as a measure of risk.
Unlock Deck
Unlock for access to all 57 flashcards in this deck.
Unlock Deck
k this deck
19
Data summarized in a frequency distribution or histogram form are often called weighted data.
Unlock Deck
Unlock for access to all 57 flashcards in this deck.
Unlock Deck
k this deck
20
A correlation coefficient close to −1 says x and y are highly related.
Unlock Deck
Unlock for access to all 57 flashcards in this deck.
Unlock Deck
k this deck
21
In the calculation of a mean for grouped data,we assume that the average of the measurements in each class equals the class midpoint.
Unlock Deck
Unlock for access to all 57 flashcards in this deck.
Unlock Deck
k this deck
22
The average of the squared deviations of the individual population measurement from the population mean is the ___________.
A) standard deviation
B) mean
C) variance
D) median
E) range
A) standard deviation
B) mean
C) variance
D) median
E) range
Unlock Deck
Unlock for access to all 57 flashcards in this deck.
Unlock Deck
k this deck
23
If the mean is greater than the median,then the distribution is ___________.
A) skewed right
B) skewed left
C) symmetrical
D) bimodal
A) skewed right
B) skewed left
C) symmetrical
D) bimodal
Unlock Deck
Unlock for access to all 57 flashcards in this deck.
Unlock Deck
k this deck
24
The measurement in a sample or a population that occurs most frequently is the ___________.
A) mode
B) mean
C) median
D) outlier
E) average
A) mode
B) mean
C) median
D) outlier
E) average
Unlock Deck
Unlock for access to all 57 flashcards in this deck.
Unlock Deck
k this deck
25
The geometric mean is the rate of change that yields better wealth at the end of a set of time periods than the actual returns.
Unlock Deck
Unlock for access to all 57 flashcards in this deck.
Unlock Deck
k this deck
26
A measurement located outside the upper limits of a box-and-whiskers display is ___________.
A) always in the first quartile
B) an outlier
C) always the largest value in the data set
D) within the lower limits
A) always in the first quartile
B) an outlier
C) always the largest value in the data set
D) within the lower limits
Unlock Deck
Unlock for access to all 57 flashcards in this deck.
Unlock Deck
k this deck
27
When using Chebyshev'sTheorem to obtain the bounds for 99.73 percent of the values in a population,the interval generally will be ___________ the interval obtained for the same percentage if a normal distribution is assumed (Empirical Rule).
A) shorter than
B) wider than
C) the same as
A) shorter than
B) wider than
C) the same as
Unlock Deck
Unlock for access to all 57 flashcards in this deck.
Unlock Deck
k this deck
28
If the mean,median,and mode for a given population all equal 25,then we know that the shape of the distribution of the population is ____________.
A) bimodal
B) skewed to the right
C) symmetrical
D) skewed to the left
A) bimodal
B) skewed to the right
C) symmetrical
D) skewed to the left
Unlock Deck
Unlock for access to all 57 flashcards in this deck.
Unlock Deck
k this deck
29
A disadvantage of using grouping (a frequency table)with sample data is that
A) calculations involving central tendency and variation are more complicated than central tendency and variation calculations based on ungrouped data.
B) the descriptive statistics are less precise than the descriptive statistics obtained using ungrouped data.
C) the interpretation of the grouped data descriptive statistics is meaningless.
D) it is much more difficult to summarize the information than it is with the ungrouped data.
Unlock Deck
Unlock for access to all 57 flashcards in this deck.
Unlock Deck
k this deck
30
Another name for the 50th percentile is the ___________.
A) mean
B) first quartile
C) median
D) mode
E) third quartile
A) mean
B) first quartile
C) median
D) mode
E) third quartile
Unlock Deck
Unlock for access to all 57 flashcards in this deck.
Unlock Deck
k this deck
31
A quantity that measures the variation of a population or a sample relative to its mean is called the ____________.
A) range
B) standard deviation
C) coefficient of variation
D) variance
E) interquartile range
A) range
B) standard deviation
C) coefficient of variation
D) variance
E) interquartile range
Unlock Deck
Unlock for access to all 57 flashcards in this deck.
Unlock Deck
k this deck
32
Which percentile describes the third quartile,Q3?
A) 25th
B) 50th
C) 75th
D) 100th
A) 25th
B) 50th
C) 75th
D) 100th
Unlock Deck
Unlock for access to all 57 flashcards in this deck.
Unlock Deck
k this deck
33
As a measure of variation,the sample ___________ is easy to understand and compute.It is based on the two extreme values and is therefore a highly unstable measure.
A) range
B) standard deviation
C) variance
D) interquartile range
E) coefficient of variation
A) range
B) standard deviation
C) variance
D) interquartile range
E) coefficient of variation
Unlock Deck
Unlock for access to all 57 flashcards in this deck.
Unlock Deck
k this deck
34
Which percentile describes the first quartile,Q1?
A) 25th
B) 50th
C) 75th
D) 100th
A) 25th
B) 50th
C) 75th
D) 100th
Unlock Deck
Unlock for access to all 57 flashcards in this deck.
Unlock Deck
k this deck
35
The ending value of an initial investment can be calculated using weighted means.
Unlock Deck
Unlock for access to all 57 flashcards in this deck.
Unlock Deck
k this deck
36
If a population distribution is skewed to the right,then,given a random sample from that population,one would expect that the ____________.
A) median would be greater than the mean
B) mode would be equal to the mean
C) median would be less than the mean
D) median would be equal to the mean
A) median would be greater than the mean
B) mode would be equal to the mean
C) median would be less than the mean
D) median would be equal to the mean
Unlock Deck
Unlock for access to all 57 flashcards in this deck.
Unlock Deck
k this deck
37
All of the following are measures of central tendency except the ____________.
A) range
B) mode
C) mean
D) median
A) range
B) mode
C) mean
D) median
Unlock Deck
Unlock for access to all 57 flashcards in this deck.
Unlock Deck
k this deck
38
Which of the following is influenced the least by the occurrence of extreme values in a sample?
A) mean
B) median
C) geometric mean
D) weighted mean
A) mean
B) median
C) geometric mean
D) weighted mean
Unlock Deck
Unlock for access to all 57 flashcards in this deck.
Unlock Deck
k this deck
39
When calculating the geometric mean,a quantity of 1 is added to the nth root of the product (1 + R1)(1 + R2)...(1 + Rn).
Unlock Deck
Unlock for access to all 57 flashcards in this deck.
Unlock Deck
k this deck
40
A normal population has 99.73 percent of the population measurements within __________ standard deviation(s)of the mean.
A) 1
B) 2
C) 3
D) 4
A) 1
B) 2
C) 3
D) 4
Unlock Deck
Unlock for access to all 57 flashcards in this deck.
Unlock Deck
k this deck
41
A company CEO asked the marketing research department to find the average age of consumers who bought the most profitable product made by the company.From survey data gathered two years ago,the researchers found the following table.Calculate the average age to give to the CEO.
Unlock Deck
Unlock for access to all 57 flashcards in this deck.
Unlock Deck
k this deck
42
Find the weighted mean per capita income for the following random sample of six cities in the Midwest.
Unlock Deck
Unlock for access to all 57 flashcards in this deck.
Unlock Deck
k this deck
43
Following a factor analysis of 15 personality characteristic ratings of politicians by a random sample of 40,000 registered voters,the following table of the first 7 factors and their corresponding eigenvalues and percentage of explained variation was produced.Which factors should an analyst choose when defining the characteristics of politicians?
Unlock Deck
Unlock for access to all 57 flashcards in this deck.
Unlock Deck
k this deck
44
The geometric mean growth rate of sales for used cars in a geographic area from 2005 to 2009 was 16.42 percent.Annual sales in 2005 were $14.2 million.Find the ending value of sales after this four-year period.
Unlock Deck
Unlock for access to all 57 flashcards in this deck.
Unlock Deck
k this deck
45
At the end of 2007,the IRA owned by Joe Smith had a value of $1.2 million.With a rate of return of −29.75 percent in 2008 and a rate of return of 2.98 percent in 2009,calculate the geometric mean rate of return for the two-year period.
Unlock Deck
Unlock for access to all 57 flashcards in this deck.
Unlock Deck
k this deck
46
A manufacturer of Product X has developed a model for predicting monthly sales of their product based on the sales from the same month of the previous year and the forecasted average daily temperature for the month.Using the regression tree below based on a random sample of 30 observations,predict sales for a future where the previous year's monthly sales were $15 million dollars and the forecasted average daily temperature for the month will be 45 degrees.
Unlock Deck
Unlock for access to all 57 flashcards in this deck.
Unlock Deck
k this deck
47
An interval that contains a specified percentage of the individual measurements is called a(n)_______________ interval.
A) three-sigma
B) tolerance
C) normal
D) empirical
A) three-sigma
B) tolerance
C) normal
D) empirical
Unlock Deck
Unlock for access to all 57 flashcards in this deck.
Unlock Deck
k this deck
48
An initial investment of $10,000 has a value of $7,382 at the end of year 1.What is the rate of return for the first year?
Unlock Deck
Unlock for access to all 57 flashcards in this deck.
Unlock Deck
k this deck
49
Suppose that annual sales for a company were $3.6 million at the beginning of a three-year period and at the end had increased to $6.1 million.Find the geometric growth rate of sales.
Unlock Deck
Unlock for access to all 57 flashcards in this deck.
Unlock Deck
k this deck
50
An initial investment of $10,000 is observed over 3 years with a geometric mean return at the end of year 3 of 0.512.Determine the value of the investment after 3 years.
Unlock Deck
Unlock for access to all 57 flashcards in this deck.
Unlock Deck
k this deck
51
A local grocery market is studying whether to offer a loyalty program to its customers.In its final analyses the following groups are being used to categorize loyalty card customers: family income and number of children.Using the classification tree below,estimate the percentage of customers with an income of $50,000 with 2 children who would use a loyalty card
Unlock Deck
Unlock for access to all 57 flashcards in this deck.
Unlock Deck
k this deck
52
The point estimate of the _______________ is the positive square root of the sample variance.
A) sample mean
B) sample standard deviation
C) range
D) median
E) population standard deviation
A) sample mean
B) sample standard deviation
C) range
D) median
E) population standard deviation
Unlock Deck
Unlock for access to all 57 flashcards in this deck.
Unlock Deck
k this deck
53
Which of the following is a measure of the strength of the linear relationship between x and y that is dependent on the units in which x and y are measured.
A) covariance
B) correlation coefficient
C) slope
D) least squares line
A) covariance
B) correlation coefficient
C) slope
D) least squares line
Unlock Deck
Unlock for access to all 57 flashcards in this deck.
Unlock Deck
k this deck
54
The ______________ is a quantity that measures the variation of a population or sample relative to its mean.
A) mean
B) standard deviation
C) range
D) coefficient of variation
E) Z-score
A) mean
B) standard deviation
C) range
D) coefficient of variation
E) Z-score
Unlock Deck
Unlock for access to all 57 flashcards in this deck.
Unlock Deck
k this deck
55
A manufacturer of Product X has developed a model for predicting monthly sales of their product based on the sales from the same month of the previous year and the forecasted average daily temperature for the month.Using the regression tree below based on a random sample of 30 observations predict sales for a future where the previous year's monthly sales were $21.2 million dollars and the forecasted average daily temperature for the month will be 45 degrees.
Unlock Deck
Unlock for access to all 57 flashcards in this deck.
Unlock Deck
k this deck
56
As the coefficient of variation _______________,risk ______________.
A) increases,decreases
B) decreases,increases
C) increases,increases
D) remains constant,increases
A) increases,decreases
B) decreases,increases
C) increases,increases
D) remains constant,increases
Unlock Deck
Unlock for access to all 57 flashcards in this deck.
Unlock Deck
k this deck
57
The rate of return for each of the past four years on a market fund are R1 = 2.4%,R2 = 1.0%,R3 = −3.2%,and R4 = 0.5%.Find the geometric mean rate of return.
Unlock Deck
Unlock for access to all 57 flashcards in this deck.
Unlock Deck
k this deck
Unlock Deck
Unlock for access to all 57 flashcards in this deck.


