Deck 5: Displaying and Describing Quantitative Data
Full screen (f)
Question
Consider the following to answer the question(s) below:
A consumer research group investigating the relationship between the price of meat (per kilogram) and the fat content (grams) gathered data that produced the following scatterplot.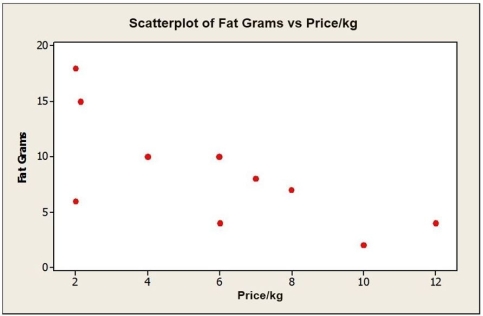
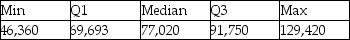
Below is the five-number summary of salaries (in $) for a sample of marketing managers.
 a. Would you expect the mean salary for this sample of marketing managers to be higher or lower than the median? Explain.
b. Which would be a more appropriate measure of central tendency for these data, the mean or median? Explain.
c. Calculate the range.
d. Calculate the IQR.
A consumer research group investigating the relationship between the price of meat (per kilogram) and the fat content (grams) gathered data that produced the following scatterplot.
Below is the five-number summary of salaries (in $) for a sample of marketing managers.
a. Would you expect the mean salary for this sample of marketing managers to be higher or lower than the median? Explain.b. Which would be a more appropriate measure of central tendency for these data, the mean or median? Explain.
c. Calculate the range.
d. Calculate the IQR.
Question
Consider the following to answer the question(s) below:
A consumer research group investigating the relationship between the price of meat (per kilogram) and the fat content (grams) gathered data that produced the following scatterplot.
The boxplots below show the closing share prices for a sample of companies on the first trading days in August 2015 and in August 2010.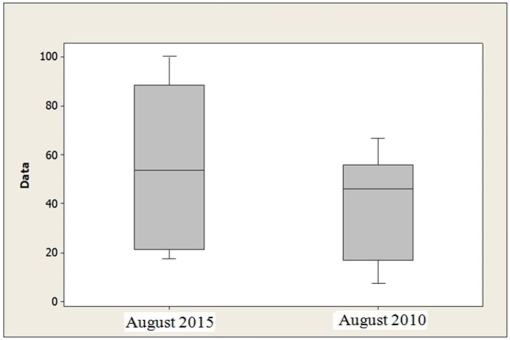 a. For which day was the median closing share price higher?
b. For which day were the closing share prices more variable? Explain.
c. Which distribution is more symmetric? Explain.
A consumer research group investigating the relationship between the price of meat (per kilogram) and the fat content (grams) gathered data that produced the following scatterplot.
The boxplots below show the closing share prices for a sample of companies on the first trading days in August 2015 and in August 2010.
a. For which day was the median closing share price higher?b. For which day were the closing share prices more variable? Explain.
c. Which distribution is more symmetric? Explain.
Question
Consider the following to answer the question(s) below:
Below is a histogram and the five-number summary for salaries (in $) for a sample of marketing managers.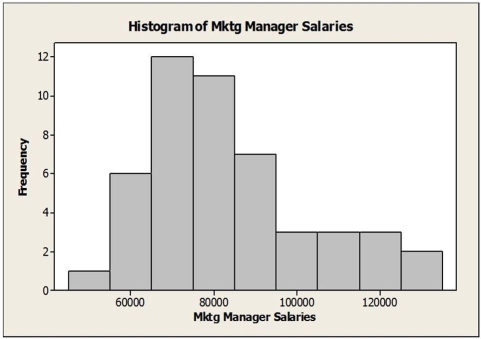
Suppose the marketing manager who was earning $129,420 got a raise and is now earning $140,000. Which one of the following statements is true?
A) The mean would increase.
B) The median would increase.
C) The range would stay the same.
D) The IQR would increase.
E) The IQR would decrease.
Question
Consider the following to answer the question(s) below:
Below is a histogram and the five-number summary for salaries (in $) for a sample of marketing managers.
The most appropriate measure of central tendency for these data is the
A) median.
B) mean.
C) mode.
D) range.
E) standard deviation.
Below is a histogram and the five-number summary for salaries (in $) for a sample of marketing managers.
The most appropriate measure of central tendency for these data is the
A) median.
B) mean.
C) mode.
D) range.
E) standard deviation.
Question
Consider the following to answer the question(s) below:
A consumer research group investigating the relationship between the price of meat (per kilogram) and the fat content (grams) gathered data that produced the following scatterplot.
Below is the five-number summary of the hourly wages ($) for advertising / promotion managers.
 a. Would you expect the mean salary for this sample of marketing managers to be higher or lower than the median? Explain.
b. Which would be a more appropriate measure of central tendency for these data, the mean or median? Explain.
c. Calculate the range.
d. Calculate the IQR.
A consumer research group investigating the relationship between the price of meat (per kilogram) and the fat content (grams) gathered data that produced the following scatterplot.
Below is the five-number summary of the hourly wages ($) for advertising / promotion managers.
a. Would you expect the mean salary for this sample of marketing managers to be higher or lower than the median? Explain.b. Which would be a more appropriate measure of central tendency for these data, the mean or median? Explain.
c. Calculate the range.
d. Calculate the IQR.
Question
Consider the following to answer the question(s) below:
Below is a histogram and the five-number summary for salaries (in $) for a sample of marketing managers.
Do the data contain any outliers as determined by the five-number summary?
A) only at the upper end
B) only at the lower end
C) at the upper and the lower ends
D) There are no outliers.
E) There are two outliers.
Question
Consider the following to answer the question(s) below:
A consumer research group investigating the relationship between the price of meat (per kilogram) and the fat content (grams) gathered data that produced the following scatterplot.
The table below shows data on total assets ($ million) for a sample of bank branches. Prepare a stem-and-leaf display. Comment on the shape of the distribution.
Question
Consider the following to answer the question(s) below:
Below is a histogram and the five-number summary for salaries (in $) for a sample of marketing managers.
The upper and lower "fences" for a boxplot of these data are
A) $47,636 and $113,807.
B) $43,934.5 and $110,105.5.
C) $54,963 and $99,077.
D) $36,607.5 and $124,835.5.
E) $58,664.5 and $102,778.5.
Question
Consider the following to answer the question(s) below:
A consumer research group investigating the relationship between the price of meat (per kilogram) and the fat content (grams) gathered data that produced the following scatterplot.
Below is the five-number summary of salaries (in $) for a sample of marketing managers.
 Suppose the marketing manager who was earning $129,420 got a raise and is now earning $140,000. Indicate how this change would affect the following summary statistics (increase, decrease, or stay about the same).
a. Mean
b. Median
c. Range
d. IQR
e. Standard deviation
A consumer research group investigating the relationship between the price of meat (per kilogram) and the fat content (grams) gathered data that produced the following scatterplot.
Below is the five-number summary of salaries (in $) for a sample of marketing managers.
Suppose the marketing manager who was earning $129,420 got a raise and is now earning $140,000. Indicate how this change would affect the following summary statistics (increase, decrease, or stay about the same).a. Mean
b. Median
c. Range
d. IQR
e. Standard deviation
Question
Consider the following to answer the question(s) below:
The table below shows closing share prices for a small sample of companies.
The standard deviation of the closing share prices is
A) $31.43.
B) $44.65.
C) $56.99.
D) $62.19.
E) $75.77.
The table below shows closing share prices for a small sample of companies.
The standard deviation of the closing share prices is
A) $31.43.
B) $44.65.
C) $56.99.
D) $62.19.
E) $75.77.
Question
Consider the following to answer the question(s) below:
A consumer research group investigating the relationship between the price of meat (per kilogram) and the fat content (grams) gathered data that produced the following scatterplot.
The table below shows data on total assets ($ million) for a sample of bank branches.
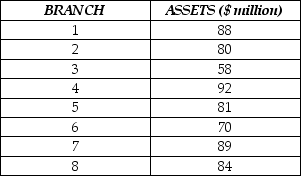 For the data on total assets ($ million) for the sample provided:
a. Calculate the mean.
b. Calculate the standard deviation.
c. Standardize the asset value of the third branch (find the z-score). Interpret its meaning.
A consumer research group investigating the relationship between the price of meat (per kilogram) and the fat content (grams) gathered data that produced the following scatterplot.
The table below shows data on total assets ($ million) for a sample of bank branches.
For the data on total assets ($ million) for the sample provided:a. Calculate the mean.
b. Calculate the standard deviation.
c. Standardize the asset value of the third branch (find the z-score). Interpret its meaning.
Question
Consider the following to answer the question(s) below:
A consumer research group investigating the relationship between the price of meat (per kilogram) and the fat content (grams) gathered data that produced the following scatterplot.
Below is a histogram of salaries (in $) for a sample of marketing managers. Comment on the shape of the distribution.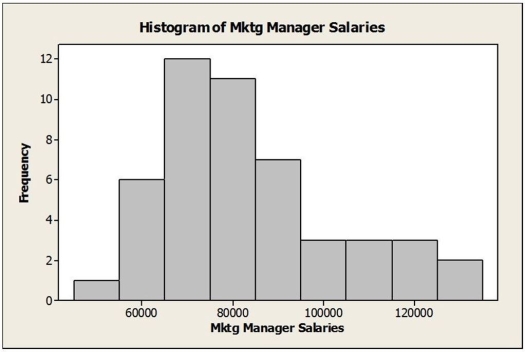
A consumer research group investigating the relationship between the price of meat (per kilogram) and the fat content (grams) gathered data that produced the following scatterplot.
Below is a histogram of salaries (in $) for a sample of marketing managers. Comment on the shape of the distribution.
Question
Consider the following to answer the question(s) below:
A consumer research group investigating the relationship between the price of meat (per kilogram) and the fat content (grams) gathered data that produced the following scatterplot.
Below is the five-number summary of the hourly wages ($) for sales managers.
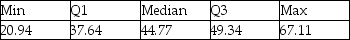 Suppose there had been an error and that the lowest hourly wage for sales managers was $18.50 instead of $20.94. Indicate how this change would affect the following summary statistics (increase, decrease, or stay about the same).
a. Mean
b. Median
c. Range
d. IQR
e. Standard deviation
A consumer research group investigating the relationship between the price of meat (per kilogram) and the fat content (grams) gathered data that produced the following scatterplot.
Below is the five-number summary of the hourly wages ($) for sales managers.
Suppose there had been an error and that the lowest hourly wage for sales managers was $18.50 instead of $20.94. Indicate how this change would affect the following summary statistics (increase, decrease, or stay about the same).a. Mean
b. Median
c. Range
d. IQR
e. Standard deviation
Question
Consider the following to answer the question(s) below:
A consumer research group investigating the relationship between the price of meat (per kilogram) and the fat content (grams) gathered data that produced the following scatterplot.
The table below shows closing share prices (on the first trading day of August, 2007) for a small sample of companies.
 a. Calculate the mean.
b. Calculate the standard deviation.
c. Standardize the share price for Matsushita Electronic Components (find the z-score). Interpret its meaning.
A consumer research group investigating the relationship between the price of meat (per kilogram) and the fat content (grams) gathered data that produced the following scatterplot.
The table below shows closing share prices (on the first trading day of August, 2007) for a small sample of companies.
a. Calculate the mean.b. Calculate the standard deviation.
c. Standardize the share price for Matsushita Electronic Components (find the z-score). Interpret its meaning.
Question
Consider the following to answer the question(s) below:
A consumer research group investigating the relationship between the price of meat (per kilogram) and the fat content (grams) gathered data that produced the following scatterplot.
The boxplots show monthly sales revenue figures ($ thousands) for a discount office supply company with locations in three different regions in Canada (Atlantic, Central and West). a. Which region has the highest median sales revenue?
b. Which region has the lowest median sales revenue?
c. Which region has the most variable sales revenue values? Explain.
A consumer research group investigating the relationship between the price of meat (per kilogram) and the fat content (grams) gathered data that produced the following scatterplot.
The boxplots show monthly sales revenue figures ($ thousands) for a discount office supply company with locations in three different regions in Canada (Atlantic, Central and West).
a. Which region has the highest median sales revenue?b. Which region has the lowest median sales revenue?
c. Which region has the most variable sales revenue values? Explain.
Question
Consider the following to answer the question(s) below:
A consumer research group investigating the relationship between the price of meat (per kilogram) and the fat content (grams) gathered data that produced the following scatterplot.
Below is a time series plot for monthly closing price of 3M Dental Products stock (beginning June 2005).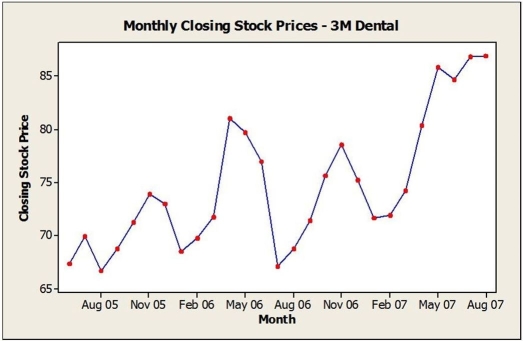 a. Are the closing prices for shares of 3M Dental Products from June 2005 through August 2007 stationary? Explain.
b. Would a histogram provide a good summary of these stock prices? Explain.
A consumer research group investigating the relationship between the price of meat (per kilogram) and the fat content (grams) gathered data that produced the following scatterplot.
Below is a time series plot for monthly closing price of 3M Dental Products stock (beginning June 2005).
a. Are the closing prices for shares of 3M Dental Products from June 2005 through August 2007 stationary? Explain.b. Would a histogram provide a good summary of these stock prices? Explain.
Question
Consider the following to answer the question(s) below:
A consumer research group investigating the relationship between the price of meat (per kilogram) and the fat content (grams) gathered data that produced the following scatterplot.
Data were collected on the hourly wage ($) for two types of marketing managers: (1) advertising / promotion managers and (2) sales managers. The results were used to create the histograms below.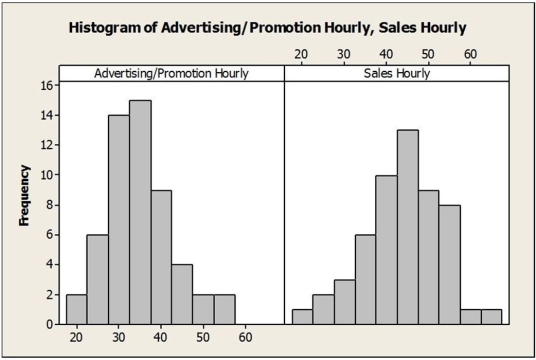 a. Describe the hourly wage distribution for advertising/promotion managers.
b. Describe the hourly wage distribution for sales managers.
c. Compare the hourly wages for the two types of marketing managers based on the histograms.
A consumer research group investigating the relationship between the price of meat (per kilogram) and the fat content (grams) gathered data that produced the following scatterplot.
Data were collected on the hourly wage ($) for two types of marketing managers: (1) advertising / promotion managers and (2) sales managers. The results were used to create the histograms below.
a. Describe the hourly wage distribution for advertising/promotion managers.b. Describe the hourly wage distribution for sales managers.
c. Compare the hourly wages for the two types of marketing managers based on the histograms.
Question
Consider the following to answer the question(s) below:
Below is a histogram and the five-number summary for salaries (in $) for a sample of marketing managers.
The IQR for these data is
A) $83,060.
B) $22,057.
C) $69,693.
D) $77,020.
E) $14,566.
Below is a histogram and the five-number summary for salaries (in $) for a sample of marketing managers.
The IQR for these data is
A) $83,060.
B) $22,057.
C) $69,693.
D) $77,020.
E) $14,566.
Question
Consider the following to answer the question(s) below:
The table below shows closing share prices for a small sample of companies.
The mean closing share price is
A) $31.23.
B) $44.65.
C) $56.99.
D) $62.19.
E) $75.77.
The table below shows closing share prices for a small sample of companies.
The mean closing share price is
A) $31.23.
B) $44.65.
C) $56.99.
D) $62.19.
E) $75.77.
Question
Consider the following to answer the question(s) below:
Below is a histogram and the five-number summary for salaries (in $) for a sample of marketing managers.
The shape of this distribution is
A) symmetric.
B) bimodal.
C) unimodal and right-skewed.
D) left-skewed.
E) multimodal.
Below is a histogram and the five-number summary for salaries (in $) for a sample of marketing managers.
The shape of this distribution is
A) symmetric.
B) bimodal.
C) unimodal and right-skewed.
D) left-skewed.
E) multimodal.
Question
Consider the following to answer the question(s) below:
The boxplots below show monthly sales revenue figures ($ thousands) for a discount office supply company with locations in three different regions of Canada (Atlantic, Central and West).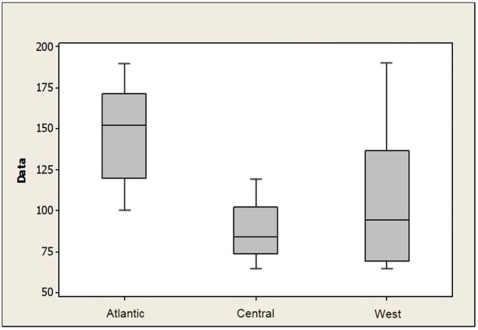
A student recently wrote an entrance exam and was informed that his score placed him at the 80th percentile. This indicates that
A) 80 students who also took the exam scored below him.
B) he scored as high or higher than 80 percent of all those who wrote the exam.
C) he was in the bottom 20 percent of those who wrote the exam.
D) his z-score was 80.
E) his exam mark was 80 out of 100.
Question
Consider the following to answer the question(s) below:
The boxplots below show monthly sales revenue figures ($ thousands) for a discount office supply company with locations in three different regions of Canada (Atlantic, Central and West).
A z-score of -2.7 indicates that a data value is
A) 2.7 standard deviations above the median.
B) 2.7 standard deviations above the mean.
C) 2.7 standard deviations above the mode.
D) 2.7 standard deviations below the median.
E) 2.7 standard deviations below the mean.
Question
Consider the following to answer the question(s) below:
The boxplots below show monthly sales revenue figures ($ thousands) for a discount office supply company with locations in three different regions of Canada (Atlantic, Central and West).
Given the boxplot below, which one of the following statements is correct?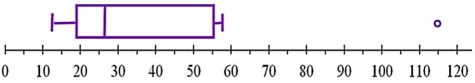
A) The distribution is symmetric.
B) The distribution is skewed to the left.
C) The distribution is skewed to the right.
D) The distribution has no extreme values.
E) The IQR is over 50.
Question
Consider the following to answer the question(s) below:
The boxplots below show monthly sales revenue figures ($ thousands) for a discount office supply company with locations in three different regions of Canada (Atlantic, Central and West).
Below is a time series plot for monthly closing stock prices of 3M Dental Products. Which of the following statements is true?
A) The data are stationary.
B) The data show an upward trend.
C) A histogram would provide the best representation of these data.
D) The data show a downward trend.
E) A boxplot would provide the best representation of this data.
Question
Consider the following to answer the question(s) below:
The boxplots below show monthly sales revenue figures ($ thousands) for a discount office supply company with locations in three different regions of Canada (Atlantic, Central and West).
Sample data were collected on the number of hours per day students spent at the computer or iPad. Which one of the following statements is true?
A) Females have the larger mean.
B) Males have the larger range.
C) The coefficient of variation is larger for males.
D) The coefficient of variation is larger for females.
E) The variance for males is larger.
The boxplots below show monthly sales revenue figures ($ thousands) for a discount office supply company with locations in three different regions of Canada (Atlantic, Central and West).
Sample data were collected on the number of hours per day students spent at the computer or iPad.
Which one of the following statements is true?A) Females have the larger mean.
B) Males have the larger range.
C) The coefficient of variation is larger for males.
D) The coefficient of variation is larger for females.
E) The variance for males is larger.
Question
Consider the following to answer the question(s) below:
The boxplots below show monthly sales revenue figures ($ thousands) for a discount office supply company with locations in three different regions of Canada (Atlantic, Central and West).
A sample of families with children at a local school is found to have a mean of 3.2 members per family. The mode number of family members is 2 and the median number is 2.0. Based on this information, which statement is true?
A) The skewness of the distribution is unknown.
B) The distribution is symmetric.
C) The distribution is right-skewed.
D) The distribution is left-skewed.
E) The distribution is symmetric and bell-shaped.
Question
Consider the following to answer the question(s) below:
The boxplots below show monthly sales revenue figures ($ thousands) for a discount office supply company with locations in three different regions of Canada (Atlantic, Central and West).
The asking price for homes in the Winnipeg real estate market has a mean value of $286,455 and a standard deviation of $11,200. The mean and standard deviation in asking price for homes in Moncton are $188,468 and $8,230, respectively. Recently, one home sold in each city where the asking price for each home was $225,000. Based on these data, which of the following statements is true?
A) The variance for Winnipeg real estate market is lower than that for Moncton.
B) The Moncton home has a negative standardized value.
C) The coefficients of variation are very close to each other (both are about 0.04).
D) The Winnipeg home has a positive standardized value.
E) Both homes have the same z-score.
Question
Consider the following to answer the question(s) below:
The table below shows closing share prices for a small sample of companies.
The z-score for the share price of Matsushita Electronic Components is
A) 1.24.
B) 2.34.
C) -2.34.
D) -3.00.
E) -1.24.
The table below shows closing share prices for a small sample of companies.
The z-score for the share price of Matsushita Electronic Components is
A) 1.24.
B) 2.34.
C) -2.34.
D) -3.00.
E) -1.24.
Question
Consider the following to answer the question(s) below:
The boxplots below show monthly sales revenue figures ($ thousands) for a discount office supply company with locations in three different regions of Canada (Atlantic, Central and West).
Which of the following best describes the difference between stem-and-leaf displays and histograms?
A) There is no difference.
B) Histograms show the shape and spread but not the centre.
C) Histograms show the shape, centre, and spread of the distribution while the stem-and-leaf displays do not.
D) Histograms show the data values themselves while stem-and-leaf displays do not.
E) Histograms provide an easy-to-understand summary of distribution. The stem-and-leaf displays show the individual values while the histogram does not.
Question
Consider the following to answer the question(s) below:
The boxplots below show monthly sales revenue figures ($ thousands) for a discount office supply company with locations in three different regions of Canada (Atlantic, Central and West).
Which of the following statements is false?
A) The length of the box in a boxplot is equal to IQR.
B) The median and quartiles divide data into four equal parts.
C) The median and quartiles divide data into three equal parts.
D) The upper quartile (Q3) is the value with a quarter of the data above it.
E) The lower quartile (Q1) is the value with a quarter of the data below it.
Question
Consider the following to answer the question(s) below:
The boxplots below show monthly sales revenue figures ($ thousands) for a discount office supply company with locations in three different regions of Canada (Atlantic, Central and West).
Which of the following statements is true?
A) The Atlantic region has the lowest sales revenues.
B) The Central region has the lowest median sales revenue.
C) The West region has the lowest mean sales revenue.
D) The West region has the lowest median sales revenue.
E) The Atlantic region has the lowest mean sales.
Question
Consider the following to answer the question(s) below:
The boxplots below show monthly sales revenue figures ($ thousands) for a discount office supply company with locations in three different regions of Canada (Atlantic, Central and West).
Which of the following statements is false?
A) The West region has the most variable sales revenues.
B) The West region has the largest IQR.
C) The Central region has the smallest IQR.
D) The Atlantic region has the most variable sales revenues.
E) The Central region has the least variable sales revenues.

Unlock Deck
Sign up to unlock the cards in this deck!
Unlock Deck
Unlock Deck
1/32
Play
Full screen (f)
Deck 5: Displaying and Describing Quantitative Data
1
Consider the following to answer the question(s) below:
A consumer research group investigating the relationship between the price of meat (per kilogram) and the fat content (grams) gathered data that produced the following scatterplot.
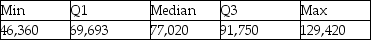
Below is the five-number summary of salaries (in $) for a sample of marketing managers.
a. Would you expect the mean salary for this sample of marketing managers to be higher or lower than the median? Explain.
b. Which would be a more appropriate measure of central tendency for these data, the mean or median? Explain.
c. Calculate the range.
d. Calculate the IQR.
A consumer research group investigating the relationship between the price of meat (per kilogram) and the fat content (grams) gathered data that produced the following scatterplot.
Below is the five-number summary of salaries (in $) for a sample of marketing managers.
a. Would you expect the mean salary for this sample of marketing managers to be higher or lower than the median? Explain.b. Which would be a more appropriate measure of central tendency for these data, the mean or median? Explain.
c. Calculate the range.
d. Calculate the IQR.
a. We would expect the mean salary to be higher than the median because the distribution is skewed to the right.
b. The median is preferred over the mean when the distribution is skewed.
c. $83,060
d. $22,057
b. The median is preferred over the mean when the distribution is skewed.
c. $83,060
d. $22,057
2
Consider the following to answer the question(s) below:
A consumer research group investigating the relationship between the price of meat (per kilogram) and the fat content (grams) gathered data that produced the following scatterplot.
The boxplots below show the closing share prices for a sample of companies on the first trading days in August 2015 and in August 2010. a. For which day was the median closing share price higher?
b. For which day were the closing share prices more variable? Explain.
c. Which distribution is more symmetric? Explain.
A consumer research group investigating the relationship between the price of meat (per kilogram) and the fat content (grams) gathered data that produced the following scatterplot.
The boxplots below show the closing share prices for a sample of companies on the first trading days in August 2015 and in August 2010.
a. For which day was the median closing share price higher?b. For which day were the closing share prices more variable? Explain.
c. Which distribution is more symmetric? Explain.
a. August 2015
b. August 2015, as the range and IQR are higher.
c. August 2015, as the median line is near the middle of the box.
b. August 2015, as the range and IQR are higher.
c. August 2015, as the median line is near the middle of the box.
3
Consider the following to answer the question(s) below:
Below is a histogram and the five-number summary for salaries (in $) for a sample of marketing managers.
Suppose the marketing manager who was earning $129,420 got a raise and is now earning $140,000. Which one of the following statements is true?
A) The mean would increase.
B) The median would increase.
C) The range would stay the same.
D) The IQR would increase.
E) The IQR would decrease.
The mean would increase.
4
Consider the following to answer the question(s) below:
Below is a histogram and the five-number summary for salaries (in $) for a sample of marketing managers.
The most appropriate measure of central tendency for these data is the
A) median.
B) mean.
C) mode.
D) range.
E) standard deviation.
Below is a histogram and the five-number summary for salaries (in $) for a sample of marketing managers.
The most appropriate measure of central tendency for these data is the
A) median.
B) mean.
C) mode.
D) range.
E) standard deviation.
Unlock Deck
Unlock for access to all 32 flashcards in this deck.
Unlock Deck
k this deck
5
Consider the following to answer the question(s) below:
A consumer research group investigating the relationship between the price of meat (per kilogram) and the fat content (grams) gathered data that produced the following scatterplot.
Below is the five-number summary of the hourly wages ($) for advertising / promotion managers.
a. Would you expect the mean salary for this sample of marketing managers to be higher or lower than the median? Explain.
b. Which would be a more appropriate measure of central tendency for these data, the mean or median? Explain.
c. Calculate the range.
d. Calculate the IQR.
A consumer research group investigating the relationship between the price of meat (per kilogram) and the fat content (grams) gathered data that produced the following scatterplot.
Below is the five-number summary of the hourly wages ($) for advertising / promotion managers.
a. Would you expect the mean salary for this sample of marketing managers to be higher or lower than the median? Explain.b. Which would be a more appropriate measure of central tendency for these data, the mean or median? Explain.
c. Calculate the range.
d. Calculate the IQR.
Unlock Deck
Unlock for access to all 32 flashcards in this deck.
Unlock Deck
k this deck
6
Consider the following to answer the question(s) below:
Below is a histogram and the five-number summary for salaries (in $) for a sample of marketing managers.
Do the data contain any outliers as determined by the five-number summary?
A) only at the upper end
B) only at the lower end
C) at the upper and the lower ends
D) There are no outliers.
E) There are two outliers.
Unlock Deck
Unlock for access to all 32 flashcards in this deck.
Unlock Deck
k this deck
7
Consider the following to answer the question(s) below:
A consumer research group investigating the relationship between the price of meat (per kilogram) and the fat content (grams) gathered data that produced the following scatterplot.
The table below shows data on total assets ($ million) for a sample of bank branches. Prepare a stem-and-leaf display. Comment on the shape of the distribution.
Unlock Deck
Unlock for access to all 32 flashcards in this deck.
Unlock Deck
k this deck
8
Consider the following to answer the question(s) below:
Below is a histogram and the five-number summary for salaries (in $) for a sample of marketing managers.
The upper and lower "fences" for a boxplot of these data are
A) $47,636 and $113,807.
B) $43,934.5 and $110,105.5.
C) $54,963 and $99,077.
D) $36,607.5 and $124,835.5.
E) $58,664.5 and $102,778.5.
Unlock Deck
Unlock for access to all 32 flashcards in this deck.
Unlock Deck
k this deck
9
Consider the following to answer the question(s) below:
A consumer research group investigating the relationship between the price of meat (per kilogram) and the fat content (grams) gathered data that produced the following scatterplot.
Below is the five-number summary of salaries (in $) for a sample of marketing managers.
Suppose the marketing manager who was earning $129,420 got a raise and is now earning $140,000. Indicate how this change would affect the following summary statistics (increase, decrease, or stay about the same).
a. Mean
b. Median
c. Range
d. IQR
e. Standard deviation
A consumer research group investigating the relationship between the price of meat (per kilogram) and the fat content (grams) gathered data that produced the following scatterplot.
Below is the five-number summary of salaries (in $) for a sample of marketing managers.
Suppose the marketing manager who was earning $129,420 got a raise and is now earning $140,000. Indicate how this change would affect the following summary statistics (increase, decrease, or stay about the same).a. Mean
b. Median
c. Range
d. IQR
e. Standard deviation
Unlock Deck
Unlock for access to all 32 flashcards in this deck.
Unlock Deck
k this deck
10
Consider the following to answer the question(s) below:
The table below shows closing share prices for a small sample of companies.
The standard deviation of the closing share prices is
A) $31.43.
B) $44.65.
C) $56.99.
D) $62.19.
E) $75.77.
The table below shows closing share prices for a small sample of companies.
The standard deviation of the closing share prices is
A) $31.43.
B) $44.65.
C) $56.99.
D) $62.19.
E) $75.77.
Unlock Deck
Unlock for access to all 32 flashcards in this deck.
Unlock Deck
k this deck
11
Consider the following to answer the question(s) below:
A consumer research group investigating the relationship between the price of meat (per kilogram) and the fat content (grams) gathered data that produced the following scatterplot.
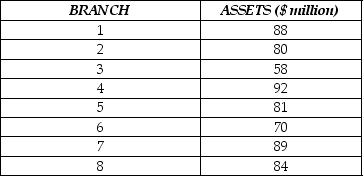
The table below shows data on total assets ($ million) for a sample of bank branches.
For the data on total assets ($ million) for the sample provided:
a. Calculate the mean.
b. Calculate the standard deviation.
c. Standardize the asset value of the third branch (find the z-score). Interpret its meaning.
A consumer research group investigating the relationship between the price of meat (per kilogram) and the fat content (grams) gathered data that produced the following scatterplot.
The table below shows data on total assets ($ million) for a sample of bank branches.
For the data on total assets ($ million) for the sample provided:a. Calculate the mean.
b. Calculate the standard deviation.
c. Standardize the asset value of the third branch (find the z-score). Interpret its meaning.
Unlock Deck
Unlock for access to all 32 flashcards in this deck.
Unlock Deck
k this deck
12
Consider the following to answer the question(s) below:
A consumer research group investigating the relationship between the price of meat (per kilogram) and the fat content (grams) gathered data that produced the following scatterplot.
Below is a histogram of salaries (in $) for a sample of marketing managers. Comment on the shape of the distribution.
A consumer research group investigating the relationship between the price of meat (per kilogram) and the fat content (grams) gathered data that produced the following scatterplot.
Below is a histogram of salaries (in $) for a sample of marketing managers. Comment on the shape of the distribution.
Unlock Deck
Unlock for access to all 32 flashcards in this deck.
Unlock Deck
k this deck
13
Consider the following to answer the question(s) below:
A consumer research group investigating the relationship between the price of meat (per kilogram) and the fat content (grams) gathered data that produced the following scatterplot.
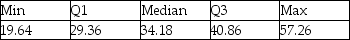
Below is the five-number summary of the hourly wages ($) for sales managers.
Suppose there had been an error and that the lowest hourly wage for sales managers was $18.50 instead of $20.94. Indicate how this change would affect the following summary statistics (increase, decrease, or stay about the same).
a. Mean
b. Median
c. Range
d. IQR
e. Standard deviation
A consumer research group investigating the relationship between the price of meat (per kilogram) and the fat content (grams) gathered data that produced the following scatterplot.
Below is the five-number summary of the hourly wages ($) for sales managers.
Suppose there had been an error and that the lowest hourly wage for sales managers was $18.50 instead of $20.94. Indicate how this change would affect the following summary statistics (increase, decrease, or stay about the same).a. Mean
b. Median
c. Range
d. IQR
e. Standard deviation
Unlock Deck
Unlock for access to all 32 flashcards in this deck.
Unlock Deck
k this deck
14
Consider the following to answer the question(s) below:
A consumer research group investigating the relationship between the price of meat (per kilogram) and the fat content (grams) gathered data that produced the following scatterplot.
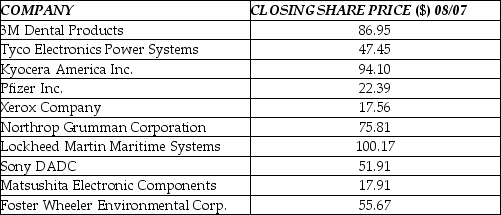
The table below shows closing share prices (on the first trading day of August, 2007) for a small sample of companies.
a. Calculate the mean.
b. Calculate the standard deviation.
c. Standardize the share price for Matsushita Electronic Components (find the z-score). Interpret its meaning.
A consumer research group investigating the relationship between the price of meat (per kilogram) and the fat content (grams) gathered data that produced the following scatterplot.
The table below shows closing share prices (on the first trading day of August, 2007) for a small sample of companies.
a. Calculate the mean.b. Calculate the standard deviation.
c. Standardize the share price for Matsushita Electronic Components (find the z-score). Interpret its meaning.
Unlock Deck
Unlock for access to all 32 flashcards in this deck.
Unlock Deck
k this deck
15
Consider the following to answer the question(s) below:
A consumer research group investigating the relationship between the price of meat (per kilogram) and the fat content (grams) gathered data that produced the following scatterplot.
The boxplots show monthly sales revenue figures ($ thousands) for a discount office supply company with locations in three different regions in Canada (Atlantic, Central and West). a. Which region has the highest median sales revenue?
b. Which region has the lowest median sales revenue?
c. Which region has the most variable sales revenue values? Explain.
A consumer research group investigating the relationship between the price of meat (per kilogram) and the fat content (grams) gathered data that produced the following scatterplot.
The boxplots show monthly sales revenue figures ($ thousands) for a discount office supply company with locations in three different regions in Canada (Atlantic, Central and West).
a. Which region has the highest median sales revenue?b. Which region has the lowest median sales revenue?
c. Which region has the most variable sales revenue values? Explain.
Unlock Deck
Unlock for access to all 32 flashcards in this deck.
Unlock Deck
k this deck
16
Consider the following to answer the question(s) below:
A consumer research group investigating the relationship between the price of meat (per kilogram) and the fat content (grams) gathered data that produced the following scatterplot.
Below is a time series plot for monthly closing price of 3M Dental Products stock (beginning June 2005). a. Are the closing prices for shares of 3M Dental Products from June 2005 through August 2007 stationary? Explain.
b. Would a histogram provide a good summary of these stock prices? Explain.
A consumer research group investigating the relationship between the price of meat (per kilogram) and the fat content (grams) gathered data that produced the following scatterplot.
Below is a time series plot for monthly closing price of 3M Dental Products stock (beginning June 2005).
a. Are the closing prices for shares of 3M Dental Products from June 2005 through August 2007 stationary? Explain.b. Would a histogram provide a good summary of these stock prices? Explain.
Unlock Deck
Unlock for access to all 32 flashcards in this deck.
Unlock Deck
k this deck
17
Consider the following to answer the question(s) below:
A consumer research group investigating the relationship between the price of meat (per kilogram) and the fat content (grams) gathered data that produced the following scatterplot.
Data were collected on the hourly wage ($) for two types of marketing managers: (1) advertising / promotion managers and (2) sales managers. The results were used to create the histograms below. a. Describe the hourly wage distribution for advertising/promotion managers.
b. Describe the hourly wage distribution for sales managers.
c. Compare the hourly wages for the two types of marketing managers based on the histograms.
A consumer research group investigating the relationship between the price of meat (per kilogram) and the fat content (grams) gathered data that produced the following scatterplot.
Data were collected on the hourly wage ($) for two types of marketing managers: (1) advertising / promotion managers and (2) sales managers. The results were used to create the histograms below.
a. Describe the hourly wage distribution for advertising/promotion managers.b. Describe the hourly wage distribution for sales managers.
c. Compare the hourly wages for the two types of marketing managers based on the histograms.
Unlock Deck
Unlock for access to all 32 flashcards in this deck.
Unlock Deck
k this deck
18
Consider the following to answer the question(s) below:
Below is a histogram and the five-number summary for salaries (in $) for a sample of marketing managers.
The IQR for these data is
A) $83,060.
B) $22,057.
C) $69,693.
D) $77,020.
E) $14,566.
Below is a histogram and the five-number summary for salaries (in $) for a sample of marketing managers.
The IQR for these data is
A) $83,060.
B) $22,057.
C) $69,693.
D) $77,020.
E) $14,566.
Unlock Deck
Unlock for access to all 32 flashcards in this deck.
Unlock Deck
k this deck
19
Consider the following to answer the question(s) below:
The table below shows closing share prices for a small sample of companies.
The mean closing share price is
A) $31.23.
B) $44.65.
C) $56.99.
D) $62.19.
E) $75.77.
The table below shows closing share prices for a small sample of companies.
The mean closing share price is
A) $31.23.
B) $44.65.
C) $56.99.
D) $62.19.
E) $75.77.
Unlock Deck
Unlock for access to all 32 flashcards in this deck.
Unlock Deck
k this deck
20
Consider the following to answer the question(s) below:
Below is a histogram and the five-number summary for salaries (in $) for a sample of marketing managers.
The shape of this distribution is
A) symmetric.
B) bimodal.
C) unimodal and right-skewed.
D) left-skewed.
E) multimodal.
Below is a histogram and the five-number summary for salaries (in $) for a sample of marketing managers.
The shape of this distribution is
A) symmetric.
B) bimodal.
C) unimodal and right-skewed.
D) left-skewed.
E) multimodal.
Unlock Deck
Unlock for access to all 32 flashcards in this deck.
Unlock Deck
k this deck
21
Consider the following to answer the question(s) below:
The boxplots below show monthly sales revenue figures ($ thousands) for a discount office supply company with locations in three different regions of Canada (Atlantic, Central and West).
A student recently wrote an entrance exam and was informed that his score placed him at the 80th percentile. This indicates that
A) 80 students who also took the exam scored below him.
B) he scored as high or higher than 80 percent of all those who wrote the exam.
C) he was in the bottom 20 percent of those who wrote the exam.
D) his z-score was 80.
E) his exam mark was 80 out of 100.
Unlock Deck
Unlock for access to all 32 flashcards in this deck.
Unlock Deck
k this deck
22
Consider the following to answer the question(s) below:
The boxplots below show monthly sales revenue figures ($ thousands) for a discount office supply company with locations in three different regions of Canada (Atlantic, Central and West).
A z-score of -2.7 indicates that a data value is
A) 2.7 standard deviations above the median.
B) 2.7 standard deviations above the mean.
C) 2.7 standard deviations above the mode.
D) 2.7 standard deviations below the median.
E) 2.7 standard deviations below the mean.
Unlock Deck
Unlock for access to all 32 flashcards in this deck.
Unlock Deck
k this deck
23
Consider the following to answer the question(s) below:
The boxplots below show monthly sales revenue figures ($ thousands) for a discount office supply company with locations in three different regions of Canada (Atlantic, Central and West).
Given the boxplot below, which one of the following statements is correct?
A) The distribution is symmetric.
B) The distribution is skewed to the left.
C) The distribution is skewed to the right.
D) The distribution has no extreme values.
E) The IQR is over 50.
Unlock Deck
Unlock for access to all 32 flashcards in this deck.
Unlock Deck
k this deck
24
Consider the following to answer the question(s) below:
The boxplots below show monthly sales revenue figures ($ thousands) for a discount office supply company with locations in three different regions of Canada (Atlantic, Central and West).
Below is a time series plot for monthly closing stock prices of 3M Dental Products. Which of the following statements is true?
A) The data are stationary.
B) The data show an upward trend.
C) A histogram would provide the best representation of these data.
D) The data show a downward trend.
E) A boxplot would provide the best representation of this data.
Unlock Deck
Unlock for access to all 32 flashcards in this deck.
Unlock Deck
k this deck
25
Consider the following to answer the question(s) below:
The boxplots below show monthly sales revenue figures ($ thousands) for a discount office supply company with locations in three different regions of Canada (Atlantic, Central and West).
Sample data were collected on the number of hours per day students spent at the computer or iPad. Which one of the following statements is true?
A) Females have the larger mean.
B) Males have the larger range.
C) The coefficient of variation is larger for males.
D) The coefficient of variation is larger for females.
E) The variance for males is larger.
The boxplots below show monthly sales revenue figures ($ thousands) for a discount office supply company with locations in three different regions of Canada (Atlantic, Central and West).
Sample data were collected on the number of hours per day students spent at the computer or iPad.
Which one of the following statements is true?A) Females have the larger mean.
B) Males have the larger range.
C) The coefficient of variation is larger for males.
D) The coefficient of variation is larger for females.
E) The variance for males is larger.
Unlock Deck
Unlock for access to all 32 flashcards in this deck.
Unlock Deck
k this deck
26
Consider the following to answer the question(s) below:
The boxplots below show monthly sales revenue figures ($ thousands) for a discount office supply company with locations in three different regions of Canada (Atlantic, Central and West).
A sample of families with children at a local school is found to have a mean of 3.2 members per family. The mode number of family members is 2 and the median number is 2.0. Based on this information, which statement is true?
A) The skewness of the distribution is unknown.
B) The distribution is symmetric.
C) The distribution is right-skewed.
D) The distribution is left-skewed.
E) The distribution is symmetric and bell-shaped.
Unlock Deck
Unlock for access to all 32 flashcards in this deck.
Unlock Deck
k this deck
27
Consider the following to answer the question(s) below:
The boxplots below show monthly sales revenue figures ($ thousands) for a discount office supply company with locations in three different regions of Canada (Atlantic, Central and West).
The asking price for homes in the Winnipeg real estate market has a mean value of $286,455 and a standard deviation of $11,200. The mean and standard deviation in asking price for homes in Moncton are $188,468 and $8,230, respectively. Recently, one home sold in each city where the asking price for each home was $225,000. Based on these data, which of the following statements is true?
A) The variance for Winnipeg real estate market is lower than that for Moncton.
B) The Moncton home has a negative standardized value.
C) The coefficients of variation are very close to each other (both are about 0.04).
D) The Winnipeg home has a positive standardized value.
E) Both homes have the same z-score.
Unlock Deck
Unlock for access to all 32 flashcards in this deck.
Unlock Deck
k this deck
28
Consider the following to answer the question(s) below:
The table below shows closing share prices for a small sample of companies.
The z-score for the share price of Matsushita Electronic Components is
A) 1.24.
B) 2.34.
C) -2.34.
D) -3.00.
E) -1.24.
The table below shows closing share prices for a small sample of companies.
The z-score for the share price of Matsushita Electronic Components is
A) 1.24.
B) 2.34.
C) -2.34.
D) -3.00.
E) -1.24.
Unlock Deck
Unlock for access to all 32 flashcards in this deck.
Unlock Deck
k this deck
29
Consider the following to answer the question(s) below:
The boxplots below show monthly sales revenue figures ($ thousands) for a discount office supply company with locations in three different regions of Canada (Atlantic, Central and West).
Which of the following best describes the difference between stem-and-leaf displays and histograms?
A) There is no difference.
B) Histograms show the shape and spread but not the centre.
C) Histograms show the shape, centre, and spread of the distribution while the stem-and-leaf displays do not.
D) Histograms show the data values themselves while stem-and-leaf displays do not.
E) Histograms provide an easy-to-understand summary of distribution. The stem-and-leaf displays show the individual values while the histogram does not.
Unlock Deck
Unlock for access to all 32 flashcards in this deck.
Unlock Deck
k this deck
30
Consider the following to answer the question(s) below:
The boxplots below show monthly sales revenue figures ($ thousands) for a discount office supply company with locations in three different regions of Canada (Atlantic, Central and West).
Which of the following statements is false?
A) The length of the box in a boxplot is equal to IQR.
B) The median and quartiles divide data into four equal parts.
C) The median and quartiles divide data into three equal parts.
D) The upper quartile (Q3) is the value with a quarter of the data above it.
E) The lower quartile (Q1) is the value with a quarter of the data below it.
Unlock Deck
Unlock for access to all 32 flashcards in this deck.
Unlock Deck
k this deck
31
Consider the following to answer the question(s) below:
The boxplots below show monthly sales revenue figures ($ thousands) for a discount office supply company with locations in three different regions of Canada (Atlantic, Central and West).
Which of the following statements is true?
A) The Atlantic region has the lowest sales revenues.
B) The Central region has the lowest median sales revenue.
C) The West region has the lowest mean sales revenue.
D) The West region has the lowest median sales revenue.
E) The Atlantic region has the lowest mean sales.
Unlock Deck
Unlock for access to all 32 flashcards in this deck.
Unlock Deck
k this deck
32
Consider the following to answer the question(s) below:
The boxplots below show monthly sales revenue figures ($ thousands) for a discount office supply company with locations in three different regions of Canada (Atlantic, Central and West).
Which of the following statements is false?
A) The West region has the most variable sales revenues.
B) The West region has the largest IQR.
C) The Central region has the smallest IQR.
D) The Atlantic region has the most variable sales revenues.
E) The Central region has the least variable sales revenues.
Unlock Deck
Unlock for access to all 32 flashcards in this deck.
Unlock Deck
k this deck
Unlock Deck
Unlock for access to all 32 flashcards in this deck.


