Deck 11: Other Chi-Square Tests
Full screen (f)
Question
Question
Question
A random group of apartments was selected from a city to analyze the number of bedrooms they have. Is there evidence to reject the hypothesis that the apartments are equally distributed between 1-bedroom, 2-bedroom, and 3-bedroom apartments, at  = 0.05?
A) There is not evidence to reject the claim that the apartments are equally distributed between the three sizes because the test value 0.412 < 5.991
B) There is evidence to reject the claim that the apartments are equally distributed between the three sizes because the test value 5.991 > 0.412
C) There is not evidence to reject the claim that the apartments are equally distributed between the three sizes because the test value 0.412 < 7.815
D) There is evidence to reject the claim that the apartments are equally distributed between the three sizes because the test value 7.815 > 0.412
= 0.05? A) There is not evidence to reject the claim that the apartments are equally distributed between the three sizes because the test value 0.412 < 5.991
B) There is evidence to reject the claim that the apartments are equally distributed between the three sizes because the test value 5.991 > 0.412
C) There is not evidence to reject the claim that the apartments are equally distributed between the three sizes because the test value 0.412 < 7.815
D) There is evidence to reject the claim that the apartments are equally distributed between the three sizes because the test value 7.815 > 0.412
Question
A random group of oranges were selected from an orchard to analyze their ripeness. Based on the time of year, the orchard owner believes that 20% of the oranges are ready for picking now, 40% will be ready in three days, 30% will be ready in one week, and 10% will be ready in two weeks. Is there evidence to reject this hypothesis at  = 0.05?
A) There is evidence to reject the claim that the oranges are distributed as claimed because the test value 21.553 > 9.488
B) There is not evidence to reject the claim that the oranges are distributed as claimed because the test value 5.991 < 21.553
C) There is evidence to reject the claim that the oranges are distributed as claimed because the test value 21.553 > 7.815
D) There is not evidence to reject the claim that the oranges are distributed as claimed because the test value 9.488 < 21.553
= 0.05? A) There is evidence to reject the claim that the oranges are distributed as claimed because the test value 21.553 > 9.488
B) There is not evidence to reject the claim that the oranges are distributed as claimed because the test value 5.991 < 21.553
C) There is evidence to reject the claim that the oranges are distributed as claimed because the test value 21.553 > 7.815
D) There is not evidence to reject the claim that the oranges are distributed as claimed because the test value 9.488 < 21.553
Question
A random group of students was selected from a large student conference to analyze their class in school. Is there evidence to reject the hypothesis that the number of students is equally distributed between the four classes, at  = 0.05?
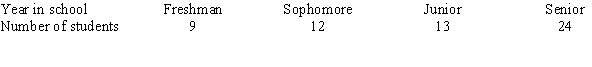
A) There is not evidence to reject the claim that students are equally distributed between the four classes because the test value 7.815 < 8.897
B) There is evidence to reject the claim that the customers' preferences are distributed between the four classes because the test value 8.897 > 9.488
C) There is not evidence to reject the claim that students are equally distributed between the four classes because the test value 9.488 < 8.897
D) There is evidence to reject the claim that students are equally distributed between the four classes because the test value 8.897 > 7.815
= 0.05? A) There is not evidence to reject the claim that students are equally distributed between the four classes because the test value 7.815 < 8.897
B) There is evidence to reject the claim that the customers' preferences are distributed between the four classes because the test value 8.897 > 9.488
C) There is not evidence to reject the claim that students are equally distributed between the four classes because the test value 9.488 < 8.897
D) There is evidence to reject the claim that students are equally distributed between the four classes because the test value 8.897 > 7.815
Question
The null hypothesis should not be rejected for the data given in the figure below. 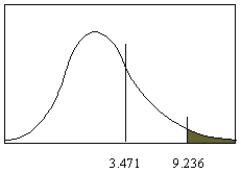
Question
A random group of customers at a fast food chain were asked whether they preferred hamburgers, chicken sandwiches, or fish sandwiches. The restaurant's marketing department claims that 45% of customers prefer hamburgers, 37% of the customers prefer chicken sandwiches, and 18% of the customers prefer fish sandwiches. Is there evidence to reject this hypothesis at  = 0.05?
A) There is evidence to reject the claim that the customers' preferences are distributed as claimed because the test value 7.815 > 2.843
B) There is not evidence to reject the claim that the customers' preferences are distributed as claimed because the test value 2.843 < 5.991
C) There is evidence to reject the claim that the customers' preferences are distributed as claimed because the test value 5.991 > 2.843
D) There is not evidence to reject the claim that the customers' preferences are distributed as claimed because the test value 2.843 < 7.815
= 0.05? A) There is evidence to reject the claim that the customers' preferences are distributed as claimed because the test value 7.815 > 2.843
B) There is not evidence to reject the claim that the customers' preferences are distributed as claimed because the test value 2.843 < 5.991
C) There is evidence to reject the claim that the customers' preferences are distributed as claimed because the test value 5.991 > 2.843
D) There is not evidence to reject the claim that the customers' preferences are distributed as claimed because the test value 2.843 < 7.815
Question
Question
The critical chi-square value for 15 degrees of freedom when  and the test is right-tailed is 19.675.
and the test is right-tailed is 19.675. Question
A shoe salesman wants to see if his female customers have a preference in the color of shoe purchased. Compute the test value for the following data. 
A) 28.31
B) 16.77
C) 26.80
D) 21.50
A) 28.31
B) 16.77
C) 26.80
D) 21.50
Question
Question
Question
For four degrees of freedom, the value of  shown in the
  distribution below is 0.05.
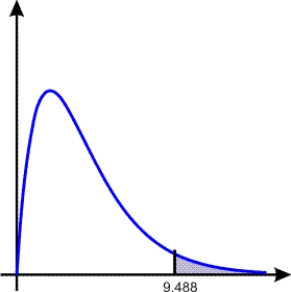
shown in the distribution below is 0.05. Question
Question
A chewing gum manufacturer wishes to determine if his customers prefer one flavor gum to any other flavor. He selects a random sample of customers and records the flavor of gum that is purchased. Compute the test value for the data given. 
A) 6.18
B) 29.5
C) 11.56
D) 18.0
A) 6.18
B) 29.5
C) 11.56
D) 18.0
Question
Question
An anatomy teacher hypothesizes that the final grades in her class are distributed as 10% A's, 23% B's, 45% C's, 14% D's, and 8% F's. At the end of the semester, she has the following grades.  Find the critical value. Use
  .
.
A) 9.236
B) 7.779
C) 11.070
D) 9.488
Find the critical value. Use .A) 9.236
B) 7.779
C) 11.070
D) 9.488
Question
Question
A random group of desktop computer sales was selected from an electronic discount chain to analyze the size of monitor purchased with the computer. Is there evidence to reject the hypothesis that the number of monitors is equally distributed between the five types, at  = 0.05?
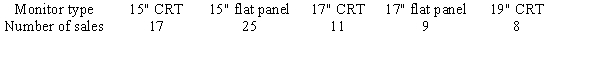
A) There is evidence to reject the claim that the monitors are equally distributed between the five classes because the test value 14.286 > 11.070
B) There is not evidence to reject the claim that the monitors are equally distributed between the five classes because the test value 9.488 < 14.286
C) There is evidence to reject the claim that the monitors are equally distributed between the five classes because the test value 14.286 > 9.488
D) There is not evidence to reject the claim that the monitors are equally distributed between the five classes because the test value 11.070 < 14.286
= 0.05? A) There is evidence to reject the claim that the monitors are equally distributed between the five classes because the test value 14.286 > 11.070
B) There is not evidence to reject the claim that the monitors are equally distributed between the five classes because the test value 9.488 < 14.286
C) There is evidence to reject the claim that the monitors are equally distributed between the five classes because the test value 14.286 > 9.488
D) There is not evidence to reject the claim that the monitors are equally distributed between the five classes because the test value 11.070 < 14.286
Question
A random group of seniors was selected from a university and asked about their plans for the following year. The school advising office claims that 60% of the students plan to work, 30% of the students plan to continue in school, and 10% of the students plan to take some time off. Is there evidence to reject this hypothesis at  = 0.05?
A) There is evidence to reject the claim that the students' plans are distributed as claimed because the test value 6.778 > 5.991
B) There is not evidence to reject the claim that the students' plans are distributed as claimed because the test value 6.778 > 7.815
C) There is evidence to reject the claim that the students' plans are distributed as claimed because the test value 6.778 > 7.815
D) There is not evidence to reject the claim that the students' plans are distributed as claimed because the test value 6.778 > 5.991
= 0.05? A) There is evidence to reject the claim that the students' plans are distributed as claimed because the test value 6.778 > 5.991
B) There is not evidence to reject the claim that the students' plans are distributed as claimed because the test value 6.778 > 7.815
C) There is evidence to reject the claim that the students' plans are distributed as claimed because the test value 6.778 > 7.815
D) There is not evidence to reject the claim that the students' plans are distributed as claimed because the test value 6.778 > 5.991
Question
Two allergists recorded the main area of allergy for new patients during a month. At  , test the claim that the allergy diagnosis and the doctor that treated the patients are independent.
A) There is not evidence to reject the claim that the allergy diagnosis and the doctor are not related because the test value 1.839 > 15.507
B) There is not evidence to reject the claim that the allergy diagnosis and the doctor are not related because the test value 3.698 < 7.815
C) There is evidence to reject the claim that the allergy diagnosis and the doctor are not related because the test value 7.815 > 3.698
D) There is evidence to reject the claim that the allergy diagnosis and the doctor are not related because the test value 15.507 > 1.839
, test the claim that the allergy diagnosis and the doctor that treated the patients are independent. A) There is not evidence to reject the claim that the allergy diagnosis and the doctor are not related because the test value 1.839 > 15.507
B) There is not evidence to reject the claim that the allergy diagnosis and the doctor are not related because the test value 3.698 < 7.815
C) There is evidence to reject the claim that the allergy diagnosis and the doctor are not related because the test value 7.815 > 3.698
D) There is evidence to reject the claim that the allergy diagnosis and the doctor are not related because the test value 15.507 > 1.839
Question
Question
Two computer stores recorded the number of computers sold in a week along with the sizes of their hard drives. At  , test the claim that the distribution of hard drives and the store where the computers were bought are not related.
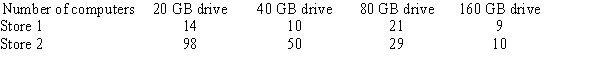
A) There is evidence to reject the claim that the size of hard drive sold and the store number are not related because the test value 25.309 > 7.815
B) There is evidence to reject the claim that the size of hard drive sold and the store number are not related because the test value 2.027 > 7.815
C) There is not evidence to reject the claim that the size of hard drive sold and the store number are not related because the test value 7.815 < 2.027
D) There is not evidence to reject the claim that the size of hard drive sold and the store number are not related because the test value 15.507 < 2.027
, test the claim that the distribution of hard drives and the store where the computers were bought are not related. A) There is evidence to reject the claim that the size of hard drive sold and the store number are not related because the test value 25.309 > 7.815
B) There is evidence to reject the claim that the size of hard drive sold and the store number are not related because the test value 2.027 > 7.815
C) There is not evidence to reject the claim that the size of hard drive sold and the store number are not related because the test value 7.815 < 2.027
D) There is not evidence to reject the claim that the size of hard drive sold and the store number are not related because the test value 15.507 < 2.027
Question
Chicken, hot dogs, and hamburgers were served during a recent barbeque. The host assumed that there would be no difference between what the women chose to eat and what the men chose to eat. Compute the test value for the following data. 
A) 1.596
B) 4.140
C) 1.686
D) 5.769
A) 1.596
B) 4.140
C) 1.686
D) 5.769
Question
The method that uses the formula 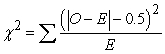 is called the __________ correction for continuity.
is called the __________ correction for continuity. Question
Given that a contingency table has dimensions of 5 5, what is the critical value of chi-square at  ?
?
A) 37.652
B) 26.296
C) 31.410
D) 36.415
?A) 37.652
B) 26.296
C) 31.410
D) 36.415
Question
Question
A random group of students was asked to name their favorite type of music. The campus radio station believes that 16% of the students prefer rap, 26% prefer rock, 17% prefer country, 13% prefer new age, and 28% prefer oldies. Is there evidence to reject this hypothesis at  = 0.05?
A) There is evidence to reject the claim that the favorite music types are distributed as claimed because the test value 9.488 > 7.212
B) There is not evidence to reject the claim that the favorite music types are distributed as claimed because the test value 7.212 < 7.815
C) There is evidence to reject the claim that the favorite music types are distributed as claimed because the test value 11.07 > 7.212
D) There is not evidence to reject the claim that the favorite music types are distributed as claimed because the test value 7.212 < 9.488
= 0.05? A) There is evidence to reject the claim that the favorite music types are distributed as claimed because the test value 9.488 > 7.212
B) There is not evidence to reject the claim that the favorite music types are distributed as claimed because the test value 7.212 < 7.815
C) There is evidence to reject the claim that the favorite music types are distributed as claimed because the test value 11.07 > 7.212
D) There is not evidence to reject the claim that the favorite music types are distributed as claimed because the test value 7.212 < 9.488
Question
Question
The table lists the number of students from three different high schools participating in the mathematics and physics sections of a science fair. At  , test the claim that the section of participation and the high school where the students were from are independent.
A) There is evidence to reject the claim that the high school and the section of participation are independent because the test value 12.592 > 1.198
B) There is not evidence to reject the claim that the high school and the section of participation are independent because the test value 1.198 < 5.991
C) There is evidence to reject the claim that the high school and the section of participation are independent because the test value 5.991 > 1.198
D) There is not evidence to reject the claim that the high school and the section of participation are independent because the test value 3.917 < 5.991
, test the claim that the section of participation and the high school where the students were from are independent. A) There is evidence to reject the claim that the high school and the section of participation are independent because the test value 12.592 > 1.198
B) There is not evidence to reject the claim that the high school and the section of participation are independent because the test value 1.198 < 5.991
C) There is evidence to reject the claim that the high school and the section of participation are independent because the test value 5.991 > 1.198
D) There is not evidence to reject the claim that the high school and the section of participation are independent because the test value 3.917 < 5.991
Question
The dean of a local school wanted to determine if the grade distribution was independent of the subject matter taught. How many degrees of freedom does this contingency table have? 
Question
Question
A random group of used books was selected from book warehouse to analyze their condition. The book store believes that 20% of the books are in excellent condition, 38% are in very good condition, 15% are in fair condition, and 27% are in poor condition. Is there evidence to reject this hypothesis at  = 0.05?
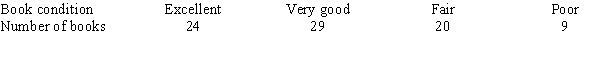
A) There is evidence to reject the claim that the books are distributed as claimed because the test value 16.291 > 7.815
B) There is not evidence to reject the claim that the books are distributed as claimed because the test value 7.815 < 16.291
C) There is evidence to reject the claim that the books are distributed as claimed because the test value 16.291 > 9.488
D) There is not evidence to reject the claim that the books are distributed as claimed because the test value 9.488 < 16.291
= 0.05? A) There is evidence to reject the claim that the books are distributed as claimed because the test value 16.291 > 7.815
B) There is not evidence to reject the claim that the books are distributed as claimed because the test value 7.815 < 16.291
C) There is evidence to reject the claim that the books are distributed as claimed because the test value 16.291 > 9.488
D) There is not evidence to reject the claim that the books are distributed as claimed because the test value 9.488 < 16.291
Question
A biologist had mice and rats run through a maze and recorded the number that finished the maze successfully and the number that did not. The table lists the results of the study. At  , test the claim that the rodent type and the success of finishing the maze are not related.
A) There is evidence to reject the claim that the rodent type and the success of finishing the maze are not related because the test value 3.841 > 4.743
B) There is evidence to reject the claim that the rodent type and the success of finishing the maze are not related because the test value 9.488 > 1.848
C) There is evidence to reject the claim that the rodent type and the success of finishing the maze are not related because the test value 4.743 > 3.841
D) There is evidence to reject the claim that the rodent type and the success of finishing the maze are not related because the test value 1.848 > 9.488
, test the claim that the rodent type and the success of finishing the maze are not related. A) There is evidence to reject the claim that the rodent type and the success of finishing the maze are not related because the test value 3.841 > 4.743
B) There is evidence to reject the claim that the rodent type and the success of finishing the maze are not related because the test value 9.488 > 1.848
C) There is evidence to reject the claim that the rodent type and the success of finishing the maze are not related because the test value 4.743 > 3.841
D) There is evidence to reject the claim that the rodent type and the success of finishing the maze are not related because the test value 1.848 > 9.488
Question
Question
Question
Question
A study was performed at a university to analyze whether the preference for hamburgers or fried chicken is related to the gender of the student. This table lists the results of the study. At  , test the claim that the meal preference and the gender of the student are not related.
A) There is evidence to reject the claim that the meal preference and the gender of the student are not related because the test value 3.841 > 1.145
B) There is evidence to reject the claim that the meal preference and the gender of the student are not related because the test value 9.488 > 0.962
C) There is not evidence to reject the claim that the meal preference and the gender of the student are not related because the test value 1.145 < 3.841
D) There is not evidence to reject the claim that the meal preference and the gender of the student are not related because the test value 0.962 < 9.488
, test the claim that the meal preference and the gender of the student are not related. A) There is evidence to reject the claim that the meal preference and the gender of the student are not related because the test value 3.841 > 1.145
B) There is evidence to reject the claim that the meal preference and the gender of the student are not related because the test value 9.488 > 0.962
C) There is not evidence to reject the claim that the meal preference and the gender of the student are not related because the test value 1.145 < 3.841
D) There is not evidence to reject the claim that the meal preference and the gender of the student are not related because the test value 0.962 < 9.488
Question
The table lists the sugar content of two types of apples from three different orchards. At  , test the claim that the sugar content of the apples and the orchard where they were grown are not related.
A) There is evidence to reject the claim that the sugar content of the apple type and the orchard number are not related because the test value 5.991 > 3.827
B) There is not evidence to reject the claim that the sugar content of the apple type and the orchard number are not related because the test value 3.827 < 5.991
C) There is evidence to reject the claim that the sugar content of the apple type and the orchard number are not related because the test value 12.592 > 1.711
D) There is not evidence to reject the claim that the sugar content of the apple type and the orchard number are not related because the test value 1.711 < 12.592
, test the claim that the sugar content of the apples and the orchard where they were grown are not related. A) There is evidence to reject the claim that the sugar content of the apple type and the orchard number are not related because the test value 5.991 > 3.827
B) There is not evidence to reject the claim that the sugar content of the apple type and the orchard number are not related because the test value 3.827 < 5.991
C) There is evidence to reject the claim that the sugar content of the apple type and the orchard number are not related because the test value 12.592 > 1.711
D) There is not evidence to reject the claim that the sugar content of the apple type and the orchard number are not related because the test value 1.711 < 12.592
Question
Question
Question
A marketing company selected a sample of 25 lawyers and 25 doctors to determine if they had voted in the last election. At  , test the claim that the proportions who voted are equal.
A) There is evidence to reject the claim that the proportions are equal because the test value 3.841 > 0.000
B) There is not evidence to reject the claim that the proportions are equal because the test value 0.000 < 3.841
C) There is not evidence to reject the claim that the proportions are equal because the test value 0.000 < 9.488
D) There is evidence to reject the claim that the proportions are equal because the test value 9.488 > 0.000
, test the claim that the proportions who voted are equal. A) There is evidence to reject the claim that the proportions are equal because the test value 3.841 > 0.000
B) There is not evidence to reject the claim that the proportions are equal because the test value 0.000 < 3.841
C) There is not evidence to reject the claim that the proportions are equal because the test value 0.000 < 9.488
D) There is evidence to reject the claim that the proportions are equal because the test value 9.488 > 0.000
Question
Question
Question
A quality control supervisor selected a sample of 100 electronic components from each of three different production chains to determine if the production chains had the same rates of meeting their quality standards. At  = .05, test the claim that the proportions are equal.
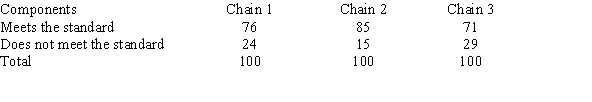
A) There is evidence to reject the claim that the proportions are equal because the test value 5.991 > 5.743
B) There is not evidence to reject the claim that the proportions are equal because the test value 5.743 < 5.991
C) There is not evidence to reject the claim that the proportions are equal because the test value 5.991 > 5.743
D) There is evidence to reject the claim that the proportions are equal because the test value 5.743 < 5.991
= .05, test the claim that the proportions are equal. A) There is evidence to reject the claim that the proportions are equal because the test value 5.991 > 5.743
B) There is not evidence to reject the claim that the proportions are equal because the test value 5.743 < 5.991
C) There is not evidence to reject the claim that the proportions are equal because the test value 5.991 > 5.743
D) There is evidence to reject the claim that the proportions are equal because the test value 5.743 < 5.991
Question
A researcher selected a sample of 50 residents from each of three different cities to determine if they were willing to participate in a medical experiment. At  , test the claim that the proportions who will participate are equal.
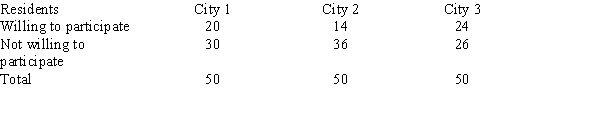
A) There is evidence to reject the claim that the proportions are equal because the test value 4.273 < 5.991
B) There is not evidence to reject the claim that the proportions are equal because the test value 5.991 > 4.273
C) There is evidence to reject the claim that the proportions are equal because the test value 5.991 > 4.273
D) There is not evidence to reject the claim that the proportions are equal because the test value 4.273 < 5.991
, test the claim that the proportions who will participate are equal. A) There is evidence to reject the claim that the proportions are equal because the test value 4.273 < 5.991
B) There is not evidence to reject the claim that the proportions are equal because the test value 5.991 > 4.273
C) There is evidence to reject the claim that the proportions are equal because the test value 5.991 > 4.273
D) There is not evidence to reject the claim that the proportions are equal because the test value 4.273 < 5.991
Question
A product testing laboratory selected a sample of 20 printers from 2 different manufacturers to determine if they could print more than 100,000 pages without breaking down. At  , test the claim that the proportions lasting more than 100,000 pages are equal.
A) There is not evidence to reject the claim that the proportions are equal because the test value 2.506 < 3.841
B) There is evidence to reject the claim that the proportions are equal because the test value 3.841 > 1.003
C) There is not evidence to reject the claim that the proportions are equal because the test value 2.506 < 9.488
D) There is not evidence to reject the claim that the proportions are equal because the test value 9.488 > 1.003
, test the claim that the proportions lasting more than 100,000 pages are equal. A) There is not evidence to reject the claim that the proportions are equal because the test value 2.506 < 3.841
B) There is evidence to reject the claim that the proportions are equal because the test value 3.841 > 1.003
C) There is not evidence to reject the claim that the proportions are equal because the test value 2.506 < 9.488
D) There is not evidence to reject the claim that the proportions are equal because the test value 9.488 > 1.003

Unlock Deck
Sign up to unlock the cards in this deck!
Unlock Deck
Unlock Deck
1/47
Play
Full screen (f)
Deck 11: Other Chi-Square Tests
1
The chi-square goodness-of-fit test is always one-tailed left.
False
2
The formula for finding the chi-square test value is __________.
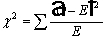
3
A random group of apartments was selected from a city to analyze the number of bedrooms they have. Is there evidence to reject the hypothesis that the apartments are equally distributed between 1-bedroom, 2-bedroom, and 3-bedroom apartments, at = 0.05?
A) There is not evidence to reject the claim that the apartments are equally distributed between the three sizes because the test value 0.412 < 5.991
B) There is evidence to reject the claim that the apartments are equally distributed between the three sizes because the test value 5.991 > 0.412
C) There is not evidence to reject the claim that the apartments are equally distributed between the three sizes because the test value 0.412 < 7.815
D) There is evidence to reject the claim that the apartments are equally distributed between the three sizes because the test value 7.815 > 0.412
= 0.05? A) There is not evidence to reject the claim that the apartments are equally distributed between the three sizes because the test value 0.412 < 5.991
B) There is evidence to reject the claim that the apartments are equally distributed between the three sizes because the test value 5.991 > 0.412
C) There is not evidence to reject the claim that the apartments are equally distributed between the three sizes because the test value 0.412 < 7.815
D) There is evidence to reject the claim that the apartments are equally distributed between the three sizes because the test value 7.815 > 0.412
A
4
A random group of oranges were selected from an orchard to analyze their ripeness. Based on the time of year, the orchard owner believes that 20% of the oranges are ready for picking now, 40% will be ready in three days, 30% will be ready in one week, and 10% will be ready in two weeks. Is there evidence to reject this hypothesis at = 0.05?
A) There is evidence to reject the claim that the oranges are distributed as claimed because the test value 21.553 > 9.488
B) There is not evidence to reject the claim that the oranges are distributed as claimed because the test value 5.991 < 21.553
C) There is evidence to reject the claim that the oranges are distributed as claimed because the test value 21.553 > 7.815
D) There is not evidence to reject the claim that the oranges are distributed as claimed because the test value 9.488 < 21.553
= 0.05? A) There is evidence to reject the claim that the oranges are distributed as claimed because the test value 21.553 > 9.488
B) There is not evidence to reject the claim that the oranges are distributed as claimed because the test value 5.991 < 21.553
C) There is evidence to reject the claim that the oranges are distributed as claimed because the test value 21.553 > 7.815
D) There is not evidence to reject the claim that the oranges are distributed as claimed because the test value 9.488 < 21.553
Unlock Deck
Unlock for access to all 47 flashcards in this deck.
Unlock Deck
k this deck
5
A random group of students was selected from a large student conference to analyze their class in school. Is there evidence to reject the hypothesis that the number of students is equally distributed between the four classes, at = 0.05?
A) There is not evidence to reject the claim that students are equally distributed between the four classes because the test value 7.815 < 8.897
B) There is evidence to reject the claim that the customers' preferences are distributed between the four classes because the test value 8.897 > 9.488
C) There is not evidence to reject the claim that students are equally distributed between the four classes because the test value 9.488 < 8.897
D) There is evidence to reject the claim that students are equally distributed between the four classes because the test value 8.897 > 7.815
= 0.05? A) There is not evidence to reject the claim that students are equally distributed between the four classes because the test value 7.815 < 8.897
B) There is evidence to reject the claim that the customers' preferences are distributed between the four classes because the test value 8.897 > 9.488
C) There is not evidence to reject the claim that students are equally distributed between the four classes because the test value 9.488 < 8.897
D) There is evidence to reject the claim that students are equally distributed between the four classes because the test value 8.897 > 7.815
Unlock Deck
Unlock for access to all 47 flashcards in this deck.
Unlock Deck
k this deck
6
The null hypothesis should not be rejected for the data given in the figure below.
Unlock Deck
Unlock for access to all 47 flashcards in this deck.
Unlock Deck
k this deck
7
A random group of customers at a fast food chain were asked whether they preferred hamburgers, chicken sandwiches, or fish sandwiches. The restaurant's marketing department claims that 45% of customers prefer hamburgers, 37% of the customers prefer chicken sandwiches, and 18% of the customers prefer fish sandwiches. Is there evidence to reject this hypothesis at = 0.05?
A) There is evidence to reject the claim that the customers' preferences are distributed as claimed because the test value 7.815 > 2.843
B) There is not evidence to reject the claim that the customers' preferences are distributed as claimed because the test value 2.843 < 5.991
C) There is evidence to reject the claim that the customers' preferences are distributed as claimed because the test value 5.991 > 2.843
D) There is not evidence to reject the claim that the customers' preferences are distributed as claimed because the test value 2.843 < 7.815
= 0.05? A) There is evidence to reject the claim that the customers' preferences are distributed as claimed because the test value 7.815 > 2.843
B) There is not evidence to reject the claim that the customers' preferences are distributed as claimed because the test value 2.843 < 5.991
C) There is evidence to reject the claim that the customers' preferences are distributed as claimed because the test value 5.991 > 2.843
D) There is not evidence to reject the claim that the customers' preferences are distributed as claimed because the test value 2.843 < 7.815
Unlock Deck
Unlock for access to all 47 flashcards in this deck.
Unlock Deck
k this deck
8
In a chi-square goodness-of-fit test when there is close agreement between the observed frequency and the expected frequency, the chi-square test value will be small.
Unlock Deck
Unlock for access to all 47 flashcards in this deck.
Unlock Deck
k this deck
9
The critical chi-square value for 15 degrees of freedom when and the test is right-tailed is 19.675.
and the test is right-tailed is 19.675. Unlock Deck
Unlock for access to all 47 flashcards in this deck.
Unlock Deck
k this deck
10
A shoe salesman wants to see if his female customers have a preference in the color of shoe purchased. Compute the test value for the following data.
A) 28.31
B) 16.77
C) 26.80
D) 21.50
A) 28.31
B) 16.77
C) 26.80
D) 21.50
Unlock Deck
Unlock for access to all 47 flashcards in this deck.
Unlock Deck
k this deck
11
The chi-square distribution is continuous, whereas the goodness-of-fit test is __________.
Unlock Deck
Unlock for access to all 47 flashcards in this deck.
Unlock Deck
k this deck
12
In a goodness of fit test between one observed frequency distribution and one expected frequency distribution, the degrees of freedom are equal to the number of categories minus two.
Unlock Deck
Unlock for access to all 47 flashcards in this deck.
Unlock Deck
k this deck
13
For four degrees of freedom, the value of shown in the distribution below is 0.05.
shown in the distribution below is 0.05. Unlock Deck
Unlock for access to all 47 flashcards in this deck.
Unlock Deck
k this deck
14
An assumption for the goodness-of-fit test is that the __________ frequency for each category must be five or more.
Unlock Deck
Unlock for access to all 47 flashcards in this deck.
Unlock Deck
k this deck
15
A chewing gum manufacturer wishes to determine if his customers prefer one flavor gum to any other flavor. He selects a random sample of customers and records the flavor of gum that is purchased. Compute the test value for the data given.
A) 6.18
B) 29.5
C) 11.56
D) 18.0
A) 6.18
B) 29.5
C) 11.56
D) 18.0
Unlock Deck
Unlock for access to all 47 flashcards in this deck.
Unlock Deck
k this deck
16
Before computing the test value, one should state the hypothesis.
Unlock Deck
Unlock for access to all 47 flashcards in this deck.
Unlock Deck
k this deck
17
An anatomy teacher hypothesizes that the final grades in her class are distributed as 10% A's, 23% B's, 45% C's, 14% D's, and 8% F's. At the end of the semester, she has the following grades. Find the critical value. Use .
A) 9.236
B) 7.779
C) 11.070
D) 9.488
Find the critical value. Use .A) 9.236
B) 7.779
C) 11.070
D) 9.488
Unlock Deck
Unlock for access to all 47 flashcards in this deck.
Unlock Deck
k this deck
18
Frequencies obtained by calculation are called expected frequencies.
Unlock Deck
Unlock for access to all 47 flashcards in this deck.
Unlock Deck
k this deck
19
A random group of desktop computer sales was selected from an electronic discount chain to analyze the size of monitor purchased with the computer. Is there evidence to reject the hypothesis that the number of monitors is equally distributed between the five types, at = 0.05?
A) There is evidence to reject the claim that the monitors are equally distributed between the five classes because the test value 14.286 > 11.070
B) There is not evidence to reject the claim that the monitors are equally distributed between the five classes because the test value 9.488 < 14.286
C) There is evidence to reject the claim that the monitors are equally distributed between the five classes because the test value 14.286 > 9.488
D) There is not evidence to reject the claim that the monitors are equally distributed between the five classes because the test value 11.070 < 14.286
= 0.05? A) There is evidence to reject the claim that the monitors are equally distributed between the five classes because the test value 14.286 > 11.070
B) There is not evidence to reject the claim that the monitors are equally distributed between the five classes because the test value 9.488 < 14.286
C) There is evidence to reject the claim that the monitors are equally distributed between the five classes because the test value 14.286 > 9.488
D) There is not evidence to reject the claim that the monitors are equally distributed between the five classes because the test value 11.070 < 14.286
Unlock Deck
Unlock for access to all 47 flashcards in this deck.
Unlock Deck
k this deck
20
A random group of seniors was selected from a university and asked about their plans for the following year. The school advising office claims that 60% of the students plan to work, 30% of the students plan to continue in school, and 10% of the students plan to take some time off. Is there evidence to reject this hypothesis at = 0.05?
A) There is evidence to reject the claim that the students' plans are distributed as claimed because the test value 6.778 > 5.991
B) There is not evidence to reject the claim that the students' plans are distributed as claimed because the test value 6.778 > 7.815
C) There is evidence to reject the claim that the students' plans are distributed as claimed because the test value 6.778 > 7.815
D) There is not evidence to reject the claim that the students' plans are distributed as claimed because the test value 6.778 > 5.991
= 0.05? A) There is evidence to reject the claim that the students' plans are distributed as claimed because the test value 6.778 > 5.991
B) There is not evidence to reject the claim that the students' plans are distributed as claimed because the test value 6.778 > 7.815
C) There is evidence to reject the claim that the students' plans are distributed as claimed because the test value 6.778 > 7.815
D) There is not evidence to reject the claim that the students' plans are distributed as claimed because the test value 6.778 > 5.991
Unlock Deck
Unlock for access to all 47 flashcards in this deck.
Unlock Deck
k this deck
21
Two allergists recorded the main area of allergy for new patients during a month. At , test the claim that the allergy diagnosis and the doctor that treated the patients are independent.
A) There is not evidence to reject the claim that the allergy diagnosis and the doctor are not related because the test value 1.839 > 15.507
B) There is not evidence to reject the claim that the allergy diagnosis and the doctor are not related because the test value 3.698 < 7.815
C) There is evidence to reject the claim that the allergy diagnosis and the doctor are not related because the test value 7.815 > 3.698
D) There is evidence to reject the claim that the allergy diagnosis and the doctor are not related because the test value 15.507 > 1.839
, test the claim that the allergy diagnosis and the doctor that treated the patients are independent. A) There is not evidence to reject the claim that the allergy diagnosis and the doctor are not related because the test value 1.839 > 15.507
B) There is not evidence to reject the claim that the allergy diagnosis and the doctor are not related because the test value 3.698 < 7.815
C) There is evidence to reject the claim that the allergy diagnosis and the doctor are not related because the test value 7.815 > 3.698
D) There is evidence to reject the claim that the allergy diagnosis and the doctor are not related because the test value 15.507 > 1.839
Unlock Deck
Unlock for access to all 47 flashcards in this deck.
Unlock Deck
k this deck
22
A contingency table is made up of 8 rows and 4 columns. How many degrees of freedom are present?
A) 32
B) 28
C) 24
D) 21
A) 32
B) 28
C) 24
D) 21
Unlock Deck
Unlock for access to all 47 flashcards in this deck.
Unlock Deck
k this deck
23
Two computer stores recorded the number of computers sold in a week along with the sizes of their hard drives. At , test the claim that the distribution of hard drives and the store where the computers were bought are not related.
A) There is evidence to reject the claim that the size of hard drive sold and the store number are not related because the test value 25.309 > 7.815
B) There is evidence to reject the claim that the size of hard drive sold and the store number are not related because the test value 2.027 > 7.815
C) There is not evidence to reject the claim that the size of hard drive sold and the store number are not related because the test value 7.815 < 2.027
D) There is not evidence to reject the claim that the size of hard drive sold and the store number are not related because the test value 15.507 < 2.027
, test the claim that the distribution of hard drives and the store where the computers were bought are not related. A) There is evidence to reject the claim that the size of hard drive sold and the store number are not related because the test value 25.309 > 7.815
B) There is evidence to reject the claim that the size of hard drive sold and the store number are not related because the test value 2.027 > 7.815
C) There is not evidence to reject the claim that the size of hard drive sold and the store number are not related because the test value 7.815 < 2.027
D) There is not evidence to reject the claim that the size of hard drive sold and the store number are not related because the test value 15.507 < 2.027
Unlock Deck
Unlock for access to all 47 flashcards in this deck.
Unlock Deck
k this deck
24
Chicken, hot dogs, and hamburgers were served during a recent barbeque. The host assumed that there would be no difference between what the women chose to eat and what the men chose to eat. Compute the test value for the following data.
A) 1.596
B) 4.140
C) 1.686
D) 5.769
A) 1.596
B) 4.140
C) 1.686
D) 5.769
Unlock Deck
Unlock for access to all 47 flashcards in this deck.
Unlock Deck
k this deck
25
The method that uses the formula is called the __________ correction for continuity.
is called the __________ correction for continuity. Unlock Deck
Unlock for access to all 47 flashcards in this deck.
Unlock Deck
k this deck
26
Given that a contingency table has dimensions of 5 5, what is the critical value of chi-square at ?
A) 37.652
B) 26.296
C) 31.410
D) 36.415
?A) 37.652
B) 26.296
C) 31.410
D) 36.415
Unlock Deck
Unlock for access to all 47 flashcards in this deck.
Unlock Deck
k this deck
27
The chi-square independence test can be used to test the independence of two variables.
Unlock Deck
Unlock for access to all 47 flashcards in this deck.
Unlock Deck
k this deck
28
A random group of students was asked to name their favorite type of music. The campus radio station believes that 16% of the students prefer rap, 26% prefer rock, 17% prefer country, 13% prefer new age, and 28% prefer oldies. Is there evidence to reject this hypothesis at = 0.05?
A) There is evidence to reject the claim that the favorite music types are distributed as claimed because the test value 9.488 > 7.212
B) There is not evidence to reject the claim that the favorite music types are distributed as claimed because the test value 7.212 < 7.815
C) There is evidence to reject the claim that the favorite music types are distributed as claimed because the test value 11.07 > 7.212
D) There is not evidence to reject the claim that the favorite music types are distributed as claimed because the test value 7.212 < 9.488
= 0.05? A) There is evidence to reject the claim that the favorite music types are distributed as claimed because the test value 9.488 > 7.212
B) There is not evidence to reject the claim that the favorite music types are distributed as claimed because the test value 7.212 < 7.815
C) There is evidence to reject the claim that the favorite music types are distributed as claimed because the test value 11.07 > 7.212
D) There is not evidence to reject the claim that the favorite music types are distributed as claimed because the test value 7.212 < 9.488
Unlock Deck
Unlock for access to all 47 flashcards in this deck.
Unlock Deck
k this deck
29
The test of independence of variables is used to determine whether two variables are independent or related when a single sample is selected.
Unlock Deck
Unlock for access to all 47 flashcards in this deck.
Unlock Deck
k this deck
30
The table lists the number of students from three different high schools participating in the mathematics and physics sections of a science fair. At , test the claim that the section of participation and the high school where the students were from are independent.
A) There is evidence to reject the claim that the high school and the section of participation are independent because the test value 12.592 > 1.198
B) There is not evidence to reject the claim that the high school and the section of participation are independent because the test value 1.198 < 5.991
C) There is evidence to reject the claim that the high school and the section of participation are independent because the test value 5.991 > 1.198
D) There is not evidence to reject the claim that the high school and the section of participation are independent because the test value 3.917 < 5.991
, test the claim that the section of participation and the high school where the students were from are independent. A) There is evidence to reject the claim that the high school and the section of participation are independent because the test value 12.592 > 1.198
B) There is not evidence to reject the claim that the high school and the section of participation are independent because the test value 1.198 < 5.991
C) There is evidence to reject the claim that the high school and the section of participation are independent because the test value 5.991 > 1.198
D) There is not evidence to reject the claim that the high school and the section of participation are independent because the test value 3.917 < 5.991
Unlock Deck
Unlock for access to all 47 flashcards in this deck.
Unlock Deck
k this deck
31
The dean of a local school wanted to determine if the grade distribution was independent of the subject matter taught. How many degrees of freedom does this contingency table have?
Unlock Deck
Unlock for access to all 47 flashcards in this deck.
Unlock Deck
k this deck
32
The degrees of freedom for a 3 5 contingency table are __________.
Unlock Deck
Unlock for access to all 47 flashcards in this deck.
Unlock Deck
k this deck
33
A random group of used books was selected from book warehouse to analyze their condition. The book store believes that 20% of the books are in excellent condition, 38% are in very good condition, 15% are in fair condition, and 27% are in poor condition. Is there evidence to reject this hypothesis at = 0.05?
A) There is evidence to reject the claim that the books are distributed as claimed because the test value 16.291 > 7.815
B) There is not evidence to reject the claim that the books are distributed as claimed because the test value 7.815 < 16.291
C) There is evidence to reject the claim that the books are distributed as claimed because the test value 16.291 > 9.488
D) There is not evidence to reject the claim that the books are distributed as claimed because the test value 9.488 < 16.291
= 0.05? A) There is evidence to reject the claim that the books are distributed as claimed because the test value 16.291 > 7.815
B) There is not evidence to reject the claim that the books are distributed as claimed because the test value 7.815 < 16.291
C) There is evidence to reject the claim that the books are distributed as claimed because the test value 16.291 > 9.488
D) There is not evidence to reject the claim that the books are distributed as claimed because the test value 9.488 < 16.291
Unlock Deck
Unlock for access to all 47 flashcards in this deck.
Unlock Deck
k this deck
34
A biologist had mice and rats run through a maze and recorded the number that finished the maze successfully and the number that did not. The table lists the results of the study. At , test the claim that the rodent type and the success of finishing the maze are not related.
A) There is evidence to reject the claim that the rodent type and the success of finishing the maze are not related because the test value 3.841 > 4.743
B) There is evidence to reject the claim that the rodent type and the success of finishing the maze are not related because the test value 9.488 > 1.848
C) There is evidence to reject the claim that the rodent type and the success of finishing the maze are not related because the test value 4.743 > 3.841
D) There is evidence to reject the claim that the rodent type and the success of finishing the maze are not related because the test value 1.848 > 9.488
, test the claim that the rodent type and the success of finishing the maze are not related. A) There is evidence to reject the claim that the rodent type and the success of finishing the maze are not related because the test value 3.841 > 4.743
B) There is evidence to reject the claim that the rodent type and the success of finishing the maze are not related because the test value 9.488 > 1.848
C) There is evidence to reject the claim that the rodent type and the success of finishing the maze are not related because the test value 4.743 > 3.841
D) There is evidence to reject the claim that the rodent type and the success of finishing the maze are not related because the test value 1.848 > 9.488
Unlock Deck
Unlock for access to all 47 flashcards in this deck.
Unlock Deck
k this deck
35
A contingency table has 5 rows and 4 columns. How many degrees of freedom are there?
A) 20
B) 12
C) 16
D) 15
A) 20
B) 12
C) 16
D) 15
Unlock Deck
Unlock for access to all 47 flashcards in this deck.
Unlock Deck
k this deck
36
When data are arranged in table form for the chi-square independence test, it is called a __________ table.
Unlock Deck
Unlock for access to all 47 flashcards in this deck.
Unlock Deck
k this deck
37
The degrees of freedom for a 7 5 contingency table would be 24.
Unlock Deck
Unlock for access to all 47 flashcards in this deck.
Unlock Deck
k this deck
38
A study was performed at a university to analyze whether the preference for hamburgers or fried chicken is related to the gender of the student. This table lists the results of the study. At , test the claim that the meal preference and the gender of the student are not related.
A) There is evidence to reject the claim that the meal preference and the gender of the student are not related because the test value 3.841 > 1.145
B) There is evidence to reject the claim that the meal preference and the gender of the student are not related because the test value 9.488 > 0.962
C) There is not evidence to reject the claim that the meal preference and the gender of the student are not related because the test value 1.145 < 3.841
D) There is not evidence to reject the claim that the meal preference and the gender of the student are not related because the test value 0.962 < 9.488
, test the claim that the meal preference and the gender of the student are not related. A) There is evidence to reject the claim that the meal preference and the gender of the student are not related because the test value 3.841 > 1.145
B) There is evidence to reject the claim that the meal preference and the gender of the student are not related because the test value 9.488 > 0.962
C) There is not evidence to reject the claim that the meal preference and the gender of the student are not related because the test value 1.145 < 3.841
D) There is not evidence to reject the claim that the meal preference and the gender of the student are not related because the test value 0.962 < 9.488
Unlock Deck
Unlock for access to all 47 flashcards in this deck.
Unlock Deck
k this deck
39
The table lists the sugar content of two types of apples from three different orchards. At , test the claim that the sugar content of the apples and the orchard where they were grown are not related.
A) There is evidence to reject the claim that the sugar content of the apple type and the orchard number are not related because the test value 5.991 > 3.827
B) There is not evidence to reject the claim that the sugar content of the apple type and the orchard number are not related because the test value 3.827 < 5.991
C) There is evidence to reject the claim that the sugar content of the apple type and the orchard number are not related because the test value 12.592 > 1.711
D) There is not evidence to reject the claim that the sugar content of the apple type and the orchard number are not related because the test value 1.711 < 12.592
, test the claim that the sugar content of the apples and the orchard where they were grown are not related. A) There is evidence to reject the claim that the sugar content of the apple type and the orchard number are not related because the test value 5.991 > 3.827
B) There is not evidence to reject the claim that the sugar content of the apple type and the orchard number are not related because the test value 3.827 < 5.991
C) There is evidence to reject the claim that the sugar content of the apple type and the orchard number are not related because the test value 12.592 > 1.711
D) There is not evidence to reject the claim that the sugar content of the apple type and the orchard number are not related because the test value 1.711 < 12.592
Unlock Deck
Unlock for access to all 47 flashcards in this deck.
Unlock Deck
k this deck
40
A research firm reported that 15% of those surveyed described their health as poor, 26% as good, 40% as very good, and 19% as excellent. A health professional in Chicago wanted to determine if people in Chicago had similar feelings toward their health. In a sample of 610 people in Chicago, 70 described their health as poor, 180 as good, 220 as very good, and 140 as excellent. Compute the test value.
Unlock Deck
Unlock for access to all 47 flashcards in this deck.
Unlock Deck
k this deck
41
If the null hypothesis is not rejected, it can be assumed the proportions are __________ and the differences in them are due to chance.
Unlock Deck
Unlock for access to all 47 flashcards in this deck.
Unlock Deck
k this deck
42
A marketing company selected a sample of 25 lawyers and 25 doctors to determine if they had voted in the last election. At , test the claim that the proportions who voted are equal.
A) There is evidence to reject the claim that the proportions are equal because the test value 3.841 > 0.000
B) There is not evidence to reject the claim that the proportions are equal because the test value 0.000 < 3.841
C) There is not evidence to reject the claim that the proportions are equal because the test value 0.000 < 9.488
D) There is evidence to reject the claim that the proportions are equal because the test value 9.488 > 0.000
, test the claim that the proportions who voted are equal. A) There is evidence to reject the claim that the proportions are equal because the test value 3.841 > 0.000
B) There is not evidence to reject the claim that the proportions are equal because the test value 0.000 < 3.841
C) There is not evidence to reject the claim that the proportions are equal because the test value 0.000 < 9.488
D) There is evidence to reject the claim that the proportions are equal because the test value 9.488 > 0.000
Unlock Deck
Unlock for access to all 47 flashcards in this deck.
Unlock Deck
k this deck
43
The two types of tests that use a contingency table are the independence test and the __________ test.
Unlock Deck
Unlock for access to all 47 flashcards in this deck.
Unlock Deck
k this deck
44
The computational procedure for the homogeneity of proportions differs from that of the test of independence in that it takes into account the standard deviation.
Unlock Deck
Unlock for access to all 47 flashcards in this deck.
Unlock Deck
k this deck
45
A quality control supervisor selected a sample of 100 electronic components from each of three different production chains to determine if the production chains had the same rates of meeting their quality standards. At = .05, test the claim that the proportions are equal.
A) There is evidence to reject the claim that the proportions are equal because the test value 5.991 > 5.743
B) There is not evidence to reject the claim that the proportions are equal because the test value 5.743 < 5.991
C) There is not evidence to reject the claim that the proportions are equal because the test value 5.991 > 5.743
D) There is evidence to reject the claim that the proportions are equal because the test value 5.743 < 5.991
= .05, test the claim that the proportions are equal. A) There is evidence to reject the claim that the proportions are equal because the test value 5.991 > 5.743
B) There is not evidence to reject the claim that the proportions are equal because the test value 5.743 < 5.991
C) There is not evidence to reject the claim that the proportions are equal because the test value 5.991 > 5.743
D) There is evidence to reject the claim that the proportions are equal because the test value 5.743 < 5.991
Unlock Deck
Unlock for access to all 47 flashcards in this deck.
Unlock Deck
k this deck
46
A researcher selected a sample of 50 residents from each of three different cities to determine if they were willing to participate in a medical experiment. At , test the claim that the proportions who will participate are equal.
A) There is evidence to reject the claim that the proportions are equal because the test value 4.273 < 5.991
B) There is not evidence to reject the claim that the proportions are equal because the test value 5.991 > 4.273
C) There is evidence to reject the claim that the proportions are equal because the test value 5.991 > 4.273
D) There is not evidence to reject the claim that the proportions are equal because the test value 4.273 < 5.991
, test the claim that the proportions who will participate are equal. A) There is evidence to reject the claim that the proportions are equal because the test value 4.273 < 5.991
B) There is not evidence to reject the claim that the proportions are equal because the test value 5.991 > 4.273
C) There is evidence to reject the claim that the proportions are equal because the test value 5.991 > 4.273
D) There is not evidence to reject the claim that the proportions are equal because the test value 4.273 < 5.991
Unlock Deck
Unlock for access to all 47 flashcards in this deck.
Unlock Deck
k this deck
47
A product testing laboratory selected a sample of 20 printers from 2 different manufacturers to determine if they could print more than 100,000 pages without breaking down. At , test the claim that the proportions lasting more than 100,000 pages are equal.
A) There is not evidence to reject the claim that the proportions are equal because the test value 2.506 < 3.841
B) There is evidence to reject the claim that the proportions are equal because the test value 3.841 > 1.003
C) There is not evidence to reject the claim that the proportions are equal because the test value 2.506 < 9.488
D) There is not evidence to reject the claim that the proportions are equal because the test value 9.488 > 1.003
, test the claim that the proportions lasting more than 100,000 pages are equal. A) There is not evidence to reject the claim that the proportions are equal because the test value 2.506 < 3.841
B) There is evidence to reject the claim that the proportions are equal because the test value 3.841 > 1.003
C) There is not evidence to reject the claim that the proportions are equal because the test value 2.506 < 9.488
D) There is not evidence to reject the claim that the proportions are equal because the test value 9.488 > 1.003
Unlock Deck
Unlock for access to all 47 flashcards in this deck.
Unlock Deck
k this deck
Unlock Deck
Unlock for access to all 47 flashcards in this deck.


