Deck 11: Regression Analysis: Statistical Inference
Full screen (f)
Question
Question
The t-value for testing  is calculated using which of the following equations:
A)n - k - 1
B)
C)
D)
is calculated using which of the following equations:A)n - k - 1
B)
C)
D)
Question
Question
Question
Question
Question
Question
Question
Question
Question
The appropriate hypothesis test for a regression coefficient is:
A)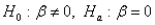
B)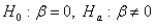
C)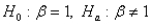
D)None of these options
A)
B)
C)
D)None of these options
Question
Question
Question
Question
Question
Question
The appropriate hypothesis test for an ANOVA test is:
A)
B)
C)
D)
A)
B)
C)
D)
Question
Question
Question
In the standardized value  ,the symbol
  represents the:
A)mean of
B)variance of
C)standard error of
D)degrees of freedom of
,the symbol represents the:A)mean of
B)variance of
C)standard error of
D)degrees of freedom of
Question
Question
Question
Question
Question
Question
Question
Question
Question
Question
Question
Question
Question
Question
Question
Question
Question
Question
Question
Question
Question
Question
Question
Question
In testing the overall fit of a multiple regression model in which there are three explanatory variables,the null hypothesis is 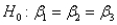 .
.
. Question
Question
Question
Question
In regression analysis,the total variation in the dependent variable Y,measured by  and referred to as SST,can be decomposed into two parts: the explained variation,measured by SSR,and the unexplained variation,measured by SSE.
and referred to as SST,can be decomposed into two parts: the explained variation,measured by SSR,and the unexplained variation,measured by SSE. Question
Question
In a simple linear regression model,testing whether the slope  of the population regression line could be zero is the same as testing whether or not the linear relationship between the response variable Y and the explanatory variable X is significant.
of the population regression line could be zero is the same as testing whether or not the linear relationship between the response variable Y and the explanatory variable X is significant. Question
Question
Question
The residuals are observations of the error variable  .Consequently,the minimized sum of squared deviations is called the sum of squared error,labeled SSE.
.Consequently,the minimized sum of squared deviations is called the sum of squared error,labeled SSE. Question
Question
In simple linear regression,if the error variable  is normally distributed,the test statistic for testing
  is t-distributed with n - 2 degrees of freedom.
is normally distributed,the test statistic for testing is t-distributed with n - 2 degrees of freedom. Question
In a simple linear regression problem,if the standard error of estimate  = 15 and n = 8,then the sum of squares for error,SSE,is 1,350.
= 15 and n = 8,then the sum of squares for error,SSE,is 1,350. Question
Question
Question
In multiple regression with k explanatory variables,the t-tests of the individual coefficients allows us to determine whether  (for i = 1,2,….,k),which tells us whether a linear relationship exists between
  and Y.
(for i = 1,2,….,k),which tells us whether a linear relationship exists between and Y. Question
Question
Question
(A)Estimate a multiple regression model that includes the two given explanatory variables.Assess this set of explanatory variables with an F-test,and report a p-value.
(B)Conduct a partial F-test to decide whether it is worthwhile to add second-order terms (i.e., )to the multiple regression equation estimated in Question 114.Employ a 5% significance level in conducting this hypothesis test.
(C)Identify and interpret the percentage of variance explained for the model in (A).
(D)Identify and interpret the percentage of variance explained for the model in (B).
(E)Which regression equation is the most appropriate one for modeling the quality of the given product? Bear in mind that a good statistical model is usually parsimonious.
(B)Conduct a partial F-test to decide whether it is worthwhile to add second-order terms (i.e.,
)to the multiple regression equation estimated in Question 114.Employ a 5% significance level in conducting this hypothesis test.(C)Identify and interpret the percentage of variance explained for the model in (A).
(D)Identify and interpret the percentage of variance explained for the model in (B).
(E)Which regression equation is the most appropriate one for modeling the quality of the given product? Bear in mind that a good statistical model is usually parsimonious.
Question
Question
Question
Question
(A)Summarize the findings of the stepwise regression method using this cutoff value.
(B)When the cutoff value was increased to 0.10,the output below was the result.The table at top left represents the change when the disposable income variable is added to the model and the table at top right represents the average price variable being added.The regression model with both added variables is shown in the bottom table.Summarize the results for this model.
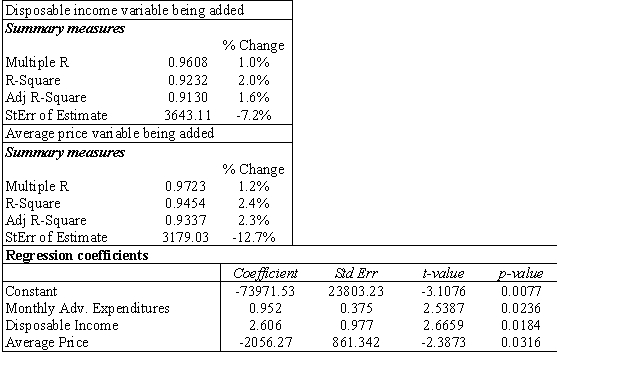 (C)Which model would you recommend using? Why?
(B)When the cutoff value was increased to 0.10,the output below was the result.The table at top left represents the change when the disposable income variable is added to the model and the table at top right represents the average price variable being added.The regression model with both added variables is shown in the bottom table.Summarize the results for this model.
(C)Which model would you recommend using? Why? Question
Question
Question
Below you will find a scatterplot of data gathered by a mail-order company.The company has been able to obtain the annual salaries of their customers and the amount that each of these customers spent with the company in 1998.Based on the scatterplot below,would you conclude that these data meet all four assumptions of regression? Explain your answer. 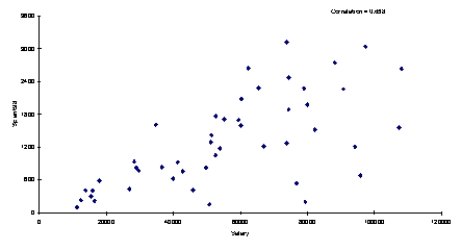
Question
Question
Question
Question
Question
Question
Question
Question
Question
Question
Question

Unlock Deck
Sign up to unlock the cards in this deck!
Unlock Deck
Unlock Deck
1/87
Play
Full screen (f)
Deck 11: Regression Analysis: Statistical Inference
1
In regression analysis,the ANOVA table analyzes:
A)the variation of the response variable Y
B)the variation of the explanatory variable X
C)the total variation of all variables
D)All of these options
A)the variation of the response variable Y
B)the variation of the explanatory variable X
C)the total variation of all variables
D)All of these options
A
2
The t-value for testing is calculated using which of the following equations:
A)n - k - 1
B)
C)
D)
is calculated using which of the following equations:A)n - k - 1
B)
C)
D)
D
3
Another term for constant error variance is:
A)homoscedasticity
B)heteroscedasticity
C)autocorrelation
D)multicollinearity
A)homoscedasticity
B)heteroscedasticity
C)autocorrelation
D)multicollinearity
A
4
A scatterplot that exhibits a "fan" shape (the variation of Y increases as X increases)is an example of:
A)homoscedasticity
B)heteroscedasticity
C)autocorrelation
D)multicollinearity
A)homoscedasticity
B)heteroscedasticity
C)autocorrelation
D)multicollinearity
Unlock Deck
Unlock for access to all 87 flashcards in this deck.
Unlock Deck
k this deck
5
Which of the following is not one of the assumptions of regression?
A)There is a population regression line
B)The response variable is normally distributed
C)The standard deviation of the response variable increases as the explanatory variables increase
D)The errors are probabilistically independent
A)There is a population regression line
B)The response variable is normally distributed
C)The standard deviation of the response variable increases as the explanatory variables increase
D)The errors are probabilistically independent
Unlock Deck
Unlock for access to all 87 flashcards in this deck.
Unlock Deck
k this deck
6
Which of the following definitions best describes parsimony?
A)Explaining the most with the least
B)Explaining the least with the most
C)Being able to explain all of the change in the response variable
D)Being able to predict the value of the response variable far into the future
A)Explaining the most with the least
B)Explaining the least with the most
C)Being able to explain all of the change in the response variable
D)Being able to predict the value of the response variable far into the future
Unlock Deck
Unlock for access to all 87 flashcards in this deck.
Unlock Deck
k this deck
7
The test statistic in an ANOVA analysis is:
A)the t-statistic
B)the z-statistic
C)the F-statistic
D)the Chi-square statistic
A)the t-statistic
B)the z-statistic
C)the F-statistic
D)the Chi-square statistic
Unlock Deck
Unlock for access to all 87 flashcards in this deck.
Unlock Deck
k this deck
8
The value k in the number of degrees of freedom,n-k-1,for the sampling distribution of the regression coefficients represents:
A)the sample size
B)the population size
C)the number of coefficients in the regression equation,including the constant
D)the number of independent variables included in the equation
A)the sample size
B)the population size
C)the number of coefficients in the regression equation,including the constant
D)the number of independent variables included in the equation
Unlock Deck
Unlock for access to all 87 flashcards in this deck.
Unlock Deck
k this deck
9
The ANOVA table splits the total variation into two parts.They are the
A)acceptable and unacceptable variation
B)adequate and inadequate variation
C)resolved and unresolved variation
D)explained and unexplained variation
A)acceptable and unacceptable variation
B)adequate and inadequate variation
C)resolved and unresolved variation
D)explained and unexplained variation
Unlock Deck
Unlock for access to all 87 flashcards in this deck.
Unlock Deck
k this deck
10
Which of the following is the relevant sampling distribution for regression coefficients?
A)Normal distribution
B)t-distribution with n-1 degrees of freedom
C)t-distribution with n-1-k degrees of freedom
D)F-distribution with n-1-k degrees of freedom
A)Normal distribution
B)t-distribution with n-1 degrees of freedom
C)t-distribution with n-1-k degrees of freedom
D)F-distribution with n-1-k degrees of freedom
Unlock Deck
Unlock for access to all 87 flashcards in this deck.
Unlock Deck
k this deck
11
The appropriate hypothesis test for a regression coefficient is:
A)
B)
C)
D)None of these options
A)
B)
C)
D)None of these options
Unlock Deck
Unlock for access to all 87 flashcards in this deck.
Unlock Deck
k this deck
12
Which of the following is true regarding regression error,e
A)it is the same as a residual
B)it can be calculated from the observed data
C)it cannot be calculated from the observed data
D)it is unbiased
A)it is the same as a residual
B)it can be calculated from the observed data
C)it cannot be calculated from the observed data
D)it is unbiased
Unlock Deck
Unlock for access to all 87 flashcards in this deck.
Unlock Deck
k this deck
13
In regression analysis,multicollinearity refers to:
A)the response variables being highly correlated
B)the explanatory variables being highly correlated
C)the response variable(s)and the explanatory variable(s)are highly correlated with one another
D)the response variables are highly correlated over time.
A)the response variables being highly correlated
B)the explanatory variables being highly correlated
C)the response variable(s)and the explanatory variable(s)are highly correlated with one another
D)the response variables are highly correlated over time.
Unlock Deck
Unlock for access to all 87 flashcards in this deck.
Unlock Deck
k this deck
14
Time series data often exhibits which of the following characteristics?
A)homoscedasticity
B)heteroscedasticity
C)autocorrelation
D)multicollinearity
A)homoscedasticity
B)heteroscedasticity
C)autocorrelation
D)multicollinearity
Unlock Deck
Unlock for access to all 87 flashcards in this deck.
Unlock Deck
k this deck
15
The error term represents the vertical distance from any point to the
A)estimated regression line
B)population regression line
C)value of the Y's
D)mean value of the X's
A)estimated regression line
B)population regression line
C)value of the Y's
D)mean value of the X's
Unlock Deck
Unlock for access to all 87 flashcards in this deck.
Unlock Deck
k this deck
16
Suppose you run a regression of a person's height on his/her right and left foot sizes,and you suspect that there may be multicollinearity between the foot sizes.What types of problems might you see if your suspicions are true?
A)"Wrong" values for the coefficients for the left and right foot size
B)Large p-values for the coefficients for the left and right foot size
C)Small t-values for the coefficients for the left and right foot size
D)All of these options
A)"Wrong" values for the coefficients for the left and right foot size
B)Large p-values for the coefficients for the left and right foot size
C)Small t-values for the coefficients for the left and right foot size
D)All of these options
Unlock Deck
Unlock for access to all 87 flashcards in this deck.
Unlock Deck
k this deck
17
The appropriate hypothesis test for an ANOVA test is:
A)
B)
C)
D)
A)
B)
C)
D)
Unlock Deck
Unlock for access to all 87 flashcards in this deck.
Unlock Deck
k this deck
18
Which of the following is not one of the guidelines for including/excluding variables in a regression equation?
A)Look at t-value and associated p-value
B)Check whether t-value is less than or greater than 1.0
C)Variables are logically related to one another
D)Use economic or physical theory to make decision
E)All of these options are guidelines
A)Look at t-value and associated p-value
B)Check whether t-value is less than or greater than 1.0
C)Variables are logically related to one another
D)Use economic or physical theory to make decision
E)All of these options are guidelines
Unlock Deck
Unlock for access to all 87 flashcards in this deck.
Unlock Deck
k this deck
19
The term autocorrelation refers to:
A)analyzed data refers to itself
B)sample is related too closely to the population
C)data are in a loop (values repeat themselves)
D)time series variables are usually related to their own past values
A)analyzed data refers to itself
B)sample is related too closely to the population
C)data are in a loop (values repeat themselves)
D)time series variables are usually related to their own past values
Unlock Deck
Unlock for access to all 87 flashcards in this deck.
Unlock Deck
k this deck
20
In the standardized value ,the symbol represents the:
A)mean of
B)variance of
C)standard error of
D)degrees of freedom of
,the symbol represents the:A)mean of
B)variance of
C)standard error of
D)degrees of freedom of
Unlock Deck
Unlock for access to all 87 flashcards in this deck.
Unlock Deck
k this deck
21
Many statistical packages have three types of equation-building procedures.They are:
A)forward,linear and non-linear
B)forward,backward and stepwise
C)simple,complex and stepwise
D)inclusion,exclusion and linear
A)forward,linear and non-linear
B)forward,backward and stepwise
C)simple,complex and stepwise
D)inclusion,exclusion and linear
Unlock Deck
Unlock for access to all 87 flashcards in this deck.
Unlock Deck
k this deck
22
Forward regression:
A)begins with all potential explanatory variables in the equation and deletes them one at a time until further deletion would do more harm than good.
B)adds and deletes variables until an optimal equation is achieved.
C)begins with no explanatory variables in the equation and successively adds one at a time until no remaining variables make a significant contribution.
D)randomly selects the optimal number of explanatory variables to be used
Unlock Deck
Unlock for access to all 87 flashcards in this deck.
Unlock Deck
k this deck
23
When the error variance is nonconstant,it is common to see the variation increases as the explanatory variable increases (you will see a "fan shape" in the scatterplot).There are two ways you can deal with this phenomenon.These are:
A)the weighted least squares and a logarithmic transformation
B)the partial F and a logarithmic transformation
C)the weighted least squares and the partial F
D)stepwise regression and the partial F
A)the weighted least squares and a logarithmic transformation
B)the partial F and a logarithmic transformation
C)the weighted least squares and the partial F
D)stepwise regression and the partial F
Unlock Deck
Unlock for access to all 87 flashcards in this deck.
Unlock Deck
k this deck
24
When determining whether to include or exclude a variable in regression analysis,if the p-value associated with the variable's t-value is above some accepted significance value,such as 0.05,then the variable:
A)is a candidate for inclusion
B)is a candidate for exclusion
C)is redundant
D)not fit the guidelines of parsimony
A)is a candidate for inclusion
B)is a candidate for exclusion
C)is redundant
D)not fit the guidelines of parsimony
Unlock Deck
Unlock for access to all 87 flashcards in this deck.
Unlock Deck
k this deck
25
Suppose you forecast the values of all of the independent variables and insert them into a multiple regression equation and obtain a point prediction for the dependent variable.You could then use the standard error of the estimate to obtain an approximate
A)confidence interval
B)prediction interval
C)hypothesis test
D)independence test
A)confidence interval
B)prediction interval
C)hypothesis test
D)independence test
Unlock Deck
Unlock for access to all 87 flashcards in this deck.
Unlock Deck
k this deck
26
In regression analysis,extrapolation is performed when you:
A)attempt to predict beyond the limits of the sample
B)have to estimate some of the explanatory variable values
C)have to use a lag variable as an explanatory variable in the model
D)don't have observations for every period in the sample
A)attempt to predict beyond the limits of the sample
B)have to estimate some of the explanatory variable values
C)have to use a lag variable as an explanatory variable in the model
D)don't have observations for every period in the sample
Unlock Deck
Unlock for access to all 87 flashcards in this deck.
Unlock Deck
k this deck
27
A researcher can check whether the errors are normally distributed by using:
A)a t-test or an F-test
B)the Durbin-Watson statistic
C)a frequency distribution or the value of the regression coefficient
D)a histogram or a Q-Q plot
A)a t-test or an F-test
B)the Durbin-Watson statistic
C)a frequency distribution or the value of the regression coefficient
D)a histogram or a Q-Q plot
Unlock Deck
Unlock for access to all 87 flashcards in this deck.
Unlock Deck
k this deck
28
Multiple regression represents an improvement over simple regression because it allows any number of response variables to be included in the analysis.
Unlock Deck
Unlock for access to all 87 flashcards in this deck.
Unlock Deck
k this deck
29
There are situations where a set of explanatory variables forms a logical group.The test to determine whether the extra variables provide enough extra explanatory power to warrant inclusion in the equation is referred to as the:
A)complete F-test
B)reduced F-test
C)partial F-test
D)reduced t-test
A)complete F-test
B)reduced F-test
C)partial F-test
D)reduced t-test
Unlock Deck
Unlock for access to all 87 flashcards in this deck.
Unlock Deck
k this deck
30
Which of the following would be considered a definition of an outlier?
A)An extreme value for one or more variables
B)A value whose residual is abnormally large in magnitude
C)Values for individual explanatory variables that fall outside the general pattern of the other observations
D)All of these options
A)An extreme value for one or more variables
B)A value whose residual is abnormally large in magnitude
C)Values for individual explanatory variables that fall outside the general pattern of the other observations
D)All of these options
Unlock Deck
Unlock for access to all 87 flashcards in this deck.
Unlock Deck
k this deck
31
The assumptions of regression are: 1)there is a population regression line,2)the dependent variable is normally distributed,3)the standard deviation of the response variable remains constant as the explanatory variables increase,and 4)the errors are probabilistically independent.
Unlock Deck
Unlock for access to all 87 flashcards in this deck.
Unlock Deck
k this deck
32
If you can determine that the outlier is not really a member of the relevant population,then it is appropriate and probably best to:
A)average it
B)reduce it
C)delete it
D)leave it
A)average it
B)reduce it
C)delete it
D)leave it
Unlock Deck
Unlock for access to all 87 flashcards in this deck.
Unlock Deck
k this deck
33
The _____ can be used to test for autocorrelation.
A)regression coefficient
B)correlation coefficient
C)Durbin-Watson statistic
D)F-test or t-test
A)regression coefficient
B)correlation coefficient
C)Durbin-Watson statistic
D)F-test or t-test
Unlock Deck
Unlock for access to all 87 flashcards in this deck.
Unlock Deck
k this deck
34
In time series data,errors are often not probabilistically independent.
Unlock Deck
Unlock for access to all 87 flashcards in this deck.
Unlock Deck
k this deck
35
The objective typically used in the tree types of equation-building procedures are to:
A)find the equation with a small se
B)find the equation with a large R2
C)find the equation with a small se and a large R2
D)find the equation with the largest F-statistic
A)find the equation with a small se
B)find the equation with a large R2
C)find the equation with a small se and a large R2
D)find the equation with the largest F-statistic
Unlock Deck
Unlock for access to all 87 flashcards in this deck.
Unlock Deck
k this deck
36
In regression analysis,homoscedasticity refers to constant error variance.
Unlock Deck
Unlock for access to all 87 flashcards in this deck.
Unlock Deck
k this deck
37
If exact multicollinearlity exists,that means that there is redundancy in the data.
Unlock Deck
Unlock for access to all 87 flashcards in this deck.
Unlock Deck
k this deck
38
If residuals separated by one period are autocorrelated,this is called:
A)simple autocorrelation
B)redundant autocorrelation
C)time 1 autocorrelation
D)lag 1 autocorrelation
A)simple autocorrelation
B)redundant autocorrelation
C)time 1 autocorrelation
D)lag 1 autocorrelation
Unlock Deck
Unlock for access to all 87 flashcards in this deck.
Unlock Deck
k this deck
39
A point that "tilts" the regression line toward it,is referred to as a(n):
A)magnetic point
B)influential point
C)extreme point
D)explanatory point
A)magnetic point
B)influential point
C)extreme point
D)explanatory point
Unlock Deck
Unlock for access to all 87 flashcards in this deck.
Unlock Deck
k this deck
40
Determining which variables to include in regression analysis by estimating a series of regression equations by successively adding or deleting variables according to prescribed rules is referred to as:
A)elimination regression
B)forward regression
C)backward regression
D)stepwise regression
A)elimination regression
B)forward regression
C)backward regression
D)stepwise regression
Unlock Deck
Unlock for access to all 87 flashcards in this deck.
Unlock Deck
k this deck
41
A backward procedure is a type of equation building procedure that begins with all potential explanatory variables in the regression equation and deletes them two at a time until further deletion would reduce the percentage of variation explained to a value less than 0.50.
Unlock Deck
Unlock for access to all 87 flashcards in this deck.
Unlock Deck
k this deck
42
In multiple regression,if there is multicollinearity between independent variables,the t-tests of the individual coefficients may indicate that some variables are not linearly related to the dependent variable,when in fact they are.
Unlock Deck
Unlock for access to all 87 flashcards in this deck.
Unlock Deck
k this deck
43
In regression analysis,the unexplained part of the total variation in the response variable Y is referred to as sum of squares due to regression,SSR.
Unlock Deck
Unlock for access to all 87 flashcards in this deck.
Unlock Deck
k this deck
44
In testing the overall fit of a multiple regression model in which there are three explanatory variables,the null hypothesis is .
. Unlock Deck
Unlock for access to all 87 flashcards in this deck.
Unlock Deck
k this deck
45
In multiple regressions,a large value of the test statistic F indicates that most of the variation in Y is unexplained by the regression equation and that the model is useless.A small value of F indicates that most of the variation in Y is explained by the regression equation and that the model is useful.
Unlock Deck
Unlock for access to all 87 flashcards in this deck.
Unlock Deck
k this deck
46
In a multiple regression analysis involving 4 explanatory variables and 40 data points,the degrees of freedom associated with the sum of squared errors,SSE,is 35.
Unlock Deck
Unlock for access to all 87 flashcards in this deck.
Unlock Deck
k this deck
47
Suppose that one equation has 3 explanatory variables and an F-ratio of 49.Another equation has 5 explanatory variables and an F-ratio of 38.The first equation will always be considered a better model.
Unlock Deck
Unlock for access to all 87 flashcards in this deck.
Unlock Deck
k this deck
48
In regression analysis,the total variation in the dependent variable Y,measured by and referred to as SST,can be decomposed into two parts: the explained variation,measured by SSR,and the unexplained variation,measured by SSE.
and referred to as SST,can be decomposed into two parts: the explained variation,measured by SSR,and the unexplained variation,measured by SSE. Unlock Deck
Unlock for access to all 87 flashcards in this deck.
Unlock Deck
k this deck
49
In order to test the significance of a multiple regression model involving 4 explanatory variables and 40 observations,the numerator and denominator degrees of freedom for the critical value of F are 4 and 35,respectively.
Unlock Deck
Unlock for access to all 87 flashcards in this deck.
Unlock Deck
k this deck
50
In a simple linear regression model,testing whether the slope of the population regression line could be zero is the same as testing whether or not the linear relationship between the response variable Y and the explanatory variable X is significant.
of the population regression line could be zero is the same as testing whether or not the linear relationship between the response variable Y and the explanatory variable X is significant. Unlock Deck
Unlock for access to all 87 flashcards in this deck.
Unlock Deck
k this deck
51
A multiple regression model involves 40 observations and 4 explanatory variables produces SST = 1000 and SSR = 804.The value of MSE is 5.6.
Unlock Deck
Unlock for access to all 87 flashcards in this deck.
Unlock Deck
k this deck
52
In a multiple regression problem involving 30 observations and four explanatory variables,SST = 800 and SSE = 240.The value of the F-statistic for testing the significance of this model is 14.583.
Unlock Deck
Unlock for access to all 87 flashcards in this deck.
Unlock Deck
k this deck
53
The residuals are observations of the error variable .Consequently,the minimized sum of squared deviations is called the sum of squared error,labeled SSE.
.Consequently,the minimized sum of squared deviations is called the sum of squared error,labeled SSE. Unlock Deck
Unlock for access to all 87 flashcards in this deck.
Unlock Deck
k this deck
54
In multiple regression,the problem of multicollinearity affects the t-tests of the individual coefficients as well as the F-test in the analysis of variance for regression,since the F-test combines these t-tests into a single test.
Unlock Deck
Unlock for access to all 87 flashcards in this deck.
Unlock Deck
k this deck
55
In simple linear regression,if the error variable is normally distributed,the test statistic for testing is t-distributed with n - 2 degrees of freedom.
is normally distributed,the test statistic for testing is t-distributed with n - 2 degrees of freedom. Unlock Deck
Unlock for access to all 87 flashcards in this deck.
Unlock Deck
k this deck
56
In a simple linear regression problem,if the standard error of estimate = 15 and n = 8,then the sum of squares for error,SSE,is 1,350.
= 15 and n = 8,then the sum of squares for error,SSE,is 1,350. Unlock Deck
Unlock for access to all 87 flashcards in this deck.
Unlock Deck
k this deck
57
When there is a group of explanatory variables that are in some sense logically related,all of them must be included in the regression equation.
Unlock Deck
Unlock for access to all 87 flashcards in this deck.
Unlock Deck
k this deck
58
Multicollinearity is a situation in which two or more of the explanatory variables are highly correlated with each other.
Unlock Deck
Unlock for access to all 87 flashcards in this deck.
Unlock Deck
k this deck
59
In multiple regression with k explanatory variables,the t-tests of the individual coefficients allows us to determine whether (for i = 1,2,….,k),which tells us whether a linear relationship exists between and Y.
(for i = 1,2,….,k),which tells us whether a linear relationship exists between and Y. Unlock Deck
Unlock for access to all 87 flashcards in this deck.
Unlock Deck
k this deck
60
The value of the sum of squares due to regression,SSR,can never be larger than the value of the sum of squares total,SST.
Unlock Deck
Unlock for access to all 87 flashcards in this deck.
Unlock Deck
k this deck
61
In order to estimate with 90% confidence a particular value of Y for a given value of X in a simple linear regression problem,a random sample of 20 observations is taken.The appropriate t-value that would be used is 1.734.
Unlock Deck
Unlock for access to all 87 flashcards in this deck.
Unlock Deck
k this deck
62
(A)Estimate a multiple regression model that includes the two given explanatory variables.Assess this set of explanatory variables with an F-test,and report a p-value.
(B)Conduct a partial F-test to decide whether it is worthwhile to add second-order terms (i.e., )to the multiple regression equation estimated in Question 114.Employ a 5% significance level in conducting this hypothesis test.
(C)Identify and interpret the percentage of variance explained for the model in (A).
(D)Identify and interpret the percentage of variance explained for the model in (B).
(E)Which regression equation is the most appropriate one for modeling the quality of the given product? Bear in mind that a good statistical model is usually parsimonious.
(B)Conduct a partial F-test to decide whether it is worthwhile to add second-order terms (i.e.,
)to the multiple regression equation estimated in Question 114.Employ a 5% significance level in conducting this hypothesis test.(C)Identify and interpret the percentage of variance explained for the model in (A).
(D)Identify and interpret the percentage of variance explained for the model in (B).
(E)Which regression equation is the most appropriate one for modeling the quality of the given product? Bear in mind that a good statistical model is usually parsimonious.
Unlock Deck
Unlock for access to all 87 flashcards in this deck.
Unlock Deck
k this deck
63
(A)Determine the least-squares multiple regression equation.
(B)Interpret the Y- intercept of the regression equation.
(C)Interpret the partial regression coefficients.
(D)What is the estimated number of new visitors to a club if the size of the ad is 6 column-inches and a $100 discount is offered?
(E)Determine the approximate 95% prediction interval for the number of new visitors to a given club when the ad is 5 column-inches and the discount is $80.
(F)What is the value for the percentage of variation explained,and exactly what does it indicate?
(G)At the 0.05 level,is the overall regression equation in (A)significant?
(H)Use the 0.05 level in concluding whether each partial regression coefficient differs significantly from zero.
(I Interpret the results of the preceding tests in (H)and (I)in the context of the two explanatory variables described in the problem.
(J)Construct a 95% confidence interval for each partial regression coefficient in the population regression equation.
Unlock Deck
Unlock for access to all 87 flashcards in this deck.
Unlock Deck
k this deck
64
(A)Estimate a multiple regression model for the data.
(B)Which of the variables in this model have regression coefficients that are statistically different from 0 at the 5% significance level?
(C)Given your findings in (B),which variables,if any,would you choose to remove from the model estimated in (A)? Explain your decision.
(B)Which of the variables in this model have regression coefficients that are statistically different from 0 at the 5% significance level?
(C)Given your findings in (B),which variables,if any,would you choose to remove from the model estimated in (A)? Explain your decision.
Unlock Deck
Unlock for access to all 87 flashcards in this deck.
Unlock Deck
k this deck
65
The Durbin-Watson statistic can be used to measure of autocorrelation.
Unlock Deck
Unlock for access to all 87 flashcards in this deck.
Unlock Deck
k this deck
66
(A)Summarize the findings of the stepwise regression method using this cutoff value.
(B)When the cutoff value was increased to 0.10,the output below was the result.The table at top left represents the change when the disposable income variable is added to the model and the table at top right represents the average price variable being added.The regression model with both added variables is shown in the bottom table.Summarize the results for this model.
(C)Which model would you recommend using? Why?
(B)When the cutoff value was increased to 0.10,the output below was the result.The table at top left represents the change when the disposable income variable is added to the model and the table at top right represents the average price variable being added.The regression model with both added variables is shown in the bottom table.Summarize the results for this model.
(C)Which model would you recommend using? Why? Unlock Deck
Unlock for access to all 87 flashcards in this deck.
Unlock Deck
k this deck
67
(A)Estimate a simple linear regression model using the sample data.How well does the estimated model fit the sample data?
(B)Perform an F-test for the existence of a linear relationship between Y and X.Use a 5% level of significance.
(C)Plot the fitted values versus residuals associated with the model in Question 119.What does the plot indicate?
(D)How do you explain the results you have found in (A)through (C)?
(E)Suppose you learn that the 10th employee in the sample has been fired for missing an excessive number of work-hours during the past year.In light of this information,how would you proceed to estimate the relationship between the number of work-hours an employee misses per year and the employee's annual wages,using the available information? If you decide to revise your estimate of this regression equation,repeat (A)and (B)
Unlock Deck
Unlock for access to all 87 flashcards in this deck.
Unlock Deck
k this deck
68
(A)Use the information related to the multiple regression model to determine whether each of the regression coefficients are statistically different from 0 at a 5% significance level.Summarize your findings.
(B)Test at the 5% significance level the relationship between Y and X in each of the simple linear regression models.How does this compare to your answer in (A)? Explain.
(C)Is there evidence of multicollinearity in this situation? Explain why or why not.
(B)Test at the 5% significance level the relationship between Y and X in each of the simple linear regression models.How does this compare to your answer in (A)? Explain.
(C)Is there evidence of multicollinearity in this situation? Explain why or why not.
Unlock Deck
Unlock for access to all 87 flashcards in this deck.
Unlock Deck
k this deck
69
Below you will find a scatterplot of data gathered by a mail-order company.The company has been able to obtain the annual salaries of their customers and the amount that each of these customers spent with the company in 1998.Based on the scatterplot below,would you conclude that these data meet all four assumptions of regression? Explain your answer.
Unlock Deck
Unlock for access to all 87 flashcards in this deck.
Unlock Deck
k this deck
70
A forward procedure is a type of equation building procedure that begins with only one explanatory variable in the regression equation and successively adds one variable at a time until no remaining variables make a significant contribution.
Unlock Deck
Unlock for access to all 87 flashcards in this deck.
Unlock Deck
k this deck
71
(A)Estimate the regression model.How well does this model fit the data?
(B)Is there a linear relationship between the explanatory variables and the dependent variable? Explain how you arrived at your answer at the 5% significance level.
(C)Use the estimated regression model to predict the amount of money a customer will spend if their annual salary is $45,000,they have 1 child and they were a customer that purchased merchandise in the previous year (2004).
(D)Find a 95% prediction interval for the point prediction calculated in (C).Use a t-multiple = 2.02.
(E)Find a 95% confidence interval for the amount of money spent by all customers sharing the characteristics described in (C).Use a t-multiple = 2.02.
(F)How do you explain the differences between the widths of the intervals in (D)and (E)?
Unlock Deck
Unlock for access to all 87 flashcards in this deck.
Unlock Deck
k this deck
72
One method of diagnosing heteroscedasticity is to plot the residuals against the predicted values of Y,then look for a change in the spread of the plotted values.
Unlock Deck
Unlock for access to all 87 flashcards in this deck.
Unlock Deck
k this deck
73
If the partial F test indicates that a group of variables is significant,it also implies that each variable in the group is significant.
Unlock Deck
Unlock for access to all 87 flashcards in this deck.
Unlock Deck
k this deck
74
(A)Estimate the regression model.How well does this model fit the given data?
(B)Yes,there is a linear relationship between the number of carpet installations and the number of building permits issued at a = 0.10; The p-value = 0.0866 for the F-statistic.You can conclude that there is a significant linear relationship between these two variables.
(C)The Durbin-Watson statistic for this data was 1.2183.Given this information what would you conclude about the data?
(D)Given your answer in (C),would you recommend modifying the original regression model? If so,how would you modify it?
Unlock Deck
Unlock for access to all 87 flashcards in this deck.
Unlock Deck
k this deck
75
(A)Estimate the regression model.How well does this model fit the given data?
(B)Is there a linear relationship between X and Y at the 5% significance level? Explain how you arrived at your answer.
(C)Use the estimated regression model to predict the number of caps that will be sold during the next month if the average selling price is $10.
(D)Find a 95% prediction interval for the number of caps determined in Question 90.Use t- multiple = 2.
(E)Find a 95% confidence interval for the average number of caps sold given an average selling price of $10.Use a t-multiple = 2.
(F)How do you explain the differences between the widths of the intervals in (D)and (E)?
Unlock Deck
Unlock for access to all 87 flashcards in this deck.
Unlock Deck
k this deck
76
The partial F test is a procedure to determine whether extra variables in a group provide any extra explanatory power in the regression equation
Unlock Deck
Unlock for access to all 87 flashcards in this deck.
Unlock Deck
k this deck
77
One of the potential characteristics of an outlier is that the value of the dependent variable is much larger or smaller than predicted by the regression line.
Unlock Deck
Unlock for access to all 87 flashcards in this deck.
Unlock Deck
k this deck
78
A confidence interval constructed around a point prediction from a regression model is called a prediction interval,because the actual point being estimated is not a population parameter
Unlock Deck
Unlock for access to all 87 flashcards in this deck.
Unlock Deck
k this deck
79
(A)Estimate the regression model.How well does this model fit the given data?
(B)Is there a linear relationship between the two explanatory variables and the dependent variable at the 5% significance level? Explain how you arrived at your answer.
(C)Use the estimated regression model to predict the annual maintenance expense of a truck that is driven 14,000 miles per year and is 5 years old.
(D)Find a 95% prediction interval for the maintenance expense determined in (C).Use a t-multiple = 2.
(E)Find a 95% confidence interval for the maintenance expense for all trucks sharing the characteristics provided in Question 96.Use a t-multiple = 2.
(F)How do you explain the differences between the widths of the intervals in (D)and (E)?
Unlock Deck
Unlock for access to all 87 flashcards in this deck.
Unlock Deck
k this deck
80
One method of dealing with heteroscedasticity is to try a logarithmic transformation of the data.
Unlock Deck
Unlock for access to all 87 flashcards in this deck.
Unlock Deck
k this deck
Unlock Deck
Unlock for access to all 87 flashcards in this deck.


