Deck 17: Quality Management
Full screen (f)
Question
Question
Question
Question
Question
Question
Question
Question
Question
Question
Question
Question
Question
Question
Question
Question
Question
Question
Question
Question
Question
Question
Question
Question
If you increase the size of the samples taken when using an  chart,it is necessary to recalculate your control limits because the limits will be narrower.
chart,it is necessary to recalculate your control limits because the limits will be narrower. Question
Question
Question
Question
Question
Question
Question
Question
Question
If you increase the size of the samples taken when using an  chart,it is necessary to recalculate your control limits because the limits will be wider.
chart,it is necessary to recalculate your control limits because the limits will be wider. Question
Question
Question
The upper and lower control limits of an  chart are typically set at plus or minus three standard errors from the centerline.
chart are typically set at plus or minus three standard errors from the centerline. Question
Question
Question
Question
Question
Question
Question
Question
Question
Question
Question
Question
Instability is most readily apparent on the:
A) chart.
B) R chart.
C) np chart.
D) I chart.
A)
chart.B) R chart.
C) np chart.
D) I chart.
Question
Question
Question
Question
Question
Question
Question
Question
Question
Question
Question
Question
Question
Question
Refer to the diagram below: 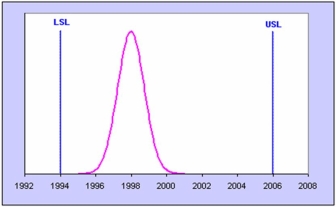 For this process,the Cp index would be:
A) less than one.
B) equal to one.
C) greater than one.
For this process,the Cp index would be:A) less than one.
B) equal to one.
C) greater than one.
Question
Ten samples of n = 5 were collected to construct an  chart.The sample mean and range for each sample are shown in the table below.
 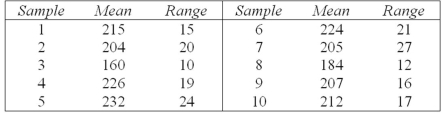 Calculate the empirical centerline for the R chart.
A) 20.8
B) 17.2
C) 18.1
D) 19.4
chart.The sample mean and range for each sample are shown in the table below. Calculate the empirical centerline for the R chart.A) 20.8
B) 17.2
C) 18.1
D) 19.4
Question
Question
Which is not a rule of thumb to indicate an out-of-control process on the  chart?
A) Single point outside three sigma
B) Three of four successive points outside two sigma on the same side of the centerline
C) Four of five successive points outside one sigma on the same side of the centerline
D) Nine successive points on the same side of the centerline
chart?A) Single point outside three sigma
B) Three of four successive points outside two sigma on the same side of the centerline
C) Four of five successive points outside one sigma on the same side of the centerline
D) Nine successive points on the same side of the centerline
Question
Question
Ten samples of n = 5 were collected to construct an  chart.The sample mean and range for each sample are shown in the table below.
  Calculate the empirical lower and upper control limits for the
  chart (you will need a table of control chart factors).
A) 196.46,217.34
B) 171.81,241.39
C) 188.03,225.17
D) 163.64,250.56
chart.The sample mean and range for each sample are shown in the table below. Calculate the empirical lower and upper control limits for the chart (you will need a table of control chart factors). A) 196.46,217.34
B) 171.81,241.39
C) 188.03,225.17
D) 163.64,250.56
Question
Question
Question
Professor Murphy wants to set up a control chart to monitor the percentage of absenteeism in his introductory statistics course (50 students are registered).Absences per period for the last 15 class sessions are in the table below.  Calculate the empirical centerline for a p-chart to track absences.
A) .068
B) .072
C) .146
D) .202
Calculate the empirical centerline for a p-chart to track absences.A) .068
B) .072
C) .146
D) .202
Question
Question
Question
If the specification subgroup size is n = 4 and the known process parameters are μ = 2.75 and σ = .044,the control limits for the  chart will be:
A) LCL = 2.684,UCL = 2.816.
B) LCL = 2.728,UCL = 2.772.
C) LCL = 2.618,UCL = 2.882.
D) LCL = 2.518,UCL = 2.998.
chart will be:A) LCL = 2.684,UCL = 2.816.
B) LCL = 2.728,UCL = 2.772.
C) LCL = 2.618,UCL = 2.882.
D) LCL = 2.518,UCL = 2.998.
Question
Question
Question
Question
Ten samples of n = 5 were collected to construct an  chart.The sample mean and range for each sample are shown in the table below.
  Calculate empirical lower and upper control limits for the R chart (you will need a table of control chart factors).
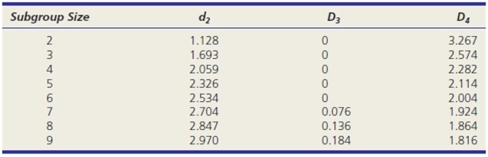
A) 0,45.86
B) 0,42.49
C) 0,38.26
D) 4.48,35.58
chart.The sample mean and range for each sample are shown in the table below. Calculate empirical lower and upper control limits for the R chart (you will need a table of control chart factors). A) 0,45.86
B) 0,42.49
C) 0,38.26
D) 4.48,35.58
Question
Question
Ten samples of n = 5 were collected to construct an  chart.The sample mean and range for each sample are shown in the table below.
  Calculate the empirical centerline for the
  chart.
A) 210.5
B) 206.9
C) 205.3
D) 208.2
chart.The sample mean and range for each sample are shown in the table below. Calculate the empirical centerline for the chart.A) 210.5
B) 206.9
C) 205.3
D) 208.2
Question

Unlock Deck
Sign up to unlock the cards in this deck!
Unlock Deck
Unlock Deck
1/103
Play
Full screen (f)
Deck 17: Quality Management
1
Quality control refers to methods used by organizations to ensure that their products and services meet customer expectations.
True
2
A major goal in statistical quality control is the reduction of variation in a process.
True
3
Deming stressed identifying the workers who contributed the most to poor quality.
False
4
Pareto charts show the frequency of problems that affect a process in descending order.
Unlock Deck
Unlock for access to all 103 flashcards in this deck.
Unlock Deck
k this deck
5
Process control charts were adopted by the Japanese after World War II.
Unlock Deck
Unlock for access to all 103 flashcards in this deck.
Unlock Deck
k this deck
6
The Cpk index may indicate a capable process even though the Cp index is unacceptable.
Unlock Deck
Unlock for access to all 103 flashcards in this deck.
Unlock Deck
k this deck
7
Statistical process control charts (SPC charts)are attributed to Shewhart.
Unlock Deck
Unlock for access to all 103 flashcards in this deck.
Unlock Deck
k this deck
8
An in-control process will always exhibit some common cause variation.
Unlock Deck
Unlock for access to all 103 flashcards in this deck.
Unlock Deck
k this deck
9
Control charts are used to monitor the quality of a product before it is produced.
Unlock Deck
Unlock for access to all 103 flashcards in this deck.
Unlock Deck
k this deck
10
An important attribute of quality is conformance to specifications.
Unlock Deck
Unlock for access to all 103 flashcards in this deck.
Unlock Deck
k this deck
11
The presence of common cause variation is an indication that the process is out of control.
Unlock Deck
Unlock for access to all 103 flashcards in this deck.
Unlock Deck
k this deck
12
ISO 9000 standards were first developed in the United States under the leadership of Joseph Juran.
Unlock Deck
Unlock for access to all 103 flashcards in this deck.
Unlock Deck
k this deck
13
A p-chart is a type of process control chart that can be used for plotting the proportion of nonconforming sampled items.
Unlock Deck
Unlock for access to all 103 flashcards in this deck.
Unlock Deck
k this deck
14
A process may be in a state of control even if one sample mean is more than two standard deviations above the centerline.
Unlock Deck
Unlock for access to all 103 flashcards in this deck.
Unlock Deck
k this deck
15
Special cause variation exists when the process produces observations that are not from the same population as the majority of the observations.
Unlock Deck
Unlock for access to all 103 flashcards in this deck.
Unlock Deck
k this deck
16
A moving range (MR)chart is appropriate to monitor variation when every single item is being inspected (n = 1)since the range (R)cannot be calculated.
Unlock Deck
Unlock for access to all 103 flashcards in this deck.
Unlock Deck
k this deck
17
Common cause variation does not indicate an out-of-control process.
Unlock Deck
Unlock for access to all 103 flashcards in this deck.
Unlock Deck
k this deck
18
ISO 9000 specifies quality processes rather than defect rates.
Unlock Deck
Unlock for access to all 103 flashcards in this deck.
Unlock Deck
k this deck
19
If a single sample mean is 2.1 standard deviations above the centerline,the process is not in control.
Unlock Deck
Unlock for access to all 103 flashcards in this deck.
Unlock Deck
k this deck
20
The Japanese invented and implemented quality control techniques prior to World War II.
Unlock Deck
Unlock for access to all 103 flashcards in this deck.
Unlock Deck
k this deck
21
Management wants a process to be in control and have a capability index at least equal to 1.33 (and ideally much more than 1.33).
Unlock Deck
Unlock for access to all 103 flashcards in this deck.
Unlock Deck
k this deck
22
If USL = 550,LSL = 540,μ = 545,and σ = 1.00,the Cp index is 1.67.
Unlock Deck
Unlock for access to all 103 flashcards in this deck.
Unlock Deck
k this deck
23
A p-chart is a type of process control chart that is used for plotting the number of defects per unit produced.
Unlock Deck
Unlock for access to all 103 flashcards in this deck.
Unlock Deck
k this deck
24
If you increase the size of the samples taken when using an chart,it is necessary to recalculate your control limits because the limits will be narrower.
chart,it is necessary to recalculate your control limits because the limits will be narrower. Unlock Deck
Unlock for access to all 103 flashcards in this deck.
Unlock Deck
k this deck
25
If USL = 550,LSL = 540,μ = 545,and σ = 0.4,the process is highly capable.
Unlock Deck
Unlock for access to all 103 flashcards in this deck.
Unlock Deck
k this deck
26
A control chart for the mean tells whether the product conforms to specifications.
Unlock Deck
Unlock for access to all 103 flashcards in this deck.
Unlock Deck
k this deck
27
Quality management is characterized by focus on the customer and continual improvement.
Unlock Deck
Unlock for access to all 103 flashcards in this deck.
Unlock Deck
k this deck
28
A process whose output distribution is stable over time is said to be in statistical control,regardless of whether the desired specifications are being met.
Unlock Deck
Unlock for access to all 103 flashcards in this deck.
Unlock Deck
k this deck
29
In statistical process control,the Cpk index measures the separate distances between the centerline μ and the USL and LSL.
Unlock Deck
Unlock for access to all 103 flashcards in this deck.
Unlock Deck
k this deck
30
The Cp index equals the Cpk index if USL = 550,LSL = 540,μ = 546,and σ = 1.25.
Unlock Deck
Unlock for access to all 103 flashcards in this deck.
Unlock Deck
k this deck
31
As a rule of thumb,if a process Cpk index is less than 1.00,the level of process capability is usually judged acceptable.
Unlock Deck
Unlock for access to all 103 flashcards in this deck.
Unlock Deck
k this deck
32
Deming thought that the majority of quality problems were traceable to faulty equipment.
Unlock Deck
Unlock for access to all 103 flashcards in this deck.
Unlock Deck
k this deck
33
If you increase the size of the samples taken when using an chart,it is necessary to recalculate your control limits because the limits will be wider.
chart,it is necessary to recalculate your control limits because the limits will be wider. Unlock Deck
Unlock for access to all 103 flashcards in this deck.
Unlock Deck
k this deck
34
In general terms,a capable process is one whose variability (σ)is small in relation to the distance between the centerline μ and the upper and lower specification limits.
Unlock Deck
Unlock for access to all 103 flashcards in this deck.
Unlock Deck
k this deck
35
If USL = 550,LSL = 540,μ = 545,and σ = 1.75,the process is highly capable.
Unlock Deck
Unlock for access to all 103 flashcards in this deck.
Unlock Deck
k this deck
36
The upper and lower control limits of an chart are typically set at plus or minus three standard errors from the centerline.
chart are typically set at plus or minus three standard errors from the centerline. Unlock Deck
Unlock for access to all 103 flashcards in this deck.
Unlock Deck
k this deck
37
Fishbone diagrams were developed for the Japanese fishing industry.
Unlock Deck
Unlock for access to all 103 flashcards in this deck.
Unlock Deck
k this deck
38
The Cp index equals the Cpk index if USL = 550,LSL = 540,μ = 545,and σ = 0.75.
Unlock Deck
Unlock for access to all 103 flashcards in this deck.
Unlock Deck
k this deck
39
The Cp index equals the Cpk index if USL = 550,LSL = 540,μ = 543,and σ = 0.75.
Unlock Deck
Unlock for access to all 103 flashcards in this deck.
Unlock Deck
k this deck
40
A c-chart is based on the Poisson distribution.
Unlock Deck
Unlock for access to all 103 flashcards in this deck.
Unlock Deck
k this deck
41
Which of the following is not a characteristic of Total Quality Management?
A) Employee empowerment
B) Reduction of waste
C) Continuous improvement
D) Reducing the Cp index
A) Employee empowerment
B) Reduction of waste
C) Continuous improvement
D) Reducing the Cp index
Unlock Deck
Unlock for access to all 103 flashcards in this deck.
Unlock Deck
k this deck
42
A slow drift of measurements either up or down from the process centerline suggests a:
A) mixed process.
B) trend.
C) instability.
D) cycle.
A) mixed process.
B) trend.
C) instability.
D) cycle.
Unlock Deck
Unlock for access to all 103 flashcards in this deck.
Unlock Deck
k this deck
43
Which is an appropriate step in continuous quality improvement?
A) Taking measurements on a variable and keeping careful records
B) Posting quality banners or company flags where they are visible to all
C) Castigating the lazy employees for their shoddy workmanship
D) Sending employees to Motivation Camp taught by expensive consultants
A) Taking measurements on a variable and keeping careful records
B) Posting quality banners or company flags where they are visible to all
C) Castigating the lazy employees for their shoddy workmanship
D) Sending employees to Motivation Camp taught by expensive consultants
Unlock Deck
Unlock for access to all 103 flashcards in this deck.
Unlock Deck
k this deck
44
Instability in a process is indicated when samples:
A) tend to alternate between high and low values.
B) drift slowly either upward or downward.
C) vary more than expected.
D) shift abruptly either above or below the centerline.
A) tend to alternate between high and low values.
B) drift slowly either upward or downward.
C) vary more than expected.
D) shift abruptly either above or below the centerline.
Unlock Deck
Unlock for access to all 103 flashcards in this deck.
Unlock Deck
k this deck
45
Attribute control charts would not be used to display the:
A) proportion of nonconforming parts.
B) sample range for a measured variable.
C) total number nonconforming parts.
D) average number of nonconforming parts.
A) proportion of nonconforming parts.
B) sample range for a measured variable.
C) total number nonconforming parts.
D) average number of nonconforming parts.
Unlock Deck
Unlock for access to all 103 flashcards in this deck.
Unlock Deck
k this deck
46
A level shift in a process is indicated when samples:
A) tend to alternate between high and low values.
B) drift slowly either upward or downward.
C) vary more than expected.
D) shift abruptly to a new mean.
A) tend to alternate between high and low values.
B) drift slowly either upward or downward.
C) vary more than expected.
D) shift abruptly to a new mean.
Unlock Deck
Unlock for access to all 103 flashcards in this deck.
Unlock Deck
k this deck
47
__________ and ___________ are well known for their statistical work related to customer satisfaction and the cost of quality.
A) Deming and Shewhart
B) Harold and Kumar
C) Dodge and Romig
D) Taguchi and Ishikawa
A) Deming and Shewhart
B) Harold and Kumar
C) Dodge and Romig
D) Taguchi and Ishikawa
Unlock Deck
Unlock for access to all 103 flashcards in this deck.
Unlock Deck
k this deck
48
Instability is most readily apparent on the:
A) chart.
B) R chart.
C) np chart.
D) I chart.
A)
chart.B) R chart.
C) np chart.
D) I chart.
Unlock Deck
Unlock for access to all 103 flashcards in this deck.
Unlock Deck
k this deck
49
Which of the following is most likely the cause of a level shift in a SPC chart?
A) Tool wear
B) A new worker
C) Temperature fluctuations
D) Alternating samples from two machines
A) Tool wear
B) A new worker
C) Temperature fluctuations
D) Alternating samples from two machines
Unlock Deck
Unlock for access to all 103 flashcards in this deck.
Unlock Deck
k this deck
50
Quality is ultimately best assessed by:
A) trained statisticians.
B) quality control inspectors.
C) management.
D) customers.
A) trained statisticians.
B) quality control inspectors.
C) management.
D) customers.
Unlock Deck
Unlock for access to all 103 flashcards in this deck.
Unlock Deck
k this deck
51
The problem that is probably the hardest to identify from a control chart is:
A) mixture.
B) oscillation.
C) cycle.
D) trend.
A) mixture.
B) oscillation.
C) cycle.
D) trend.
Unlock Deck
Unlock for access to all 103 flashcards in this deck.
Unlock Deck
k this deck
52
Quality experts would probably not recommend:
A) reducing variation.
B) using control charts.
C) placing blame for poor work.
D) identifying sources of variation.
A) reducing variation.
B) using control charts.
C) placing blame for poor work.
D) identifying sources of variation.
Unlock Deck
Unlock for access to all 103 flashcards in this deck.
Unlock Deck
k this deck
53
Which is not a tool of statistical quality control?
A) Fishbone diagram
B) Pareto chart
C) Attribute control chart
D) Deming chart
A) Fishbone diagram
B) Pareto chart
C) Attribute control chart
D) Deming chart
Unlock Deck
Unlock for access to all 103 flashcards in this deck.
Unlock Deck
k this deck
54
Control charts (SPC charts)are attributed to:
A) Deming.
B) Shewhart.
C) Juran.
D) Taguchi.
A) Deming.
B) Shewhart.
C) Juran.
D) Taguchi.
Unlock Deck
Unlock for access to all 103 flashcards in this deck.
Unlock Deck
k this deck
55
Walter Shewhart was an American who studied the control charts that the Japanese had invented after World War II and brought those methods back to the United States during the 1980s.
Unlock Deck
Unlock for access to all 103 flashcards in this deck.
Unlock Deck
k this deck
56
Control charts were an innovation attributed to:
A) Deming in the 1950s.
B) Shewhart in the 1920s.
C) Westinghouse in the 1960s.
D) Pacioli in the 1490s.
A) Deming in the 1950s.
B) Shewhart in the 1920s.
C) Westinghouse in the 1960s.
D) Pacioli in the 1490s.
Unlock Deck
Unlock for access to all 103 flashcards in this deck.
Unlock Deck
k this deck
57
In statistical process control,control charts are used to ensure that a process is stable and in control by detecting special cause variation.
Unlock Deck
Unlock for access to all 103 flashcards in this deck.
Unlock Deck
k this deck
58
Likely reasons for inaccurate control limits would include which of the following?
A) The engineering parameter for variance is unknown.
B) The engineers were underpaid for their work.
C) There was insufficient preliminary sampling.
D) Process variation was not zero,as expected.
A) The engineering parameter for variance is unknown.
B) The engineers were underpaid for their work.
C) There was insufficient preliminary sampling.
D) Process variation was not zero,as expected.
Unlock Deck
Unlock for access to all 103 flashcards in this deck.
Unlock Deck
k this deck
59
Which is not a true statement about the life and philosophy of W.Edwards Deming?
A) He taught quality control techniques to Japanese companies during the 1950s.
B) He lived a very long life and was a highly paid consultant past age 80.
C) He invented control charts and proposed the ISO 9000 standard.
D) He believed that poor quality is not primarily the fault of the workers.
A) He taught quality control techniques to Japanese companies during the 1950s.
B) He lived a very long life and was a highly paid consultant past age 80.
C) He invented control charts and proposed the ISO 9000 standard.
D) He believed that poor quality is not primarily the fault of the workers.
Unlock Deck
Unlock for access to all 103 flashcards in this deck.
Unlock Deck
k this deck
60
The R chart is likely to reveal which problem?
A) Instability
B) Cycles
C) Level shift
D) Trend
A) Instability
B) Cycles
C) Level shift
D) Trend
Unlock Deck
Unlock for access to all 103 flashcards in this deck.
Unlock Deck
k this deck
61
Statistical process control charts can measure:
A) the stability of the process.
B) the capability of a process.
C) both stability and capability.
A) the stability of the process.
B) the capability of a process.
C) both stability and capability.
Unlock Deck
Unlock for access to all 103 flashcards in this deck.
Unlock Deck
k this deck
62
Refer to the diagram below: For this process,the Cp index would be:
A) less than one.
B) equal to one.
C) greater than one.
For this process,the Cp index would be:A) less than one.
B) equal to one.
C) greater than one.
Unlock Deck
Unlock for access to all 103 flashcards in this deck.
Unlock Deck
k this deck
63
Ten samples of n = 5 were collected to construct an chart.The sample mean and range for each sample are shown in the table below. Calculate the empirical centerline for the R chart.
A) 20.8
B) 17.2
C) 18.1
D) 19.4
chart.The sample mean and range for each sample are shown in the table below. Calculate the empirical centerline for the R chart.A) 20.8
B) 17.2
C) 18.1
D) 19.4
Unlock Deck
Unlock for access to all 103 flashcards in this deck.
Unlock Deck
k this deck
64
Find the Cpk index for a process with USL = 550,LSL = 540,μ = 543,and σ = 0.75.
A) 1.33
B) 2.22
C) 1.25
D) 1.75
A) 1.33
B) 2.22
C) 1.25
D) 1.75
Unlock Deck
Unlock for access to all 103 flashcards in this deck.
Unlock Deck
k this deck
65
Which is not a rule of thumb to indicate an out-of-control process on the chart?
A) Single point outside three sigma
B) Three of four successive points outside two sigma on the same side of the centerline
C) Four of five successive points outside one sigma on the same side of the centerline
D) Nine successive points on the same side of the centerline
chart?A) Single point outside three sigma
B) Three of four successive points outside two sigma on the same side of the centerline
C) Four of five successive points outside one sigma on the same side of the centerline
D) Nine successive points on the same side of the centerline
Unlock Deck
Unlock for access to all 103 flashcards in this deck.
Unlock Deck
k this deck
66
Find the Cp index for a process with USL = 550,LSL = 540,μ = 543,and σ = 0.75.
A) 1.25
B) 1.33
C) 2.22
D) 1.75
A) 1.25
B) 1.33
C) 2.22
D) 1.75
Unlock Deck
Unlock for access to all 103 flashcards in this deck.
Unlock Deck
k this deck
67
Ten samples of n = 5 were collected to construct an chart.The sample mean and range for each sample are shown in the table below. Calculate the empirical lower and upper control limits for the chart (you will need a table of control chart factors).
A) 196.46,217.34
B) 171.81,241.39
C) 188.03,225.17
D) 163.64,250.56
chart.The sample mean and range for each sample are shown in the table below. Calculate the empirical lower and upper control limits for the chart (you will need a table of control chart factors). A) 196.46,217.34
B) 171.81,241.39
C) 188.03,225.17
D) 163.64,250.56
Unlock Deck
Unlock for access to all 103 flashcards in this deck.
Unlock Deck
k this deck
68
Which statistician developed the 14 Points of Quality?
A) Juran
B) Deming
C) Taguchi
D) Ishikawa
A) Juran
B) Deming
C) Taguchi
D) Ishikawa
Unlock Deck
Unlock for access to all 103 flashcards in this deck.
Unlock Deck
k this deck
69
Which is not a characteristic of a p-chart?
A) It shows the number of defects per item being inspected.
B) It measures the fraction of nonconforming items in a sample.
C) It is based on the binomial distribution (or its normal approximation).
D) It will have varying control limits if the sample size is changing.
A) It shows the number of defects per item being inspected.
B) It measures the fraction of nonconforming items in a sample.
C) It is based on the binomial distribution (or its normal approximation).
D) It will have varying control limits if the sample size is changing.
Unlock Deck
Unlock for access to all 103 flashcards in this deck.
Unlock Deck
k this deck
70
Professor Murphy wants to set up a control chart to monitor the percentage of absenteeism in his introductory statistics course (50 students are registered).Absences per period for the last 15 class sessions are in the table below. Calculate the empirical centerline for a p-chart to track absences.
A) .068
B) .072
C) .146
D) .202
Calculate the empirical centerline for a p-chart to track absences.A) .068
B) .072
C) .146
D) .202
Unlock Deck
Unlock for access to all 103 flashcards in this deck.
Unlock Deck
k this deck
71
Which is not a characteristic of instability?
A) Larger than normal amount of variation
B) Higher-than-expected frequencies in tails of the distribution of means
C) Often caused by untrained operators
D) Specification limits that are too narrow
A) Larger than normal amount of variation
B) Higher-than-expected frequencies in tails of the distribution of means
C) Often caused by untrained operators
D) Specification limits that are too narrow
Unlock Deck
Unlock for access to all 103 flashcards in this deck.
Unlock Deck
k this deck
72
Which is not characteristic of a trend?
A) Variance is essentially unchanged from sample to sample.
B) It is often due to mixing two batches of materials.
C) It is detectable on a control chart if enough samples are taken.
D) Rules of thumb can be established to detect it.
A) Variance is essentially unchanged from sample to sample.
B) It is often due to mixing two batches of materials.
C) It is detectable on a control chart if enough samples are taken.
D) Rules of thumb can be established to detect it.
Unlock Deck
Unlock for access to all 103 flashcards in this deck.
Unlock Deck
k this deck
73
If the specification subgroup size is n = 4 and the known process parameters are μ = 2.75 and σ = .044,the control limits for the chart will be:
A) LCL = 2.684,UCL = 2.816.
B) LCL = 2.728,UCL = 2.772.
C) LCL = 2.618,UCL = 2.882.
D) LCL = 2.518,UCL = 2.998.
chart will be:A) LCL = 2.684,UCL = 2.816.
B) LCL = 2.728,UCL = 2.772.
C) LCL = 2.618,UCL = 2.882.
D) LCL = 2.518,UCL = 2.998.
Unlock Deck
Unlock for access to all 103 flashcards in this deck.
Unlock Deck
k this deck
74
Find the Cp index for a process with USL = 550,LSL = 540,μ = 545,and σ = 0.75.
A) 1.25
B) 1.33
C) 2.22
D) 1.75
A) 1.25
B) 1.33
C) 2.22
D) 1.75
Unlock Deck
Unlock for access to all 103 flashcards in this deck.
Unlock Deck
k this deck
75
Find the Cpk index for a process with USL = 550,LSL = 540,μ = 545,and σ = 0.75.
A) 1.33
B) 2.22
C) 1.25
D) 1.75
A) 1.33
B) 2.22
C) 1.25
D) 1.75
Unlock Deck
Unlock for access to all 103 flashcards in this deck.
Unlock Deck
k this deck
76
Find the Cpk index for a process with USL = 550,LSL = 540,μ = 544,and σ = 1.25.
A) 1.33
B) 2.22
C) 1.07
D) 1.75
A) 1.33
B) 2.22
C) 1.07
D) 1.75
Unlock Deck
Unlock for access to all 103 flashcards in this deck.
Unlock Deck
k this deck
77
Ten samples of n = 5 were collected to construct an chart.The sample mean and range for each sample are shown in the table below. Calculate empirical lower and upper control limits for the R chart (you will need a table of control chart factors).
A) 0,45.86
B) 0,42.49
C) 0,38.26
D) 4.48,35.58
chart.The sample mean and range for each sample are shown in the table below. Calculate empirical lower and upper control limits for the R chart (you will need a table of control chart factors). A) 0,45.86
B) 0,42.49
C) 0,38.26
D) 4.48,35.58
Unlock Deck
Unlock for access to all 103 flashcards in this deck.
Unlock Deck
k this deck
78
In manufacturing,if workers readjust the equipment after each sample,it would typically:
A) increase variation.
B) decrease variation.
C) widen the specification limits.
D) improve conformance to specifications.
A) increase variation.
B) decrease variation.
C) widen the specification limits.
D) improve conformance to specifications.
Unlock Deck
Unlock for access to all 103 flashcards in this deck.
Unlock Deck
k this deck
79
Ten samples of n = 5 were collected to construct an chart.The sample mean and range for each sample are shown in the table below. Calculate the empirical centerline for the chart.
A) 210.5
B) 206.9
C) 205.3
D) 208.2
chart.The sample mean and range for each sample are shown in the table below. Calculate the empirical centerline for the chart.A) 210.5
B) 206.9
C) 205.3
D) 208.2
Unlock Deck
Unlock for access to all 103 flashcards in this deck.
Unlock Deck
k this deck
80
Is a process capable if USL = 550,LSL = 540,μ = 542,and σ = 1.25?
A) No,clearly not
B) No,but very close
C) Yes,just barely
D) Yes,highly capable
A) No,clearly not
B) No,but very close
C) Yes,just barely
D) Yes,highly capable
Unlock Deck
Unlock for access to all 103 flashcards in this deck.
Unlock Deck
k this deck
Unlock Deck
Unlock for access to all 103 flashcards in this deck.


