Deck 1: Looking at Datadistributions
Full screen (f)
Question
Question
Question
Question
Question
Question
Question
Question
Question
Question
Question
Question
Question
Question
Below is a data set with information on students in a basic statistics class at a local university.Are there any striking deviations from the overall pattern for the quantitative variable in the data set? 
A)No,the data follow the same pattern.
B)Yes,there is an outlier.
C)Too few data points to determine
D)None of the above.
A)No,the data follow the same pattern.
B)Yes,there is an outlier.
C)Too few data points to determine
D)None of the above.
Question
Question
Question
Below is a data set with information on students in a basic statistics class at a local university.What is a key characteristic of the data set? 
A)There are 10 students in the data set.
B)The data describe students in a class.
C)There are three variables in the data set.
D)All of the above
A)There are 10 students in the data set.
B)The data describe students in a class.
C)There are three variables in the data set.
D)All of the above
Question
Question
Below is a data set with information on students in a basic statistics class at a local university.Which variable is the label? 
A)Student ID
B)GPA
C)Hometown
D)Major
A)Student ID
B)GPA
C)Hometown
D)Major
Question
Question
Question
The histogram below shows data from 30 students who were asked,"How much time do you spend on the Internet in minutes?" What are some features about the data? 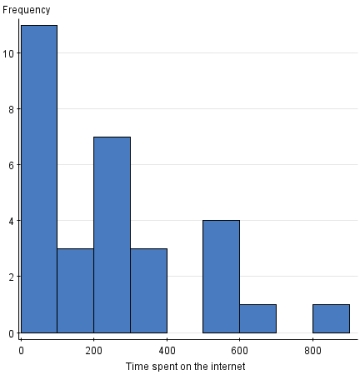
A)There is a potential outlier.
B)Most values are around 800.
C)The range of values is between 0 and 400.
D)None of the above
A)There is a potential outlier.
B)Most values are around 800.
C)The range of values is between 0 and 400.
D)None of the above
Question
The histogram below shows data from 30 students who were asked,"How much time do you spend on the Internet in minutes?" How could you improve the histogram to better display the distribution? 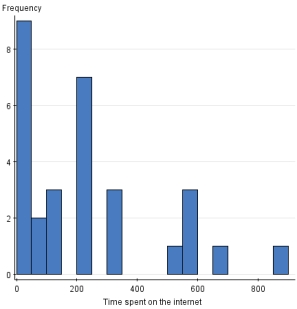
A)Increase the class size.
B)Decrease the class size.
C)Do nothing-the histogram is appropriate.
D)Add two more data points.
A)Increase the class size.
B)Decrease the class size.
C)Do nothing-the histogram is appropriate.
D)Add two more data points.
Question
Thirty students were asked,"How much time did you spend studying for the last quiz?" The histograms below were all used on the same data;however,the class size was changed for each one.Which histogram below best displays the data?
A)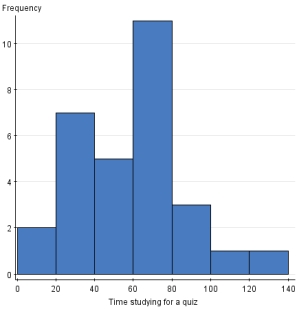
B)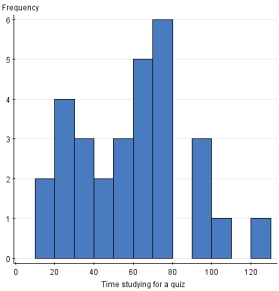
C)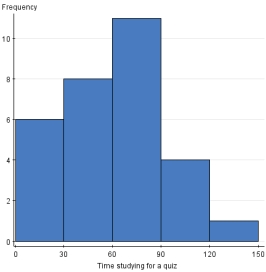
D)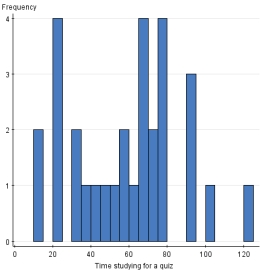
A)
B)
C)
D)
Question
Question
Question
Question
Question
Question
Question
Question
Question
Question
Question
Question
Question
Question
Question
Question
Question
A distributor of electronics is doing a customer satisfaction survey for a manufacturer of tablet computers.A sample of 68 clients is asked to rate a particular tablet on appearance,functionality,ease of use,and price on a scale of 1 to 10,where 1 corresponds to the worst rating and 10 to the best possible rating.A bar graph of the ease of use ratings classified by gender is given below. 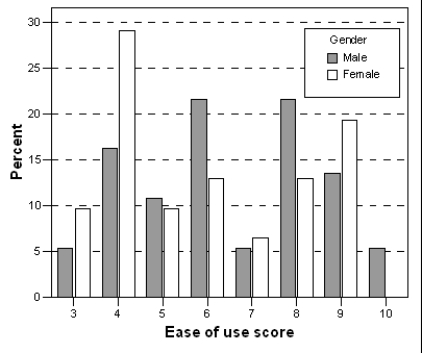 What percentage of the sampled female clients rated the tablet as not so easy to use (a rating of 4 or lower)?
A)28%
B)29%
C)38%
D)62%
What percentage of the sampled female clients rated the tablet as not so easy to use (a rating of 4 or lower)?A)28%
B)29%
C)38%
D)62%
Question
The Consumers Union measured the gas mileage in miles per gallon of 38 automobiles from the 1978-1979 model-year on a special test track.The pie chart below provides information about the country of manufacture of the automobiles used in this study by the Consumers Union. 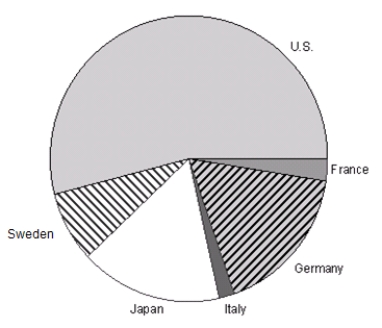 Which of the following bar graphs represents the same data as in the pie chart?
A)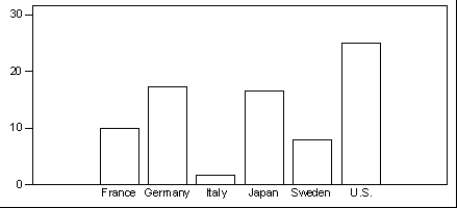
B)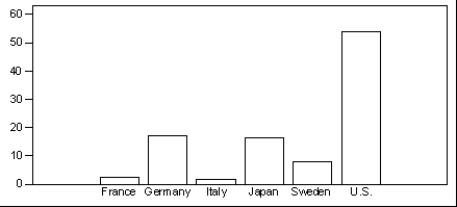
C)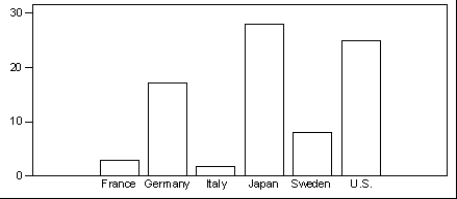
D)
Which of the following bar graphs represents the same data as in the pie chart?A)
B)
C)
D)
Question
Question
During the early part of the 1994 baseball season,many sports fans and baseball players noticed that the number of home runs being hit seemed to be unusually large.Below are separate stemplots for the number of home runs by American League and National League teams based on the team-by-team statistics on home runs hit through Friday,June 3,1994 (from the Columbus Dispatch,Sunday,June 5,1994). 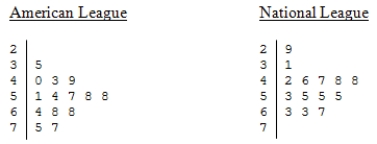 Legend: 2|9 represents 29. What is the mean for the number of home runs for the National League teams?
A)45
B)50
C)50.1
D)57.5
Legend: 2|9 represents 29. What is the mean for the number of home runs for the National League teams?A)45
B)50
C)50.1
D)57.5
Question
A study is being conducted on air quality at a small college in the South.As part of this study,monitors were posted at every entrance to this college from 6:00 a.m.to 10:00 p.m.on a randomly chosen day.The monitors recorded the mode of transportation used by each person as they entered the campus.Based on the information recorded,the following bar graph was constructed.  If 1200 people entered campus on this particular day, (approximately)how many people arrived by bus?
A)10
B)100
C)120
D)135
If 1200 people entered campus on this particular day, (approximately)how many people arrived by bus?A)10
B)100
C)120
D)135
Question
A sample of employees of a large pharmaceutical company has been obtained.The length of time (in months)they have worked for the company was recorded for each employee.A stemplot of these data is shown below.In the stemplot 6|2 represents 62 months. 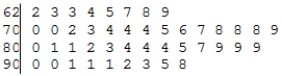 What would be a better way to represent this data set?
A)Display the data in a time plot.
B)Display the data in a boxplot.
C)Split the stems.
D)Use a histogram with class width equal to 10.
What would be a better way to represent this data set?A)Display the data in a time plot.
B)Display the data in a boxplot.
C)Split the stems.
D)Use a histogram with class width equal to 10.
Question
In a statistics class with 136 students,the professor records how much money each student has in their possession during the first class of the semester.The histogram shown below represents the data he collected.  What is approximately the number of students with $30 or more in their possession?
A)Less than 5
B)About 10
C)About 30
D)More than 100
What is approximately the number of students with $30 or more in their possession?A)Less than 5
B)About 10
C)About 30
D)More than 100
Question
Data are collected from 1100 randomly selected students who graduated between 2005 and 2008 from the University of Florida.A pie chart of the departments in the school/college from which the 1100 sampled students graduated is shown below. 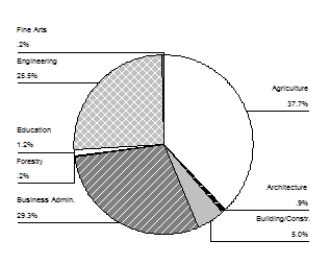 Based on the graph, (approximately)how many of the sampled students graduated with a degree in Building/Construction or Architecture?
A)55
B)59
C)65
D)99
Based on the graph, (approximately)how many of the sampled students graduated with a degree in Building/Construction or Architecture?A)55
B)59
C)65
D)99
Question
A consumer agency is testing appliances for a series of articles in their magazine.Currently they are working with cooktops and ranges.They have selected 16 of the most commonly used models.Using a series of tests,the agency will estimate the lifetime of these models.A histogram of these (estimated)lifetimes is shown below.  What is the proportion of these appliances that is estimated to last longer than 15 years?
A)More than half
B)Less than half
C)Equal to 4/16 = 0.25
D)It cannot be determined from this graph.
What is the proportion of these appliances that is estimated to last longer than 15 years?A)More than half
B)Less than half
C)Equal to 4/16 = 0.25
D)It cannot be determined from this graph.
Question
During the early part of the 1994 baseball season,many sports fans and baseball players noticed that the number of home runs being hit seemed to be unusually large.Below are separate stemplots for the number of home runs by American League and National League teams based on the team-by-team statistics on home runs hit through Friday,June 3,1994 (from the Columbus Dispatch,Sunday,June 5,1994).  Legend: 2|9 represents 29. What is the median for the number of home runs for the American League teams?
A)45
B)50
C)50.5
D)57.5
Legend: 2|9 represents 29. What is the median for the number of home runs for the American League teams?A)45
B)50
C)50.5
D)57.5
Question
During the early part of the 1994 baseball season,many sports fans and baseball players noticed that the number of home runs being hit seemed to be unusually large.Below are separate stemplots for the number of home runs by American League and National League teams based on the team-by-team statistics on home runs hit through Friday,June 3,1994 (from the Columbus Dispatch,Sunday,June 5,1994).  Legend: 2|9 represents 29. What is the maximum number of home runs from a National League team?
A)7
B)70
C)67
D)48
Legend: 2|9 represents 29. What is the maximum number of home runs from a National League team?A)7
B)70
C)67
D)48
Question
In a statistics class with 136 students,the professor records how much money each student has in their possession during the first class of the semester.The histogram shown below represents the data he collected. 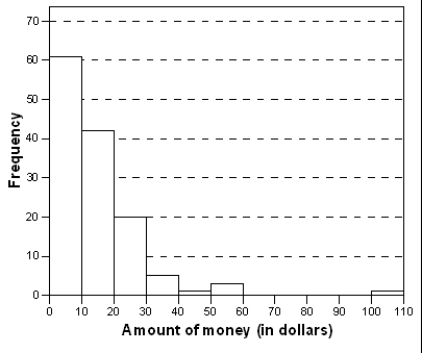 What is approximately the percentage of students with under $10 in their possession?
A)35%
B)40%
C)44%
D)50%
What is approximately the percentage of students with under $10 in their possession?A)35%
B)40%
C)44%
D)50%
Question
A consumer agency is testing appliances for a series of articles in their magazine.Currently they are working with cooktops and ranges.They have selected 16 of the most commonly used models.Using a series of tests,the agency will estimate the lifetime of these models.A histogram of these (estimated)lifetimes is shown below. 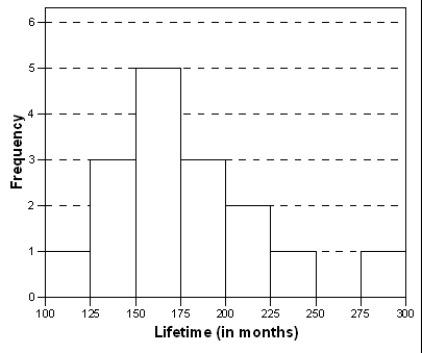 Select all correct descriptions for the shape of the histogram of the estimated lifetimes of these 16 appliances.
A)Symmetric
B)Unimodal
C)Skewed right
D)Skewed left
Select all correct descriptions for the shape of the histogram of the estimated lifetimes of these 16 appliances.A)Symmetric
B)Unimodal
C)Skewed right
D)Skewed left
Question
The histogram below represents the height (in inches)of the gold medal-winning high jumps for the Olympic Games up to Sydney 2000.  What is approximately the percentage of these winning jumps that were at least 7 feet and1 inch high (85 inches)?
A)9%
B)14%
C)23%
D)35%
What is approximately the percentage of these winning jumps that were at least 7 feet and1 inch high (85 inches)?A)9%
B)14%
C)23%
D)35%
Question
Question
The histogram below represents the height (in inches)of the gold medal-winning high jumps for the Olympic Games up to Sydney 2000. 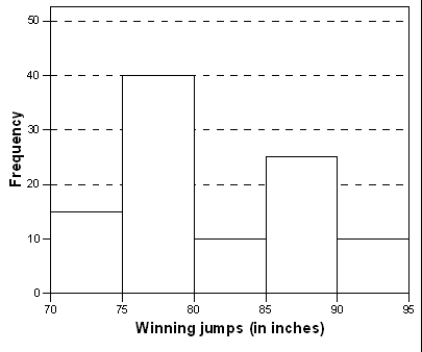 What is approximately the mean height?
A)75 inches
B)77.5 inches
C)82 inches
D)90 inches
What is approximately the mean height?A)75 inches
B)77.5 inches
C)82 inches
D)90 inches
Question
A study is being conducted on air quality at a small college in the South.As part of this study,monitors were posted at every entrance to this college from 6:00 a.m.to 10:00 p.m.on a randomly chosen day.The monitors recorded the mode of transportation used by each person as they entered the campus.Based on the information recorded,the following bar graph was constructed. 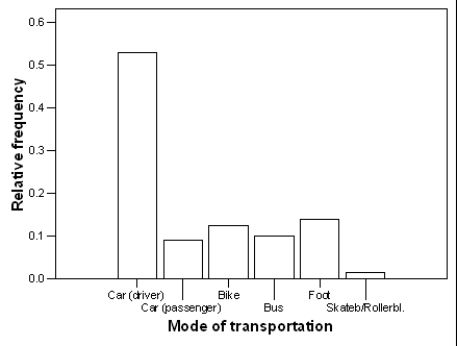 Approximately what percentage of people entering campus on this particular day arrived by car?
A)9%
B)31%
C)53%
D)62%
Approximately what percentage of people entering campus on this particular day arrived by car?A)9%
B)31%
C)53%
D)62%
Question
The timeplot below gives the number of burglaries committed each month for a city in Ohio.The plot is for the three-year period of January 1987 to December 1989.  What is approximately the number of burglaries in December 1989,the last date recorded in the timeplot?
A)22
B)27
C)32
D)37
What is approximately the number of burglaries in December 1989,the last date recorded in the timeplot?A)22
B)27
C)32
D)37
Question
Question
The pie chart provides information on all the majors at a university. 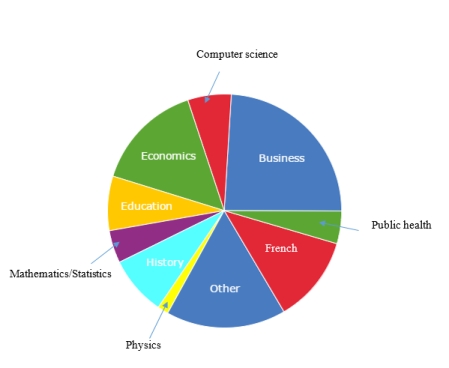 What conclusion can we draw based on this pie chart?
A)The most popular major is in the "Other" category and therefore not shown.
B)More than half of the students at this university are majoring in Public Health,French,Business,Computer Science,or Economics.
C)More students are majoring in Education than in French.
D)The smallest major is Mathematics/Statistics.
What conclusion can we draw based on this pie chart?A)The most popular major is in the "Other" category and therefore not shown.
B)More than half of the students at this university are majoring in Public Health,French,Business,Computer Science,or Economics.
C)More students are majoring in Education than in French.
D)The smallest major is Mathematics/Statistics.
Question
The World Malaria Report (2008)has information on the number of reported malaria cases from 2005 and 2006 for the 10 countries listed in West Africa.The data are presented in the table below.  The median of the reported malaria cases in 2005 is _________.
A)less than 1,000,000
B)less than 200,000
C)100,000
D)3,000,000
The median of the reported malaria cases in 2005 is _________.A)less than 1,000,000
B)less than 200,000
C)100,000
D)3,000,000
Question
The World Malaria Report (2008)has information on the number of reported malaria cases from 2005 and 2006 for the 10 countries listed in West Africa.The data are presented in the table below.  The mean of the reported West African malaria cases in 2005 is ___________.
A)less than 116,698
B)greater than 1,600,000
C)100,000
D)greater than 200,000
The mean of the reported West African malaria cases in 2005 is ___________.A)less than 116,698
B)greater than 1,600,000
C)100,000
D)greater than 200,000
Question
Malaria is a leading cause of infectious disease and death worldwide.The table below represents the mean number of reported malaria cases (between 1996 and 2006)for each of 10 West African countries,as published in the journal Statistica Neerlandica in 2010.  What is the best method to display these data?
A)Histogram
B)Pie chart
C)Bar graph
D)Stem-and-leaf plot
What is the best method to display these data?A)Histogram
B)Pie chart
C)Bar graph
D)Stem-and-leaf plot
Question
The World Malaria Report (2008)has information on the number of reported malaria cases from 2005 and 2006 for the 10 countries listed in West Africa.The data are presented in the table below.  The mean number of malaria cases in 2006 is probably ______.
A)higher than in 2005
B)lower than in 2005
C)exactly the same as in 2005
The mean number of malaria cases in 2006 is probably ______.A)higher than in 2005
B)lower than in 2005
C)exactly the same as in 2005
Question
Question
Malaria is a leading cause of infectious disease and death worldwide.The table below represents the mean number of reported malaria cases (between 1996 and 2006)for each of 10 West African countries,as published in the journal Statistica Neerlandica in 2010.  True or False.The variable "country" is a quantitative variable.
True or False.The variable "country" is a quantitative variable. Question
Question
Question
The World Malaria Report (2008)has information on the number of reported malaria cases from 2005 and 2006 for the 10 countries listed in West Africa.The data are presented in the table below.  The mean of the reported West African malaria cases in 2006 is ___________.
A)around 1,000,000
B)less than 200,000
C)100,000
D)3,000,000
The mean of the reported West African malaria cases in 2006 is ___________.A)around 1,000,000
B)less than 200,000
C)100,000
D)3,000,000
Question
The World Malaria Report (2008)has information on the number of reported malaria cases from 2005 and 2006 for the 10 countries listed in West Africa.The data are presented in the table below.  If the number of reported malaria cases in Ghana in 2005 were mistyped and reported as 30,452,969,what would happen to the mean and median?
A)Both would remain unchanged.
B)The mean would change,but the median would stay the same.
C)The mean and median would change.
D)You cannot tell without doing the actual calculation.
If the number of reported malaria cases in Ghana in 2005 were mistyped and reported as 30,452,969,what would happen to the mean and median?A)Both would remain unchanged.
B)The mean would change,but the median would stay the same.
C)The mean and median would change.
D)You cannot tell without doing the actual calculation.
Question
Question
Statistics were gathered on the number of homicides committed with guns in Australia in the years from 1980 to 2004.From these data the following graph was constructed. 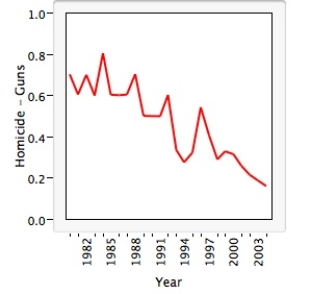 This plot is a graph of a(n)_____________,and it shows that there is/are ___________ in the data.
A)categorical variable;skewness to the right
B)histogram;multiple peaks
C)line;an increasing trend
D)quantitative variable;outlier values
E)time series;a decreasing trend
This plot is a graph of a(n)_____________,and it shows that there is/are ___________ in the data.A)categorical variable;skewness to the right
B)histogram;multiple peaks
C)line;an increasing trend
D)quantitative variable;outlier values
E)time series;a decreasing trend
Question
The timeplot below gives the number of burglaries committed each month for a city in Ohio.The plot is for the three-year period of January 1987 to December 1989. 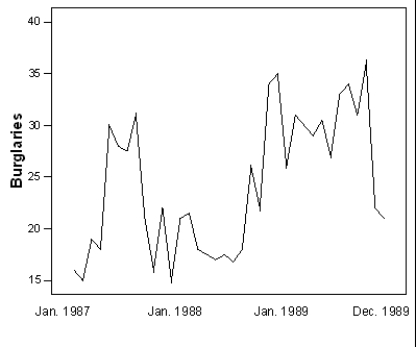 What is approximately the maximum number of burglaries for a month in 1988?
A)20
B)25
C)30
D)35
What is approximately the maximum number of burglaries for a month in 1988?A)20
B)25
C)30
D)35
Question
The World Malaria Report (2008)has information on the number of reported malaria cases from 2005 and 2006 for the 10 countries listed in West Africa.The data are presented in the table below.  The mean reported malaria cases in 2006 is _________.
A)less than 2,000,000
B)less than 200,000
C)100,000
D)3,000,000
The mean reported malaria cases in 2006 is _________.A)less than 2,000,000
B)less than 200,000
C)100,000
D)3,000,000
Question
In the fuel efficiency study of 2007 compact model automobiles,the following histogram of the distribution of the miles-per-gallon fuel efficiency rating in city driving (MPG-City)for automobiles manufactured in Europe was obtained. 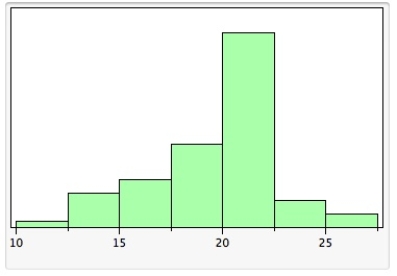 From the histogram above,showing the distribution of MPG-City,we can see that the
A)shape of the distribution is roughly symmetric with one peak.
B)distribution is skewed to the left.
C)distribution is skewed to the right.
D)distribution is roughly symmetric with outlier values to the left.
E)shape of the distribution would be easier to see if a stemplot had been constructed instead of the histogram.
From the histogram above,showing the distribution of MPG-City,we can see that theA)shape of the distribution is roughly symmetric with one peak.
B)distribution is skewed to the left.
C)distribution is skewed to the right.
D)distribution is roughly symmetric with outlier values to the left.
E)shape of the distribution would be easier to see if a stemplot had been constructed instead of the histogram.
Question
The World Malaria Report (2008)has information on the number of reported malaria cases from 2005 and 2006 for the 10 countries listed in West Africa.The data are presented in the table below.  If the number of reported malaria cases in Sierra Leone were mistyped and reported as 1,160,666,what would happen to the mean and median?
A)Both would remain unchanged.
B)The mean would change,but the median would stay the same.
C)The mean and median would change.
D)You cannot tell without doing the actual calculation.
If the number of reported malaria cases in Sierra Leone were mistyped and reported as 1,160,666,what would happen to the mean and median?A)Both would remain unchanged.
B)The mean would change,but the median would stay the same.
C)The mean and median would change.
D)You cannot tell without doing the actual calculation.
Question
The following stemplot displays the number of forest fires (in thousands)that occurred each year over the period from 1970 to 2000 in Canada,where 5|2 represents 5200 fires. 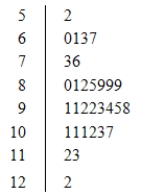 From the stemplot we can see that
A)the shape of the distribution is skewed to the left.
B)there appears to be one large peak.
C)there was a total of 9 years in which more than 10,000 fires occurred.
D)only one year had fewer than 6000 fires.
E)All of the above
From the stemplot we can see thatA)the shape of the distribution is skewed to the left.
B)there appears to be one large peak.
C)there was a total of 9 years in which more than 10,000 fires occurred.
D)only one year had fewer than 6000 fires.
E)All of the above
Question
Malaria is a leading cause of infectious disease and death worldwide.The table below represents the mean number of reported malaria cases (between 1996 and 2006)for each of 10 West African countries,as published in the journal Statistica Neerlandica in 2010.  Why is it not appropriate to use a histogram to display these data?
A)A pie chart is much easier to read.
B)The data are categorical and therefore a histogram is not appropriate.
C)The width of the bins would be too large to display a histogram.
D)None of the above
Why is it not appropriate to use a histogram to display these data?A)A pie chart is much easier to read.
B)The data are categorical and therefore a histogram is not appropriate.
C)The width of the bins would be too large to display a histogram.
D)None of the above
Question
Question
Malaria is a leading cause of infectious disease and death worldwide.The table below represents the mean number of reported malaria cases (between 1996 and 2006)for each of 10 West African countries,as published in the journal Statistica Neerlandica in 2010.  True or False.Making a histogram of the data would tell us if the distribution of the malaria data is symmetric.
True or False.Making a histogram of the data would tell us if the distribution of the malaria data is symmetric.
Unlock Deck
Sign up to unlock the cards in this deck!
Unlock Deck
Unlock Deck
1/127
Play
Full screen (f)
Deck 1: Looking at Datadistributions
1
We have a data set where the cases are college students.One of the variables in the data set is "gender." The values of gender are 1 if the student is male and 2 if the student is female.What type of variable is gender?
A)Quantitative
B)Categorical
C)Quantitative and categorical
D)None of the above
A)Quantitative
B)Categorical
C)Quantitative and categorical
D)None of the above
Categorical
2
What are labels used for in data sets?
A)To identify distributions
B)To identify values
C)To identify cases
D)None of the above
A)To identify distributions
B)To identify values
C)To identify cases
D)None of the above
To identify cases
3
A variable is a characteristic of a
A)case.
B)label.
C)value.
D)None of the above
A)case.
B)label.
C)value.
D)None of the above
case.
4
Categorical variables place cases into ____ group(s).
A)one
B)no
C)many
D)numeric
A)one
B)no
C)many
D)numeric
Unlock Deck
Unlock for access to all 127 flashcards in this deck.
Unlock Deck
k this deck
5
A type of variable where arithmetic operations do not make sense are called _______.
A)quantitative
B)categorical
C)distributions
D)cases
A)quantitative
B)categorical
C)distributions
D)cases
Unlock Deck
Unlock for access to all 127 flashcards in this deck.
Unlock Deck
k this deck
6
The first day of class the professor collects information on each student to make a data set that will be analyzed throughout the semester.The information asked includes hometown,GPA,number of classes,number of siblings,and favorite subject.How many categorical variables are in this data set?
A)1
B)2
C)3
D)4
A)1
B)2
C)3
D)4
Unlock Deck
Unlock for access to all 127 flashcards in this deck.
Unlock Deck
k this deck
7
The first day of class,the Professor collects information on each student to make a data set that will be analyzed throughout the semester.The information asked includes;hometown,GPA,number of classes taking,number of siblings,and favorite subject.How many quantitative variables are in this data set?
A)1
B)2
C)3
D)5
A)1
B)2
C)3
D)5
Unlock Deck
Unlock for access to all 127 flashcards in this deck.
Unlock Deck
k this deck
8
We have a data set where the cases are college students.One of the variables in the data set is "grade." The values of grade are 4 if the student received an A,3 if the student received a B,2 if the student received a C,1 if the student received a D,and 0 if the student received an A.What type of variable is grade?
A)Quantitative
B)Categorical
C)Quantitative and Categorical
D)None of the above
A)Quantitative
B)Categorical
C)Quantitative and Categorical
D)None of the above
Unlock Deck
Unlock for access to all 127 flashcards in this deck.
Unlock Deck
k this deck
9
Variables take on ________.
A)values
B)cases
C)distributions
D)None of the above
A)values
B)cases
C)distributions
D)None of the above
Unlock Deck
Unlock for access to all 127 flashcards in this deck.
Unlock Deck
k this deck
10
The first day of class the professor collects information on each student to make a data set that will be analyzed throughout the semester.The information asked includes hometown,GPA,number of classes,number of siblings,and favorite subject.How many variables are in this data set?
A)1
B)2
C)5
D)None of the above
A)1
B)2
C)5
D)None of the above
Unlock Deck
Unlock for access to all 127 flashcards in this deck.
Unlock Deck
k this deck
11
The units of measurement are an important part of the description of what type of variables?
A)Quantitative
B)Categorical
C)Quantitative and categorical
D)None of the above
A)Quantitative
B)Categorical
C)Quantitative and categorical
D)None of the above
Unlock Deck
Unlock for access to all 127 flashcards in this deck.
Unlock Deck
k this deck
12
Variables that take numeric values for which arithmetic operations make sense are called _______.
A)quantitative
B)categorical
C)distributions
D)cases
A)quantitative
B)categorical
C)distributions
D)cases
Unlock Deck
Unlock for access to all 127 flashcards in this deck.
Unlock Deck
k this deck
13
We have a data set where the cases are college students.One of the variables in the data set is "age of the student." What type of variable is age of the student?
A)Quantitative
B)Categorical
C)Quantitative and categorical
D)None of the above
A)Quantitative
B)Categorical
C)Quantitative and categorical
D)None of the above
Unlock Deck
Unlock for access to all 127 flashcards in this deck.
Unlock Deck
k this deck
14
Below is a data set with information on students in a basic statistics class at a local university.Are there any striking deviations from the overall pattern for the quantitative variable in the data set?
A)No,the data follow the same pattern.
B)Yes,there is an outlier.
C)Too few data points to determine
D)None of the above.
A)No,the data follow the same pattern.
B)Yes,there is an outlier.
C)Too few data points to determine
D)None of the above.
Unlock Deck
Unlock for access to all 127 flashcards in this deck.
Unlock Deck
k this deck
15
The first day of class the professor collects information on each student to make a data set that will be analyzed throughout the semester.The information asked includes hometown,GPA,number of classes,number of siblings,and favorite subject.What are the cases in this data set?
A)The semester
B)The professor
C)The college students
D)None of the above
A)The semester
B)The professor
C)The college students
D)None of the above
Unlock Deck
Unlock for access to all 127 flashcards in this deck.
Unlock Deck
k this deck
16
We have a data set where the cases are college students.One of the variables in the data set is "hometown." What type of variable is hometown?
A)Quantitative
B)Categorical
C)Quantitative and categorical
D)None of the above
A)Quantitative
B)Categorical
C)Quantitative and categorical
D)None of the above
Unlock Deck
Unlock for access to all 127 flashcards in this deck.
Unlock Deck
k this deck
17
Below is a data set with information on students in a basic statistics class at a local university.What is a key characteristic of the data set?
A)There are 10 students in the data set.
B)The data describe students in a class.
C)There are three variables in the data set.
D)All of the above
A)There are 10 students in the data set.
B)The data describe students in a class.
C)There are three variables in the data set.
D)All of the above
Unlock Deck
Unlock for access to all 127 flashcards in this deck.
Unlock Deck
k this deck
18
Suppose you are interested in comparing the quality of different hospitals based on infections occurred from surgery.What would be the best way to measure such a variable?
A)Rate of infections
B)Count of infections
C)None of the above
A)Rate of infections
B)Count of infections
C)None of the above
Unlock Deck
Unlock for access to all 127 flashcards in this deck.
Unlock Deck
k this deck
19
Below is a data set with information on students in a basic statistics class at a local university.Which variable is the label?
A)Student ID
B)GPA
C)Hometown
D)Major
A)Student ID
B)GPA
C)Hometown
D)Major
Unlock Deck
Unlock for access to all 127 flashcards in this deck.
Unlock Deck
k this deck
20
Suppose you own a pizza delivery company and you are trying to determine the best campus on which to sell pizza.What would be the best measurement to make the comparison?
A)Average number of pizzas purchased
B)Count of pizzas purchased
C)Rate of pizzas purchased
D)None of the above
A)Average number of pizzas purchased
B)Count of pizzas purchased
C)Rate of pizzas purchased
D)None of the above
Unlock Deck
Unlock for access to all 127 flashcards in this deck.
Unlock Deck
k this deck
21
When making a stemplot,it is appropriate to _______ if the values have many digits.
A)split the stems
B)split the leaves
C)trim the stems
D)trim the leaves
A)split the stems
B)split the leaves
C)trim the stems
D)trim the leaves
Unlock Deck
Unlock for access to all 127 flashcards in this deck.
Unlock Deck
k this deck
22
The histogram below shows data from 30 students who were asked,"How much time do you spend on the Internet in minutes?" What are some features about the data?
A)There is a potential outlier.
B)Most values are around 800.
C)The range of values is between 0 and 400.
D)None of the above
A)There is a potential outlier.
B)Most values are around 800.
C)The range of values is between 0 and 400.
D)None of the above
Unlock Deck
Unlock for access to all 127 flashcards in this deck.
Unlock Deck
k this deck
23
The histogram below shows data from 30 students who were asked,"How much time do you spend on the Internet in minutes?" How could you improve the histogram to better display the distribution?
A)Increase the class size.
B)Decrease the class size.
C)Do nothing-the histogram is appropriate.
D)Add two more data points.
A)Increase the class size.
B)Decrease the class size.
C)Do nothing-the histogram is appropriate.
D)Add two more data points.
Unlock Deck
Unlock for access to all 127 flashcards in this deck.
Unlock Deck
k this deck
24
Thirty students were asked,"How much time did you spend studying for the last quiz?" The histograms below were all used on the same data;however,the class size was changed for each one.Which histogram below best displays the data?
A)
B)
C)
D)
A)
B)
C)
D)
Unlock Deck
Unlock for access to all 127 flashcards in this deck.
Unlock Deck
k this deck
25
When making histograms,the classes ________.
A)should be equal width
B)do not need to be equal width
C)should be selected randomly
D)should always be a width of 10
A)should be equal width
B)do not need to be equal width
C)should be selected randomly
D)should always be a width of 10
Unlock Deck
Unlock for access to all 127 flashcards in this deck.
Unlock Deck
k this deck
26
Consider the following data which describe the amount of time in minutes students spend studying for a quiz: 10,11,11,12,12,14,15,18,19,20,22,24,39,40,41,44,46,50,52,52,53,55,70.
What numbers make up the leaf of the first stem if you were splitting the stems?
A)0,1,1,2,2,4,5,8,9
B)0,1,2,4,5,8,9
C)0,1,1,2,2,4
D)0,1,2,4
What numbers make up the leaf of the first stem if you were splitting the stems?
A)0,1,1,2,2,4,5,8,9
B)0,1,2,4,5,8,9
C)0,1,1,2,2,4
D)0,1,2,4
Unlock Deck
Unlock for access to all 127 flashcards in this deck.
Unlock Deck
k this deck
27
The stemplot below displays data from 30 students who were asked,"How much time in minutes do you spend on the Internet?" What do you notice about the stemplot? Variable: Time spent on the Internet
The decimal point is 2 digits to the right of the colon.
0 : 111123334
0 : 59
1 : 022
1 :
2 : 013333
2 : 5
3 : 224
3 :
4 :
4 :
5 : 4
5 : 678
6 :
6 : 5
7 :
7 :
8 :
8 : 7
A)The stems were split.
B)The leaves were trimmed.
C)The stems were split and the leaves were trimmed.
D)None of the above
The decimal point is 2 digits to the right of the colon.
0 : 111123334
0 : 59
1 : 022
1 :
2 : 013333
2 : 5
3 : 224
3 :
4 :
4 :
5 : 4
5 : 678
6 :
6 : 5
7 :
7 :
8 :
8 : 7
A)The stems were split.
B)The leaves were trimmed.
C)The stems were split and the leaves were trimmed.
D)None of the above
Unlock Deck
Unlock for access to all 127 flashcards in this deck.
Unlock Deck
k this deck
28
When making a stemplot,it is appropriate to _______ if the values cover a very small range.
A)split the stem
B)split the leaves
C)trim the stem
D)trim the leaves
A)split the stem
B)split the leaves
C)trim the stem
D)trim the leaves
Unlock Deck
Unlock for access to all 127 flashcards in this deck.
Unlock Deck
k this deck
29
The distribution of a categorical variable is displayed using _______.
A)letters
B)counts
C)percentages
D)counts or percentages
A)letters
B)counts
C)percentages
D)counts or percentages
Unlock Deck
Unlock for access to all 127 flashcards in this deck.
Unlock Deck
k this deck
30
What method is useful when comparing two distributions using a stemplot?
A)Splitting the stem
B)Trimming the leaves
C)Back-to-back stemplots
D)None of the above
A)Splitting the stem
B)Trimming the leaves
C)Back-to-back stemplots
D)None of the above
Unlock Deck
Unlock for access to all 127 flashcards in this deck.
Unlock Deck
k this deck
31
Quantitative variables are best displayed using _______.
A)stemplots
B)pie charts
C)bar graphs
D)pie charts or bar graphs
A)stemplots
B)pie charts
C)bar graphs
D)pie charts or bar graphs
Unlock Deck
Unlock for access to all 127 flashcards in this deck.
Unlock Deck
k this deck
32
Large data sets with quantitative variables are best displayed using ________.
A)stemplots
B)histograms
C)stemplots and histograms
D)none of the above
A)stemplots
B)histograms
C)stemplots and histograms
D)none of the above
Unlock Deck
Unlock for access to all 127 flashcards in this deck.
Unlock Deck
k this deck
33
Consider the following data which describe the amount of time in minutes students spend studying for a quiz: 10,11,11,12,12,14,15,18,19,20,22,24,39,40,41,44,46,50,52,52,53,55,70.
What numbers make up the leaf of the last stem?
A)0,1,1,2,2,4,5,8,9
B)0,1,4,6
C)0,2,2,3,5,0
D)None of the above
What numbers make up the leaf of the last stem?
A)0,1,1,2,2,4,5,8,9
B)0,1,4,6
C)0,2,2,3,5,0
D)None of the above
Unlock Deck
Unlock for access to all 127 flashcards in this deck.
Unlock Deck
k this deck
34
The appearance of a histogram will change when you _______.
A)change the class size
B)add more data
C)remove outliers
D)All of the above
A)change the class size
B)add more data
C)remove outliers
D)All of the above
Unlock Deck
Unlock for access to all 127 flashcards in this deck.
Unlock Deck
k this deck
35
The tails of a distribution show the _______.
A)center
B)extreme values
C)median
D)None of the above
A)center
B)extreme values
C)median
D)None of the above
Unlock Deck
Unlock for access to all 127 flashcards in this deck.
Unlock Deck
k this deck
36
Consider the following data which describe the amount of time in minutes students spend studying for a quiz: 10,11,11,12,12,14,15,18,19,20,22,24,39,40,41,44,46,50,52,52,53,55,70.
What numbers make up the stem?
A)1,2,3,4,5,6,7
B)1,2,3,4,5,7
C)0,1,1,2,2,4,5,8,9,0,2,4,9,0,1,4,6,0,2,2,3,5,0
D)None of the above
What numbers make up the stem?
A)1,2,3,4,5,6,7
B)1,2,3,4,5,7
C)0,1,1,2,2,4,5,8,9,0,2,4,9,0,1,4,6,0,2,2,3,5,0
D)None of the above
Unlock Deck
Unlock for access to all 127 flashcards in this deck.
Unlock Deck
k this deck
37
Categorical variables are best displayed by ______.
A)histograms
B)pie charts
C)bar graphs
D)pie charts or bar graphs
A)histograms
B)pie charts
C)bar graphs
D)pie charts or bar graphs
Unlock Deck
Unlock for access to all 127 flashcards in this deck.
Unlock Deck
k this deck
38
Consider the following data which describe the amount of time in minutes students spend studying for a quiz: 10,11,11,12,12,14,15,18,19,20,22,24,39,40,41,44,46,50,52,52,53,55,70.
What numbers make up the leaf of the first stem?
A)0,1,1,2,2,4,5,8,9
B)0,1,2,4,5,8,9
C)0,1,1,2,2,4,5,8,9,0,2,4,9,0,1,4,6,0,2,2,3,5,0
D)None of the above
What numbers make up the leaf of the first stem?
A)0,1,1,2,2,4,5,8,9
B)0,1,2,4,5,8,9
C)0,1,1,2,2,4,5,8,9,0,2,4,9,0,1,4,6,0,2,2,3,5,0
D)None of the above
Unlock Deck
Unlock for access to all 127 flashcards in this deck.
Unlock Deck
k this deck
39
Consider the following data which describe the amount of time in minutes students spend studying for a quiz: 10,11,11,12,12,14,15,18,19,20,22,24,39,40,41,44,46,50,52,52,53,55,70.
What numbers make up the leaf of the last stem if you were splitting the stems?
A)0,2,2,3,5,0
B)0,2,3,5
C)0
D)No leaves on the last stem
What numbers make up the leaf of the last stem if you were splitting the stems?
A)0,2,2,3,5,0
B)0,2,3,5
C)0
D)No leaves on the last stem
Unlock Deck
Unlock for access to all 127 flashcards in this deck.
Unlock Deck
k this deck
40
When using a pie chart,the sum of all the percentages should be _____.
A)0
B)1
C)100
D)50
A)0
B)1
C)100
D)50
Unlock Deck
Unlock for access to all 127 flashcards in this deck.
Unlock Deck
k this deck
41
A distributor of electronics is doing a customer satisfaction survey for a manufacturer of tablet computers.A sample of 68 clients is asked to rate a particular tablet on appearance,functionality,ease of use,and price on a scale of 1 to 10,where 1 corresponds to the worst rating and 10 to the best possible rating.A bar graph of the ease of use ratings classified by gender is given below. What percentage of the sampled female clients rated the tablet as not so easy to use (a rating of 4 or lower)?
A)28%
B)29%
C)38%
D)62%
What percentage of the sampled female clients rated the tablet as not so easy to use (a rating of 4 or lower)?A)28%
B)29%
C)38%
D)62%
Unlock Deck
Unlock for access to all 127 flashcards in this deck.
Unlock Deck
k this deck
42
The Consumers Union measured the gas mileage in miles per gallon of 38 automobiles from the 1978-1979 model-year on a special test track.The pie chart below provides information about the country of manufacture of the automobiles used in this study by the Consumers Union. Which of the following bar graphs represents the same data as in the pie chart?
A)
B)
C)
D)
Which of the following bar graphs represents the same data as in the pie chart?A)
B)
C)
D)
Unlock Deck
Unlock for access to all 127 flashcards in this deck.
Unlock Deck
k this deck
43
When using a histogram to display categorical values,you should make sure the categories are in alphabetical order.
A)True-histograms are not useful if the categories are not in order.
B)True-histograms can be used on any type of data.
C)False-You cannot use histograms to display categorical data.
D)False-The categories cannot be in alphabetical order when displaying categorical data.
A)True-histograms are not useful if the categories are not in order.
B)True-histograms can be used on any type of data.
C)False-You cannot use histograms to display categorical data.
D)False-The categories cannot be in alphabetical order when displaying categorical data.
Unlock Deck
Unlock for access to all 127 flashcards in this deck.
Unlock Deck
k this deck
44
During the early part of the 1994 baseball season,many sports fans and baseball players noticed that the number of home runs being hit seemed to be unusually large.Below are separate stemplots for the number of home runs by American League and National League teams based on the team-by-team statistics on home runs hit through Friday,June 3,1994 (from the Columbus Dispatch,Sunday,June 5,1994). Legend: 2|9 represents 29. What is the mean for the number of home runs for the National League teams?
A)45
B)50
C)50.1
D)57.5
Legend: 2|9 represents 29. What is the mean for the number of home runs for the National League teams?A)45
B)50
C)50.1
D)57.5
Unlock Deck
Unlock for access to all 127 flashcards in this deck.
Unlock Deck
k this deck
45
A study is being conducted on air quality at a small college in the South.As part of this study,monitors were posted at every entrance to this college from 6:00 a.m.to 10:00 p.m.on a randomly chosen day.The monitors recorded the mode of transportation used by each person as they entered the campus.Based on the information recorded,the following bar graph was constructed. If 1200 people entered campus on this particular day, (approximately)how many people arrived by bus?
A)10
B)100
C)120
D)135
If 1200 people entered campus on this particular day, (approximately)how many people arrived by bus?A)10
B)100
C)120
D)135
Unlock Deck
Unlock for access to all 127 flashcards in this deck.
Unlock Deck
k this deck
46
A sample of employees of a large pharmaceutical company has been obtained.The length of time (in months)they have worked for the company was recorded for each employee.A stemplot of these data is shown below.In the stemplot 6|2 represents 62 months. What would be a better way to represent this data set?
A)Display the data in a time plot.
B)Display the data in a boxplot.
C)Split the stems.
D)Use a histogram with class width equal to 10.
What would be a better way to represent this data set?A)Display the data in a time plot.
B)Display the data in a boxplot.
C)Split the stems.
D)Use a histogram with class width equal to 10.
Unlock Deck
Unlock for access to all 127 flashcards in this deck.
Unlock Deck
k this deck
47
In a statistics class with 136 students,the professor records how much money each student has in their possession during the first class of the semester.The histogram shown below represents the data he collected. What is approximately the number of students with $30 or more in their possession?
A)Less than 5
B)About 10
C)About 30
D)More than 100
What is approximately the number of students with $30 or more in their possession?A)Less than 5
B)About 10
C)About 30
D)More than 100
Unlock Deck
Unlock for access to all 127 flashcards in this deck.
Unlock Deck
k this deck
48
Data are collected from 1100 randomly selected students who graduated between 2005 and 2008 from the University of Florida.A pie chart of the departments in the school/college from which the 1100 sampled students graduated is shown below. Based on the graph, (approximately)how many of the sampled students graduated with a degree in Building/Construction or Architecture?
A)55
B)59
C)65
D)99
Based on the graph, (approximately)how many of the sampled students graduated with a degree in Building/Construction or Architecture?A)55
B)59
C)65
D)99
Unlock Deck
Unlock for access to all 127 flashcards in this deck.
Unlock Deck
k this deck
49
A consumer agency is testing appliances for a series of articles in their magazine.Currently they are working with cooktops and ranges.They have selected 16 of the most commonly used models.Using a series of tests,the agency will estimate the lifetime of these models.A histogram of these (estimated)lifetimes is shown below. What is the proportion of these appliances that is estimated to last longer than 15 years?
A)More than half
B)Less than half
C)Equal to 4/16 = 0.25
D)It cannot be determined from this graph.
What is the proportion of these appliances that is estimated to last longer than 15 years?A)More than half
B)Less than half
C)Equal to 4/16 = 0.25
D)It cannot be determined from this graph.
Unlock Deck
Unlock for access to all 127 flashcards in this deck.
Unlock Deck
k this deck
50
During the early part of the 1994 baseball season,many sports fans and baseball players noticed that the number of home runs being hit seemed to be unusually large.Below are separate stemplots for the number of home runs by American League and National League teams based on the team-by-team statistics on home runs hit through Friday,June 3,1994 (from the Columbus Dispatch,Sunday,June 5,1994). Legend: 2|9 represents 29. What is the median for the number of home runs for the American League teams?
A)45
B)50
C)50.5
D)57.5
Legend: 2|9 represents 29. What is the median for the number of home runs for the American League teams?A)45
B)50
C)50.5
D)57.5
Unlock Deck
Unlock for access to all 127 flashcards in this deck.
Unlock Deck
k this deck
51
During the early part of the 1994 baseball season,many sports fans and baseball players noticed that the number of home runs being hit seemed to be unusually large.Below are separate stemplots for the number of home runs by American League and National League teams based on the team-by-team statistics on home runs hit through Friday,June 3,1994 (from the Columbus Dispatch,Sunday,June 5,1994). Legend: 2|9 represents 29. What is the maximum number of home runs from a National League team?
A)7
B)70
C)67
D)48
Legend: 2|9 represents 29. What is the maximum number of home runs from a National League team?A)7
B)70
C)67
D)48
Unlock Deck
Unlock for access to all 127 flashcards in this deck.
Unlock Deck
k this deck
52
In a statistics class with 136 students,the professor records how much money each student has in their possession during the first class of the semester.The histogram shown below represents the data he collected. What is approximately the percentage of students with under $10 in their possession?
A)35%
B)40%
C)44%
D)50%
What is approximately the percentage of students with under $10 in their possession?A)35%
B)40%
C)44%
D)50%
Unlock Deck
Unlock for access to all 127 flashcards in this deck.
Unlock Deck
k this deck
53
A consumer agency is testing appliances for a series of articles in their magazine.Currently they are working with cooktops and ranges.They have selected 16 of the most commonly used models.Using a series of tests,the agency will estimate the lifetime of these models.A histogram of these (estimated)lifetimes is shown below. Select all correct descriptions for the shape of the histogram of the estimated lifetimes of these 16 appliances.
A)Symmetric
B)Unimodal
C)Skewed right
D)Skewed left
Select all correct descriptions for the shape of the histogram of the estimated lifetimes of these 16 appliances.A)Symmetric
B)Unimodal
C)Skewed right
D)Skewed left
Unlock Deck
Unlock for access to all 127 flashcards in this deck.
Unlock Deck
k this deck
54
The histogram below represents the height (in inches)of the gold medal-winning high jumps for the Olympic Games up to Sydney 2000. What is approximately the percentage of these winning jumps that were at least 7 feet and1 inch high (85 inches)?
A)9%
B)14%
C)23%
D)35%
What is approximately the percentage of these winning jumps that were at least 7 feet and1 inch high (85 inches)?A)9%
B)14%
C)23%
D)35%
Unlock Deck
Unlock for access to all 127 flashcards in this deck.
Unlock Deck
k this deck
55
When displaying the distribution of quantitative data,it is best to use
A)pie charts.
B)bar graphs.
C)histograms.
D)stemplots or histograms.
A)pie charts.
B)bar graphs.
C)histograms.
D)stemplots or histograms.
Unlock Deck
Unlock for access to all 127 flashcards in this deck.
Unlock Deck
k this deck
56
The histogram below represents the height (in inches)of the gold medal-winning high jumps for the Olympic Games up to Sydney 2000. What is approximately the mean height?
A)75 inches
B)77.5 inches
C)82 inches
D)90 inches
What is approximately the mean height?A)75 inches
B)77.5 inches
C)82 inches
D)90 inches
Unlock Deck
Unlock for access to all 127 flashcards in this deck.
Unlock Deck
k this deck
57
A study is being conducted on air quality at a small college in the South.As part of this study,monitors were posted at every entrance to this college from 6:00 a.m.to 10:00 p.m.on a randomly chosen day.The monitors recorded the mode of transportation used by each person as they entered the campus.Based on the information recorded,the following bar graph was constructed. Approximately what percentage of people entering campus on this particular day arrived by car?
A)9%
B)31%
C)53%
D)62%
Approximately what percentage of people entering campus on this particular day arrived by car?A)9%
B)31%
C)53%
D)62%
Unlock Deck
Unlock for access to all 127 flashcards in this deck.
Unlock Deck
k this deck
58
The timeplot below gives the number of burglaries committed each month for a city in Ohio.The plot is for the three-year period of January 1987 to December 1989. What is approximately the number of burglaries in December 1989,the last date recorded in the timeplot?
A)22
B)27
C)32
D)37
What is approximately the number of burglaries in December 1989,the last date recorded in the timeplot?A)22
B)27
C)32
D)37
Unlock Deck
Unlock for access to all 127 flashcards in this deck.
Unlock Deck
k this deck
59
When drawing a histogram,it is important to
A)have a separate class interval for each observation to get the most informative plot.
B)make sure the heights of the bars exceed the widths of the class intervals,so that the bars are true rectangles.
C)label the vertical axis so the reader can determine the counts or percentage in each class interval.
D)make certain the mean and median are contained in the same class interval,so that the correct type of skewness can be identified.
Unlock Deck
Unlock for access to all 127 flashcards in this deck.
Unlock Deck
k this deck
60
The pie chart provides information on all the majors at a university. What conclusion can we draw based on this pie chart?
A)The most popular major is in the "Other" category and therefore not shown.
B)More than half of the students at this university are majoring in Public Health,French,Business,Computer Science,or Economics.
C)More students are majoring in Education than in French.
D)The smallest major is Mathematics/Statistics.
What conclusion can we draw based on this pie chart?A)The most popular major is in the "Other" category and therefore not shown.
B)More than half of the students at this university are majoring in Public Health,French,Business,Computer Science,or Economics.
C)More students are majoring in Education than in French.
D)The smallest major is Mathematics/Statistics.
Unlock Deck
Unlock for access to all 127 flashcards in this deck.
Unlock Deck
k this deck
61
The World Malaria Report (2008)has information on the number of reported malaria cases from 2005 and 2006 for the 10 countries listed in West Africa.The data are presented in the table below. The median of the reported malaria cases in 2005 is _________.
A)less than 1,000,000
B)less than 200,000
C)100,000
D)3,000,000
The median of the reported malaria cases in 2005 is _________.A)less than 1,000,000
B)less than 200,000
C)100,000
D)3,000,000
Unlock Deck
Unlock for access to all 127 flashcards in this deck.
Unlock Deck
k this deck
62
The World Malaria Report (2008)has information on the number of reported malaria cases from 2005 and 2006 for the 10 countries listed in West Africa.The data are presented in the table below. The mean of the reported West African malaria cases in 2005 is ___________.
A)less than 116,698
B)greater than 1,600,000
C)100,000
D)greater than 200,000
The mean of the reported West African malaria cases in 2005 is ___________.A)less than 116,698
B)greater than 1,600,000
C)100,000
D)greater than 200,000
Unlock Deck
Unlock for access to all 127 flashcards in this deck.
Unlock Deck
k this deck
63
Malaria is a leading cause of infectious disease and death worldwide.The table below represents the mean number of reported malaria cases (between 1996 and 2006)for each of 10 West African countries,as published in the journal Statistica Neerlandica in 2010. What is the best method to display these data?
A)Histogram
B)Pie chart
C)Bar graph
D)Stem-and-leaf plot
What is the best method to display these data?A)Histogram
B)Pie chart
C)Bar graph
D)Stem-and-leaf plot
Unlock Deck
Unlock for access to all 127 flashcards in this deck.
Unlock Deck
k this deck
64
The World Malaria Report (2008)has information on the number of reported malaria cases from 2005 and 2006 for the 10 countries listed in West Africa.The data are presented in the table below. The mean number of malaria cases in 2006 is probably ______.
A)higher than in 2005
B)lower than in 2005
C)exactly the same as in 2005
The mean number of malaria cases in 2006 is probably ______.A)higher than in 2005
B)lower than in 2005
C)exactly the same as in 2005
Unlock Deck
Unlock for access to all 127 flashcards in this deck.
Unlock Deck
k this deck
65
Which of the following variables is categorical?
A)The number of Facebook friends you have
B)The amount of time a student spends on the Internet in one day
C)The available food choices in the student cafeteria
D)None of the above
A)The number of Facebook friends you have
B)The amount of time a student spends on the Internet in one day
C)The available food choices in the student cafeteria
D)None of the above
Unlock Deck
Unlock for access to all 127 flashcards in this deck.
Unlock Deck
k this deck
66
Malaria is a leading cause of infectious disease and death worldwide.The table below represents the mean number of reported malaria cases (between 1996 and 2006)for each of 10 West African countries,as published in the journal Statistica Neerlandica in 2010. True or False.The variable "country" is a quantitative variable.
True or False.The variable "country" is a quantitative variable. Unlock Deck
Unlock for access to all 127 flashcards in this deck.
Unlock Deck
k this deck
67
A study of 2007 model automobiles was conducted.In the study the following variables were considered: the Region in which the car was manufactured (Europe,North America,Asia);the Type of automobile (compact,midsize,large);the fuel economy in city driving of the automobile (MPG-City);volume of the engine in liters (EngSize);and the type of Fuel used (regular,premium,diesel).The variables Region,Type,MPG-City,EngSize,and Fuel are,respectively,
A)quantitative,categorical,categorical,quantitative,quantitative.
B)categorical,categorical,quantitative,categorical,categorical.
C)categorical,categorical,quantitative,categorical,quantitative.
D)categorical,categorical,quantitative,quantitative,categorical.
E)This cannot be determined without knowing the values of the various variables.
Unlock Deck
Unlock for access to all 127 flashcards in this deck.
Unlock Deck
k this deck
68
When examining a distribution of a quantitative variable,which of the following features do we look for?
A)Overall shape,center,and spread
B)Symmetry or skewness
C)Deviations from overall patterns such as outliers
D)The number of peaks or modes
E)All of the above
A)Overall shape,center,and spread
B)Symmetry or skewness
C)Deviations from overall patterns such as outliers
D)The number of peaks or modes
E)All of the above
Unlock Deck
Unlock for access to all 127 flashcards in this deck.
Unlock Deck
k this deck
69
The World Malaria Report (2008)has information on the number of reported malaria cases from 2005 and 2006 for the 10 countries listed in West Africa.The data are presented in the table below. The mean of the reported West African malaria cases in 2006 is ___________.
A)around 1,000,000
B)less than 200,000
C)100,000
D)3,000,000
The mean of the reported West African malaria cases in 2006 is ___________.A)around 1,000,000
B)less than 200,000
C)100,000
D)3,000,000
Unlock Deck
Unlock for access to all 127 flashcards in this deck.
Unlock Deck
k this deck
70
The World Malaria Report (2008)has information on the number of reported malaria cases from 2005 and 2006 for the 10 countries listed in West Africa.The data are presented in the table below. If the number of reported malaria cases in Ghana in 2005 were mistyped and reported as 30,452,969,what would happen to the mean and median?
A)Both would remain unchanged.
B)The mean would change,but the median would stay the same.
C)The mean and median would change.
D)You cannot tell without doing the actual calculation.
If the number of reported malaria cases in Ghana in 2005 were mistyped and reported as 30,452,969,what would happen to the mean and median?A)Both would remain unchanged.
B)The mean would change,but the median would stay the same.
C)The mean and median would change.
D)You cannot tell without doing the actual calculation.
Unlock Deck
Unlock for access to all 127 flashcards in this deck.
Unlock Deck
k this deck
71
Which of the following statements are FALSE?
A)The distribution of a categorical variable lists the categories and gives the counts or the percentages of individuals in each category.
B)A bar chart is a useful graphical tool for describing the shape of the distribution of a categorical variable.
C)A stemplot is particularly valuable for displaying the shape of the distribution of a categorical variable when there are few observations.
D)A histogram shows the distribution of counts or percentages among the values of a single quantitative variable.
E)Bar graphs,unlike histograms,can have blank spaces between the bars to separate the items being compared.
Unlock Deck
Unlock for access to all 127 flashcards in this deck.
Unlock Deck
k this deck
72
Statistics were gathered on the number of homicides committed with guns in Australia in the years from 1980 to 2004.From these data the following graph was constructed. This plot is a graph of a(n)_____________,and it shows that there is/are ___________ in the data.
A)categorical variable;skewness to the right
B)histogram;multiple peaks
C)line;an increasing trend
D)quantitative variable;outlier values
E)time series;a decreasing trend
This plot is a graph of a(n)_____________,and it shows that there is/are ___________ in the data.A)categorical variable;skewness to the right
B)histogram;multiple peaks
C)line;an increasing trend
D)quantitative variable;outlier values
E)time series;a decreasing trend
Unlock Deck
Unlock for access to all 127 flashcards in this deck.
Unlock Deck
k this deck
73
The timeplot below gives the number of burglaries committed each month for a city in Ohio.The plot is for the three-year period of January 1987 to December 1989. What is approximately the maximum number of burglaries for a month in 1988?
A)20
B)25
C)30
D)35
What is approximately the maximum number of burglaries for a month in 1988?A)20
B)25
C)30
D)35
Unlock Deck
Unlock for access to all 127 flashcards in this deck.
Unlock Deck
k this deck
74
The World Malaria Report (2008)has information on the number of reported malaria cases from 2005 and 2006 for the 10 countries listed in West Africa.The data are presented in the table below. The mean reported malaria cases in 2006 is _________.
A)less than 2,000,000
B)less than 200,000
C)100,000
D)3,000,000
The mean reported malaria cases in 2006 is _________.A)less than 2,000,000
B)less than 200,000
C)100,000
D)3,000,000
Unlock Deck
Unlock for access to all 127 flashcards in this deck.
Unlock Deck
k this deck
75
In the fuel efficiency study of 2007 compact model automobiles,the following histogram of the distribution of the miles-per-gallon fuel efficiency rating in city driving (MPG-City)for automobiles manufactured in Europe was obtained. From the histogram above,showing the distribution of MPG-City,we can see that the
A)shape of the distribution is roughly symmetric with one peak.
B)distribution is skewed to the left.
C)distribution is skewed to the right.
D)distribution is roughly symmetric with outlier values to the left.
E)shape of the distribution would be easier to see if a stemplot had been constructed instead of the histogram.
From the histogram above,showing the distribution of MPG-City,we can see that theA)shape of the distribution is roughly symmetric with one peak.
B)distribution is skewed to the left.
C)distribution is skewed to the right.
D)distribution is roughly symmetric with outlier values to the left.
E)shape of the distribution would be easier to see if a stemplot had been constructed instead of the histogram.
Unlock Deck
Unlock for access to all 127 flashcards in this deck.
Unlock Deck
k this deck
76
The World Malaria Report (2008)has information on the number of reported malaria cases from 2005 and 2006 for the 10 countries listed in West Africa.The data are presented in the table below. If the number of reported malaria cases in Sierra Leone were mistyped and reported as 1,160,666,what would happen to the mean and median?
A)Both would remain unchanged.
B)The mean would change,but the median would stay the same.
C)The mean and median would change.
D)You cannot tell without doing the actual calculation.
If the number of reported malaria cases in Sierra Leone were mistyped and reported as 1,160,666,what would happen to the mean and median?A)Both would remain unchanged.
B)The mean would change,but the median would stay the same.
C)The mean and median would change.
D)You cannot tell without doing the actual calculation.
Unlock Deck
Unlock for access to all 127 flashcards in this deck.
Unlock Deck
k this deck
77
The following stemplot displays the number of forest fires (in thousands)that occurred each year over the period from 1970 to 2000 in Canada,where 5|2 represents 5200 fires. From the stemplot we can see that
A)the shape of the distribution is skewed to the left.
B)there appears to be one large peak.
C)there was a total of 9 years in which more than 10,000 fires occurred.
D)only one year had fewer than 6000 fires.
E)All of the above
From the stemplot we can see thatA)the shape of the distribution is skewed to the left.
B)there appears to be one large peak.
C)there was a total of 9 years in which more than 10,000 fires occurred.
D)only one year had fewer than 6000 fires.
E)All of the above
Unlock Deck
Unlock for access to all 127 flashcards in this deck.
Unlock Deck
k this deck
78
Malaria is a leading cause of infectious disease and death worldwide.The table below represents the mean number of reported malaria cases (between 1996 and 2006)for each of 10 West African countries,as published in the journal Statistica Neerlandica in 2010. Why is it not appropriate to use a histogram to display these data?
A)A pie chart is much easier to read.
B)The data are categorical and therefore a histogram is not appropriate.
C)The width of the bins would be too large to display a histogram.
D)None of the above
Why is it not appropriate to use a histogram to display these data?A)A pie chart is much easier to read.
B)The data are categorical and therefore a histogram is not appropriate.
C)The width of the bins would be too large to display a histogram.
D)None of the above
Unlock Deck
Unlock for access to all 127 flashcards in this deck.
Unlock Deck
k this deck
79
According to the American Cancer Society,the decline in colorectal cancer mortality,primarily attributed to early detection and treatment,has not been consistent among race/ethnic groups.A colorectal exam is one method for early detection of colorectal cancer.In 2008,29.5% of whites,56.9% of African Americans,and 62.4% of Hispanics had not received a colorectal exam within the last 10 years.What is the best method to display these data?
A)Histogram
B)Pie chart
C)Bar graph
D)Stem-and-leaf plot
A)Histogram
B)Pie chart
C)Bar graph
D)Stem-and-leaf plot
Unlock Deck
Unlock for access to all 127 flashcards in this deck.
Unlock Deck
k this deck
80
Malaria is a leading cause of infectious disease and death worldwide.The table below represents the mean number of reported malaria cases (between 1996 and 2006)for each of 10 West African countries,as published in the journal Statistica Neerlandica in 2010. True or False.Making a histogram of the data would tell us if the distribution of the malaria data is symmetric.
True or False.Making a histogram of the data would tell us if the distribution of the malaria data is symmetric. Unlock Deck
Unlock for access to all 127 flashcards in this deck.
Unlock Deck
k this deck
Unlock Deck
Unlock for access to all 127 flashcards in this deck.


