Deck 10: B: Inference From Small Samples
Full screen (f)
Question
Vertical Blinds Installation Narrative
A drapery store manager was interested in determining whether a new employee can install vertical blinds faster than an employee who has been with the company for two years. The manager takes independent samples of ten vertical blind installations of each of the two employees and computes the following information.
Refer to Vertical Blinds Installation Narrative. Calculate the value of the test statistic.
Question
Vertical Blinds Installation Narrative
A drapery store manager was interested in determining whether a new employee can install vertical blinds faster than an employee who has been with the company for two years. The manager takes independent samples of ten vertical blind installations of each of the two employees and computes the following information.
Refer to Vertical Blinds Installation Narrative. Use = 0.05 to test the hypothesis that the two population variances are equal.
A drapery store manager was interested in determining whether a new employee can install vertical blinds faster than an employee who has been with the company for two years. The manager takes independent samples of ten vertical blind installations of each of the two employees and computes the following information.
Refer to Vertical Blinds Installation Narrative. Use
= 0.05 to test the hypothesis that the two population variances are equal. Question
Average Battery Life Narrative
The average life of a certain type and brand of battery is 75 weeks. The average life of each of nine randomly selected batteries is as follows: 74.5, 75.0, 72.3, 76.0, 75.2, 75.1, 75.3, 74.9, and 74.8. Assume the battery life distribution is normal. Do the sample data suggest the average life is smaller than 75 weeks?
Refer to Average Battery Life Narrative. Compute the approximate p-value associated with the test statistic in question 54. Do the sample data support the alternative hypothesis at the = 0.05 level? Justify your conclusion.
The average life of a certain type and brand of battery is 75 weeks. The average life of each of nine randomly selected batteries is as follows: 74.5, 75.0, 72.3, 76.0, 75.2, 75.1, 75.3, 74.9, and 74.8. Assume the battery life distribution is normal. Do the sample data suggest the average life is smaller than 75 weeks?
Refer to Average Battery Life Narrative. Compute the approximate p-value associated with the test statistic in question 54. Do the sample data support the alternative hypothesis at the
= 0.05 level? Justify your conclusion. Question
Vertical Blinds Installation Narrative
A drapery store manager was interested in determining whether a new employee can install vertical blinds faster than an employee who has been with the company for two years. The manager takes independent samples of ten vertical blind installations of each of the two employees and computes the following information.
Refer to Vertical Blinds Installation Narrative. State the appropriate null and alternative hypotheses to test whether the new employee installs vertical blinds faster, on the average, than the veteran employee.
Question
Question
Question
Vertical Blinds Installation Narrative
A drapery store manager was interested in determining whether a new employee can install vertical blinds faster than an employee who has been with the company for two years. The manager takes independent samples of ten vertical blind installations of each of the two employees and computes the following information.
-Refer to Vertical Blinds Installation Narrative. Set up the appropriate rejection region for the hypotheses above and assume = 0.05.
Question
Question
Question
Vertical Blinds Installation Narrative
A drapery store manager was interested in determining whether a new employee can install vertical blinds faster than an employee who has been with the company for two years. The manager takes independent samples of ten vertical blind installations of each of the two employees and computes the following information.
-Refer to Vertical Blinds Installation Narrative. What is the appropriate conclusion? Give reasons for your answer.
Question
Question
Vertical Blinds Installation Narrative
A drapery store manager was interested in determining whether a new employee can install vertical blinds faster than an employee who has been with the company for two years. The manager takes independent samples of ten vertical blind installations of each of the two employees and computes the following information.
Refer to Vertical Blinds Installation Narrative. Is it reasonable to assume equality of variances in this ? Justify your answer.
Question
Vertical Blinds Installation Narrative
A drapery store manager was interested in determining whether a new employee can install vertical blinds faster than an employee who has been with the company for two years. The manager takes independent samples of ten vertical blind installations of each of the two employees and computes the following information.
-A logger knows the average time for his cutting machine to cut 20 trees is 9.8 minutes. A new machine on the market claims to cut the trees in less than 9.8 minutes. A random sample of 25 test runs on the new machine yielded a mean of 8.5 minutes with a standard deviation of 1.5. Do the sample data suggest the new machine cuts faster than the logger's machine? Test at the = 0.05 level. Assume the cutting time is normally distributed and interpret your results.
Question
Question
Let denote the true average number of minutes of a television commercial. Suppose the hypotheses  are tested. Assuming the commercial time is normally distributed, give the appropriate rejection region for each of the following sample sizes and significance levels.
a. n = 6, = 0.01
b. n = 12, = 0.05
c. n = 20, = 0.05
d. n = 23, = 0.1
= 0.1
are tested. Assuming the commercial time is normally distributed, give the appropriate rejection region for each of the following sample sizes and significance levels. a. n = 6,
= 0.01 b. n = 12,
= 0.05 c. n = 20,
= 0.05 d. n = 23,
= 0.1 Question
Question
Question
Vertical Blinds Installation Narrative
A drapery store manager was interested in determining whether a new employee can install vertical blinds faster than an employee who has been with the company for two years. The manager takes independent samples of ten vertical blind installations of each of the two employees and computes the following information.
Refer to Vertical Blinds Installation Narrative. Calculate the pooled estimate of the common variance
Question
Average Fuel Consumption
The average fuel consumption of a 4-wheel drive truck is 12.9 L/100 km. The average fuel consumption for seven randomly selected trucks is 13.5, 13.0, 12.6, 12.2, 12.8, 12.9, and 13.1. Assume the fuel consumption distribution is normal. The researcher wishes to know if the sample data suggest that the average fuel consumption is different from 12.9 L/100 km.
Please refer to the Average Fuel Consumption paragraph. Compute the approximate p-value associated with the test statistic in the previous question. Do the sample data support the null hypothesis at the = 0.05 level? Justify your conclusion.
The average fuel consumption of a 4-wheel drive truck is 12.9 L/100 km. The average fuel consumption for seven randomly selected trucks is 13.5, 13.0, 12.6, 12.2, 12.8, 12.9, and 13.1. Assume the fuel consumption distribution is normal. The researcher wishes to know if the sample data suggest that the average fuel consumption is different from 12.9 L/100 km.
Please refer to the Average Fuel Consumption paragraph. Compute the approximate p-value associated with the test statistic in the previous question. Do the sample data support the null hypothesis at the
= 0.05 level? Justify your conclusion. Question
Question
Cigarette Tar Content Narrative
Ten measurements of the tar content of a certain brand of cigarette are 13.5, 14.0, 13.9, 14.2, 15.1, 14.6, 13.8, 14.0, 14.1, and 14.7 in milligrams per cigarette. Assume these measurements were taken from a population with a normal distribution.
One study revealed a child under the age of 10 watches television 4.5 hours per day. A group of families from a certain community would like to believe that their children watch less television than the national average. A random sample of 14 children from the community yielded a mean of 4.1 hours per day with a standard deviation of 1.2. Test the appropriate hypotheses at the = 0.01 level. Assume the viewing time is normally distributed and interpret your results.
Ten measurements of the tar content of a certain brand of cigarette are 13.5, 14.0, 13.9, 14.2, 15.1, 14.6, 13.8, 14.0, 14.1, and 14.7 in milligrams per cigarette. Assume these measurements were taken from a population with a normal distribution.
One study revealed a child under the age of 10 watches television 4.5 hours per day. A group of families from a certain community would like to believe that their children watch less television than the national average. A random sample of 14 children from the community yielded a mean of 4.1 hours per day with a standard deviation of 1.2. Test the appropriate hypotheses at the
= 0.01 level. Assume the viewing time is normally distributed and interpret your results. Question
Question
Question
Question
Question
Question
Question
Question
Question
Question
Question
Question
Manufacturing Garment Average Narrative
A garment manufacturing company recorded the amount of time that it took to make a pair of jeans on eight different occasions. The times in minutes are as follows: 12.5, 13.0, 11.9, 10.2, 13.1, 13.6, 13.8, and 14.0. Assume these measurements were taken from a population with a normal distribution. Do the sample data suggest that the average time it takes this company to make a pair of jeans is less than 13.5 minutes?
Refer to Manufacturing Garment Average Narrative. Do the sample data support the alternative hypothesis at the = 0.05 level? Justify your conclusion.
A garment manufacturing company recorded the amount of time that it took to make a pair of jeans on eight different occasions. The times in minutes are as follows: 12.5, 13.0, 11.9, 10.2, 13.1, 13.6, 13.8, and 14.0. Assume these measurements were taken from a population with a normal distribution. Do the sample data suggest that the average time it takes this company to make a pair of jeans is less than 13.5 minutes?
Refer to Manufacturing Garment Average Narrative. Do the sample data support the alternative hypothesis at the
= 0.05 level? Justify your conclusion. Question
Question
Question
Question
Question
Question
Childcare Costs Narrative
The public relations officer for a particular city claims the average monthly cost for childcare outside the home for a single child is $600. A potential resident is interested in whether the claim is correct. She obtains a random sample of 14 records and computes the average monthly cost of this type of childcare to be $589 with a standard deviation of $40.
Refer to Childcare Costs Narrative. Perform the appropriate test of hypothesis for the potential resident using = 0.01.
The public relations officer for a particular city claims the average monthly cost for childcare outside the home for a single child is $600. A potential resident is interested in whether the claim is correct. She obtains a random sample of 14 records and computes the average monthly cost of this type of childcare to be $589 with a standard deviation of $40.
Refer to Childcare Costs Narrative. Perform the appropriate test of hypothesis for the potential resident using
= 0.01. Question
Question
Grocery Receipts Narrative
A simple random sample of 100 grocery receipts was drawn from a normal population. The mean and standard deviation of the sample were $120 and $25, respectively.
Refer to Grocery Receipts Narrative. Explain how to use the confidence interval to test the hypotheses at .
.
A simple random sample of 100 grocery receipts was drawn from a normal population. The mean and standard deviation of the sample were $120 and $25, respectively.
Refer to Grocery Receipts Narrative. Explain how to use the confidence interval to test the hypotheses at
. Question
Interest Rates Narrative
The following 10 observations are interest rates on unpaid balances on credit cards for a department store: 10.4, 10.1, 9.5, 10.5, 10.6, 9.3, 9.9, 10.7, 9.5, and 10.0.
Refer to Interest Rates Narrative. Calculate the test statistic , specify the rejection region and then test the hypothesis . Use
. Use  = 0.01.
The following 10 observations are interest rates on unpaid balances on credit cards for a department store: 10.4, 10.1, 9.5, 10.5, 10.6, 9.3, 9.9, 10.7, 9.5, and 10.0.
Refer to Interest Rates Narrative. Calculate the test statistic , specify the rejection region and then test the hypothesis
. Use = 0.01. Question
Disinfectant Experiments Narrative
An experiment to determine the efficacy of using 95% ethanol or 20% bleach as a disinfectant in removing bacterial and fungal contamination when culturing plant tissues was repeated 15 times for each disinfectant. The plant tissue being cultured was sweet potato: Five cuttings per plant were placed on a petri dish for each disinfectant and stored at 25°C for four weeks. The observation reported was the number of uncontaminated eggplant cuttings after the four-week storage.
Disinfectant
Refer to Disinfectant Experiments Narrative. Using the information from the previous question, are you willing to conclude that there is a significant difference in the mean numbers of uncontaminated eggplants for the two disinfectants tested?
Question
Question
Question
Question
A psychologist is trying to determine how many hours the average person sleeps each night. He takes a random sample of 25 individuals and asks each person how many hours he or she slept the previous night. The sum of the observations and the sum of the squared observations are  192.5 and
  1531.7. Estimate with 99% confidence the mean number of hours of sleep.
192.5 and 1531.7. Estimate with 99% confidence the mean number of hours of sleep. Question
Question
Question
Interest Rates Narrative
The following 10 observations are interest rates on unpaid balances on credit cards for a department store: 10.4, 10.1, 9.5, 10.5, 10.6, 9.3, 9.9, 10.7, 9.5, and 10.0.
Refer to Interest Rates Narrative. Find a 99% confidence interval for the population mean , and explain how to use it for testing
  vs.
vs.  using
using 
The following 10 observations are interest rates on unpaid balances on credit cards for a department store: 10.4, 10.1, 9.5, 10.5, 10.6, 9.3, 9.9, 10.7, 9.5, and 10.0.
Refer to Interest Rates Narrative. Find a 99% confidence interval for the population mean
, and explain how to use it for testing vs. using Question
Question
Hourly Wages Narrative
A random sample of 15 hourly wages for waitresses (including tips) was drawn from a normal population. The sample mean and sample standard deviation were computed as = $14.9 and s = $6.75.
Refer to Hourly Wages Narrative. Can we infer at the 5% significance level that the population mean is greater than 12? Justify your conclusion.
A random sample of 15 hourly wages for waitresses (including tips) was drawn from a normal population. The sample mean and sample standard deviation were computed as
= $14.9 and s = $6.75.Refer to Hourly Wages Narrative. Can we infer at the 5% significance level that the population mean is greater than 12? Justify your conclusion.
Question
Disinfectant Experiments Narrative
An experiment to determine the efficacy of using 95% ethanol or 20% bleach as a disinfectant in removing bacterial and fungal contamination when culturing plant tissues was repeated 15 times for each disinfectant. The plant tissue being cultured was sweet potato: Five cuttings per plant were placed on a petri dish for each disinfectant and stored at 25°C for four weeks. The observation reported was the number of uncontaminated eggplant cuttings after the four-week storage.
Disinfectant
Refer to Disinfectant Experiments Narrative. Is it reasonable to assume that the underlying variances are equal? Justify your conclusion.
Question
Assume that the population distributions of ages (in years) of students at two different universities in Ontario are normal with equal variances. Two random samples, drawn independently from the populations, showed the following statistics:  = 10,
= 10,  = 25,
= 25,  = 4;
= 4;  = 9,
= 9,  = 24, and
  = 9. Construct and interpret a 99% confidence interval for the true difference in average ages of students at each university.
= 10, = 25, = 4; = 9, = 24, and = 9. Construct and interpret a 99% confidence interval for the true difference in average ages of students at each university. Question
A random sample of seven observations was drawn from a normal population. The following summations were computed:  and
and  . Test the hypothesis
  vs.
vs.  at the 1% significance level.
and . Test the hypothesis vs. at the 1% significance level. Question
Interest Rates Narrative
The following 10 observations are interest rates on unpaid balances on credit cards for a department store: 10.4, 10.1, 9.5, 10.5, 10.6, 9.3, 9.9, 10.7, 9.5, and 10.0.
Here are the red blood cell counts (in cells per microlitre) of a healthy person measured on each of 15 days: 5.6, 5.4, 5.2, 5.4, 5.7, 5.5, 5.6, 5.4, 5.3, 5.5, 5.5, 5.1, 5.6, 5.4, and 5.4. Find a 95% confidence interval estimate of the true mean red blood cell count for this person during the period of testing.
The following 10 observations are interest rates on unpaid balances on credit cards for a department store: 10.4, 10.1, 9.5, 10.5, 10.6, 9.3, 9.9, 10.7, 9.5, and 10.0.
Here are the red blood cell counts (in
cells per microlitre) of a healthy person measured on each of 15 days: 5.6, 5.4, 5.2, 5.4, 5.7, 5.5, 5.6, 5.4, 5.3, 5.5, 5.5, 5.1, 5.6, 5.4, and 5.4. Find a 95% confidence interval estimate of the true mean red blood cell count for this person during the period of testing. Question
Hourly Wages Narrative
A random sample of 15 hourly wages for waitresses (including tips) was drawn from a normal population. The sample mean and sample standard deviation were computed as = $14.9 and s = $6.75.
Refer to Hourly Wages Narrative. Can we infer at the 5% significance level that the population mean is greater than 12, assuming that you know the population standard deviation is equal to 6.75? Give reasons for your answer.
A random sample of 15 hourly wages for waitresses (including tips) was drawn from a normal population. The sample mean and sample standard deviation were computed as
= $14.9 and s = $6.75.Refer to Hourly Wages Narrative. Can we infer at the 5% significance level that the population mean is greater than 12, assuming that you know the population standard deviation is equal to 6.75? Give reasons for your answer.
Question
Question
Laptop Battery Charge Time Narrative
A computer laboratory manager was in charge of purchasing new battery packs for her lab of laptop computers. She narrowed her choices to two models that were available for her machines. Since the models cost about the same, she was interested in determining whether there was a difference in the average time the battery packs would function before needing to be recharged. She took two independent random samples and computed the following summary information:
Refer to Laptop Battery Charge Time Narrative. Perform the appropriate test of hypotheses to determine whether there is a significant difference in average functioning time before recharging between the two models of battery packs. Test using = 0.05.
A computer laboratory manager was in charge of purchasing new battery packs for her lab of laptop computers. She narrowed her choices to two models that were available for her machines. Since the models cost about the same, she was interested in determining whether there was a difference in the average time the battery packs would function before needing to be recharged. She took two independent random samples and computed the following summary information:
Refer to Laptop Battery Charge Time Narrative. Perform the appropriate test of hypotheses to determine whether there is a significant difference in average functioning time before recharging between the two models of battery packs. Test using
= 0.05. Question
Grocery Receipts Narrative
A simple random sample of 100 grocery receipts was drawn from a normal population. The mean and standard deviation of the sample were $120 and $25, respectively.
Refer to Grocery Receipts Narrative. Test the hypothesis vs.
vs.  at the 10% significance level.
A simple random sample of 100 grocery receipts was drawn from a normal population. The mean and standard deviation of the sample were $120 and $25, respectively.
Refer to Grocery Receipts Narrative. Test the hypothesis
vs. at the 10% significance level. Question
In an effort to raise ratings, a television network president decides to reduce the number of commercials. A random sample of eight one-hour programs was monitored from each of two major networks. The data below reflect the time in minutes of commercials for each of the 16 shows. Suppose  denotes the mean commercial time for network 1 and
  denotes the mean commercial time for network 2. Estimate
  -
-  using a 95% confidence interval. Assume both population distributions are normal and have equal variances.
denotes the mean commercial time for network 1 and denotes the mean commercial time for network 2. Estimate - using a 95% confidence interval. Assume both population distributions are normal and have equal variances. Question
Laptop Battery Charge Time Narrative
A computer laboratory manager was in charge of purchasing new battery packs for her lab of laptop computers. She narrowed her choices to two models that were available for her machines. Since the models cost about the same, she was interested in determining whether there was a difference in the average time the battery packs would function before needing to be recharged. She took two independent random samples and computed the following summary information:
-Refer to Laptop Battery Charge Time Narrative. Is it reasonable to assume equality of variances in this ? Justify your answer.
Question
Average Telephone Time on Hold Narrative
A customer service representative was interested in comparing the average time (in minutes) customers are placed on hold when calling Gaz Metropolitain and Hydro-Quebec, both in Quebec. The representative obtained two independent random samples and calculated the following summary information: Assume the distributions of time a customer is on hold are approximately normal.
Refer to Average Telephone Time on Hold Narrative. State the appropriate null and alternative hypotheses to test whether there is a significant difference between the two companies in average time a customer is on hold.
A customer service representative was interested in comparing the average time (in minutes) customers are placed on hold when calling Gaz Metropolitain and Hydro-Quebec, both in Quebec. The representative obtained two independent random samples and calculated the following summary information:
Assume the distributions of time a customer is on hold are approximately normal.Refer to Average Telephone Time on Hold Narrative. State the appropriate null and alternative hypotheses to test whether there is a significant difference between the two companies in average time a customer is on hold.
Question
Laptop Battery Charge Time Narrative
A computer laboratory manager was in charge of purchasing new battery packs for her lab of laptop computers. She narrowed her choices to two models that were available for her machines. Since the models cost about the same, she was interested in determining whether there was a difference in the average time the battery packs would function before needing to be recharged. She took two independent random samples and computed the following summary information:
Refer to Laptop Battery Charge Time Narrative. Use = 0.05 to test the hypothesis that the two population variances are equal.
A computer laboratory manager was in charge of purchasing new battery packs for her lab of laptop computers. She narrowed her choices to two models that were available for her machines. Since the models cost about the same, she was interested in determining whether there was a difference in the average time the battery packs would function before needing to be recharged. She took two independent random samples and computed the following summary information:
Refer to Laptop Battery Charge Time Narrative. Use
= 0.05 to test the hypothesis that the two population variances are equal. Question
Laptop Battery Charge Time Narrative
A computer laboratory manager was in charge of purchasing new battery packs for her lab of laptop computers. She narrowed her choices to two models that were available for her machines. Since the models cost about the same, she was interested in determining whether there was a difference in the average time the battery packs would function before needing to be recharged. She took two independent random samples and computed the following summary information:
Set up the rejection regions for the following testing conditions. Assume the assumptions of normality and equal variances are satisfied.
a. .
.  = 10,
= 10,  = 12, and
  = 0.05.
b. .
.  = 4,
= 4,  = 8, and
  = 0.01.
c.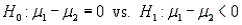 .
.  = 15,
= 15,  = 15, and
  = 0.05.
A computer laboratory manager was in charge of purchasing new battery packs for her lab of laptop computers. She narrowed her choices to two models that were available for her machines. Since the models cost about the same, she was interested in determining whether there was a difference in the average time the battery packs would function before needing to be recharged. She took two independent random samples and computed the following summary information:
Set up the rejection regions for the following testing conditions. Assume the assumptions of normality and equal variances are satisfied.
a.
. = 10, = 12, and = 0.05. b.
. = 4, = 8, and = 0.01. c.
. = 15, = 15, and = 0.05. Question
Assume that the population distributions of times (in minutes) for two different skiers to race the same course are normal with equal variances. Two random samples, drawn independently from the populations, showed the following statistics:  = 4,
= 4,  = 7.52,
  = 0.25;
  = 5,
= 5,  = 8.37, and
  = 0.09. Construct and interpret a 95% confidence interval for the true difference in average time of skiers to race the same course.
= 4, = 7.52, = 0.25; = 5, = 8.37, and = 0.09. Construct and interpret a 95% confidence interval for the true difference in average time of skiers to race the same course. Question
Studying Time Narrative
A faculty advisor was interested in determining whether there is a difference between male and female students in the amount of time (in hours) spent studying on weeknights (Monday through Thursday). The advisor selected a random sample of 12 female students and a second random, but independent, sample of 10 male students and asked each student to indicate the average amount of time spent studying on a weeknight. The following summary statistics are obtained.
Refer to Studying Time Narrative. Develop a 95% confidence interval for the average amount of time spent studying on weeknights by females.
Question
Assume that the population distributions of times (in hours) of two different surgeries are normal with equal variances. Two random samples, drawn independently from the populations, showed the following statistics.  = 10,
= 10,  = 2.5,
  = 0.04
  = 11,
= 11,  = 2.6,
  = 0.09
Construct and interpret a 90% confidence interval for the true difference in mean amount of time of the two surgeries.
= 10, = 2.5, = 0.04 = 11, = 2.6, = 0.09Construct and interpret a 90% confidence interval for the true difference in mean amount of time of the two surgeries.
Question
Studying Time Narrative
A faculty advisor was interested in determining whether there is a difference between male and female students in the amount of time (in hours) spent studying on weeknights (Monday through Thursday). The advisor selected a random sample of 12 female students and a second random, but independent, sample of 10 male students and asked each student to indicate the average amount of time spent studying on a weeknight. The following summary statistics are obtained.
-Refer to Studying Time Narrative. Using the p-value approach and = 0.10, what conclusion can be drawn about the difference between male and female students in average time spent studying on weeknights?
Question
Average Telephone Time on Hold Narrative
A customer service representative was interested in comparing the average time (in minutes) customers are placed on hold when calling Gaz Metropolitain and Hydro-Quebec, both in Quebec. The representative obtained two independent random samples and calculated the following summary information: Assume the distributions of time a customer is on hold are approximately normal.
Refer to Average Telephone Time on Hold Narrative. What is the appropriate conclusion? Justify your answer.
A customer service representative was interested in comparing the average time (in minutes) customers are placed on hold when calling Gaz Metropolitain and Hydro-Quebec, both in Quebec. The representative obtained two independent random samples and calculated the following summary information:
Assume the distributions of time a customer is on hold are approximately normal.Refer to Average Telephone Time on Hold Narrative. What is the appropriate conclusion? Justify your answer.
Question
Studying Time Narrative
A faculty advisor was interested in determining whether there is a difference between male and female students in the amount of time (in hours) spent studying on weeknights (Monday through Thursday). The advisor selected a random sample of 12 female students and a second random, but independent, sample of 10 male students and asked each student to indicate the average amount of time spent studying on a weeknight. The following summary statistics are obtained.
Refer to Studying Time Narrative. Approximate the p-value for the test in the above question.
Question
Studying Time Narrative
A faculty advisor was interested in determining whether there is a difference between male and female students in the amount of time (in hours) spent studying on weeknights (Monday through Thursday). The advisor selected a random sample of 12 female students and a second random, but independent, sample of 10 male students and asked each student to indicate the average amount of time spent studying on a weeknight. The following summary statistics are obtained.
Refer to Studying Time Narrative. State the null and alternative hypotheses for the advisor.
Question
Average Telephone Time on Hold Narrative
A customer service representative was interested in comparing the average time (in minutes) customers are placed on hold when calling Gaz Metropolitain and Hydro-Quebec, both in Quebec. The representative obtained two independent random samples and calculated the following summary information: Assume the distributions of time a customer is on hold are approximately normal.
Refer to Average Telephone Time on Hold Narrative. Set up the appropriate rejection region for the hypotheses above, assuming = 0.10.
A customer service representative was interested in comparing the average time (in minutes) customers are placed on hold when calling Gaz Metropolitain and Hydro-Quebec, both in Quebec. The representative obtained two independent random samples and calculated the following summary information:
Assume the distributions of time a customer is on hold are approximately normal.Refer to Average Telephone Time on Hold Narrative. Set up the appropriate rejection region for the hypotheses above, assuming
= 0.10. Question
Average Telephone Time on Hold Narrative
A customer service representative was interested in comparing the average time (in minutes) customers are placed on hold when calling Gaz Metropolitain and Hydro-Quebec, both in Quebec. The representative obtained two independent random samples and calculated the following summary information: Assume the distributions of time a customer is on hold are approximately normal.
Refer to Average Telephone Time on Hold Narrative. Use = 0.10 to test the hypotheses that the two population variances are equal.
A customer service representative was interested in comparing the average time (in minutes) customers are placed on hold when calling Gaz Metropolitain and Hydro-Quebec, both in Quebec. The representative obtained two independent random samples and calculated the following summary information:
Assume the distributions of time a customer is on hold are approximately normal.Refer to Average Telephone Time on Hold Narrative. Use
= 0.10 to test the hypotheses that the two population variances are equal. Question
Average Telephone Time on Hold Narrative
A customer service representative was interested in comparing the average time (in minutes) customers are placed on hold when calling Gaz Metropolitain and Hydro-Quebec, both in Quebec. The representative obtained two independent random samples and calculated the following summary information: Assume the distributions of time a customer is on hold are approximately normal.
Refer to Average Telephone Time on Hold Narrative. Is it reasonable to assume equality of variances in this ? Justify your answer.
A customer service representative was interested in comparing the average time (in minutes) customers are placed on hold when calling Gaz Metropolitain and Hydro-Quebec, both in Quebec. The representative obtained two independent random samples and calculated the following summary information:
Assume the distributions of time a customer is on hold are approximately normal.Refer to Average Telephone Time on Hold Narrative. Is it reasonable to assume equality of variances in this ? Justify your answer.
Question
The mean playing times (in hours) for five different co-ed volleyball games for two different teams are listed below. Is there sufficient evidence to conclude the mean playing time for the two teams differ? Justify your answer. Assume the population distributions are normal and  . Use a 0.05 significance level.
. Use a 0.05 significance level. Question
Studying Time Narrative
A faculty advisor was interested in determining whether there is a difference between male and female students in the amount of time (in hours) spent studying on weeknights (Monday through Thursday). The advisor selected a random sample of 12 female students and a second random, but independent, sample of 10 male students and asked each student to indicate the average amount of time spent studying on a weeknight. The following summary statistics are obtained.
Refer to Studying Time Narrative. Perform the appropriate test of hypothesis to determine whether there is a significant difference between male and female students in average time spent studying on weeknights. Use = 0.05.
A faculty advisor was interested in determining whether there is a difference between male and female students in the amount of time (in hours) spent studying on weeknights (Monday through Thursday). The advisor selected a random sample of 12 female students and a second random, but independent, sample of 10 male students and asked each student to indicate the average amount of time spent studying on a weeknight. The following summary statistics are obtained.
Refer to Studying Time Narrative. Perform the appropriate test of hypothesis to determine whether there is a significant difference between male and female students in average time spent studying on weeknights. Use
= 0.05. Question
Average Telephone Time on Hold Narrative
A customer service representative was interested in comparing the average time (in minutes) customers are placed on hold when calling Gaz Metropolitain and Hydro-Quebec, both in Quebec. The representative obtained two independent random samples and calculated the following summary information: Assume the distributions of time a customer is on hold are approximately normal.
Refer to Average Telephone Time on Hold Narrative. Calculate the value of the test statistic.
A customer service representative was interested in comparing the average time (in minutes) customers are placed on hold when calling Gaz Metropolitain and Hydro-Quebec, both in Quebec. The representative obtained two independent random samples and calculated the following summary information:
Assume the distributions of time a customer is on hold are approximately normal.Refer to Average Telephone Time on Hold Narrative. Calculate the value of the test statistic.
Question
Assume that the population distributions of life expectancy (in years) of men and women are normal with equal variances. Two random samples, drawn independently from the populations, showed the following statistics.
Men: = 10,
= 10,  = 76,
= 76,  = 1
= 1
Women: = 10,
= 10,  = 83,
= 83,  = 4
= 4
Construct and interpret a 99% confidence interval for the true difference in average life expectancy of men and women.
Men:
= 10, = 76, = 1Women:
= 10, = 83, = 4Construct and interpret a 99% confidence interval for the true difference in average life expectancy of men and women.
Question

Unlock Deck
Sign up to unlock the cards in this deck!
Unlock Deck
Unlock Deck
1/124
Play
Full screen (f)
Deck 10: B: Inference From Small Samples
1
Vertical Blinds Installation Narrative
A drapery store manager was interested in determining whether a new employee can install vertical blinds faster than an employee who has been with the company for two years. The manager takes independent samples of ten vertical blind installations of each of the two employees and computes the following information.
Refer to Vertical Blinds Installation Narrative. Calculate the value of the test statistic.
The test statistic is 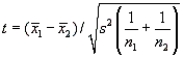 = (22.2 - 24.8)/0.3705 = -7.018.
= (22.2 - 24.8)/0.3705 = -7.018. 2
Vertical Blinds Installation Narrative
A drapery store manager was interested in determining whether a new employee can install vertical blinds faster than an employee who has been with the company for two years. The manager takes independent samples of ten vertical blind installations of each of the two employees and computes the following information.
Refer to Vertical Blinds Installation Narrative. Use = 0.05 to test the hypothesis that the two population variances are equal.
A drapery store manager was interested in determining whether a new employee can install vertical blinds faster than an employee who has been with the company for two years. The manager takes independent samples of ten vertical blind installations of each of the two employees and computes the following information.
Refer to Vertical Blinds Installation Narrative. Use
= 0.05 to test the hypothesis that the two population variances are equal.The hypothesis to be tested are 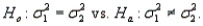 The observed value of the test statistic is F =
 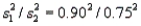 = 1.44. The rejection region is F >
  = 4.03. Since F = 1.44, we fail to reject
  , and we conclude that the population variances are equal.
The observed value of the test statistic is F = = 1.44. The rejection region is F > = 4.03. Since F = 1.44, we fail to reject , and we conclude that the population variances are equal. 3
Average Battery Life Narrative
The average life of a certain type and brand of battery is 75 weeks. The average life of each of nine randomly selected batteries is as follows: 74.5, 75.0, 72.3, 76.0, 75.2, 75.1, 75.3, 74.9, and 74.8. Assume the battery life distribution is normal. Do the sample data suggest the average life is smaller than 75 weeks?
Refer to Average Battery Life Narrative. Compute the approximate p-value associated with the test statistic in question 54. Do the sample data support the alternative hypothesis at the = 0.05 level? Justify your conclusion.
The average life of a certain type and brand of battery is 75 weeks. The average life of each of nine randomly selected batteries is as follows: 74.5, 75.0, 72.3, 76.0, 75.2, 75.1, 75.3, 74.9, and 74.8. Assume the battery life distribution is normal. Do the sample data suggest the average life is smaller than 75 weeks?
Refer to Average Battery Life Narrative. Compute the approximate p-value associated with the test statistic in question 54. Do the sample data support the alternative hypothesis at the
= 0.05 level? Justify your conclusion.p-value = P( t < -0.62) = P( t > 0.62) > 0.10. No; the sample data do not support the alternative hypothesis at the 0.05 level, since p-value >  and
and  is not rejected.
and is not rejected. 4
Vertical Blinds Installation Narrative
A drapery store manager was interested in determining whether a new employee can install vertical blinds faster than an employee who has been with the company for two years. The manager takes independent samples of ten vertical blind installations of each of the two employees and computes the following information.
Refer to Vertical Blinds Installation Narrative. State the appropriate null and alternative hypotheses to test whether the new employee installs vertical blinds faster, on the average, than the veteran employee.
Unlock Deck
Unlock for access to all 124 flashcards in this deck.
Unlock Deck
k this deck
5
Average Fuel Consumption
The average fuel consumption of a 4-wheel drive truck is 12.9 L/100 km. The average fuel consumption for seven randomly selected trucks is 13.5, 13.0, 12.6, 12.2, 12.8, 12.9, and 13.1. Assume the fuel consumption distribution is normal. The researcher wishes to know if the sample data suggest that the average fuel consumption is different from 12.9 L/100 km.
Please refer to the Average Fuel Consumption paragraph. State the appropriate hypotheses.
Unlock Deck
Unlock for access to all 124 flashcards in this deck.
Unlock Deck
k this deck
6
Earthquake Analysis Narrative
The length of duration, in minutes, of earthquakes in British Columbia has been recorded for future analysis and information. The length of duration of a random sample of six earthquakes is as follows: 1.1, 0.9, 1.5, 0.7, 1.4, and 1.3.
Refer to Earthquake Analysis Narrative. Interpret the interval in the previous question.
Unlock Deck
Unlock for access to all 124 flashcards in this deck.
Unlock Deck
k this deck
7
Vertical Blinds Installation Narrative
A drapery store manager was interested in determining whether a new employee can install vertical blinds faster than an employee who has been with the company for two years. The manager takes independent samples of ten vertical blind installations of each of the two employees and computes the following information.
-Refer to Vertical Blinds Installation Narrative. Set up the appropriate rejection region for the hypotheses above and assume = 0.05.
Unlock Deck
Unlock for access to all 124 flashcards in this deck.
Unlock Deck
k this deck
8
What is the appropriate t critical value for each of the following confidence levels and sample sizes when testing the two-sided alternative hypothesis?
a. 80% confidence, n = 17
b. 90% confidence, n = 7
c. 99% confidence, n = 4
d. 95% confidence, n = 14
a. 80% confidence, n = 17
b. 90% confidence, n = 7
c. 99% confidence, n = 4
d. 95% confidence, n = 14
Unlock Deck
Unlock for access to all 124 flashcards in this deck.
Unlock Deck
k this deck
9
Average Fuel Consumption
The average fuel consumption of a 4-wheel drive truck is 12.9 L/100 km. The average fuel consumption for seven randomly selected trucks is 13.5, 13.0, 12.6, 12.2, 12.8, 12.9, and 13.1. Assume the fuel consumption distribution is normal. The researcher wishes to know if the sample data suggest that the average fuel consumption is different from 12.9 L/100 km.
Please refer to the Average Fuel Consumption paragraph. Compute the test statistic for the hypotheses in the previous question.
Unlock Deck
Unlock for access to all 124 flashcards in this deck.
Unlock Deck
k this deck
10
Vertical Blinds Installation Narrative
A drapery store manager was interested in determining whether a new employee can install vertical blinds faster than an employee who has been with the company for two years. The manager takes independent samples of ten vertical blind installations of each of the two employees and computes the following information.
-Refer to Vertical Blinds Installation Narrative. What is the appropriate conclusion? Give reasons for your answer.
Unlock Deck
Unlock for access to all 124 flashcards in this deck.
Unlock Deck
k this deck
11
Average Battery Life Narrative
The average life of a certain type and brand of battery is 75 weeks. The average life of each of nine randomly selected batteries is as follows: 74.5, 75.0, 72.3, 76.0, 75.2, 75.1, 75.3, 74.9, and 74.8. Assume the battery life distribution is normal. Do the sample data suggest the average life is smaller than 75 weeks?
Refer to Average Battery Life Narrative. Compute the test statistic for the hypotheses in the previous question.
Unlock Deck
Unlock for access to all 124 flashcards in this deck.
Unlock Deck
k this deck
12
Vertical Blinds Installation Narrative
A drapery store manager was interested in determining whether a new employee can install vertical blinds faster than an employee who has been with the company for two years. The manager takes independent samples of ten vertical blind installations of each of the two employees and computes the following information.
Refer to Vertical Blinds Installation Narrative. Is it reasonable to assume equality of variances in this ? Justify your answer.
Unlock Deck
Unlock for access to all 124 flashcards in this deck.
Unlock Deck
k this deck
13
Vertical Blinds Installation Narrative
A drapery store manager was interested in determining whether a new employee can install vertical blinds faster than an employee who has been with the company for two years. The manager takes independent samples of ten vertical blind installations of each of the two employees and computes the following information.
-A logger knows the average time for his cutting machine to cut 20 trees is 9.8 minutes. A new machine on the market claims to cut the trees in less than 9.8 minutes. A random sample of 25 test runs on the new machine yielded a mean of 8.5 minutes with a standard deviation of 1.5. Do the sample data suggest the new machine cuts faster than the logger's machine? Test at the = 0.05 level. Assume the cutting time is normally distributed and interpret your results.
Unlock Deck
Unlock for access to all 124 flashcards in this deck.
Unlock Deck
k this deck
14
Given a random variable that has a t distribution with the specified degrees of freedom, in each of the following cases what percentage of the time will its value fall in the indicated region?
a. 15 degrees of freedom, between -2.131 and 2.131
b. 19 degrees of freedom, between -2.539 and 2.539
c. 23 degrees of freedom, between -1.319 and 1.319
d. 10 degrees of freedom, between -3.169 and 3.169
a. 15 degrees of freedom, between -2.131 and 2.131
b. 19 degrees of freedom, between -2.539 and 2.539
c. 23 degrees of freedom, between -1.319 and 1.319
d. 10 degrees of freedom, between -3.169 and 3.169
Unlock Deck
Unlock for access to all 124 flashcards in this deck.
Unlock Deck
k this deck
15
Let denote the true average number of minutes of a television commercial. Suppose the hypotheses are tested. Assuming the commercial time is normally distributed, give the appropriate rejection region for each of the following sample sizes and significance levels.
a. n = 6, = 0.01
b. n = 12, = 0.05
c. n = 20, = 0.05
d. n = 23, = 0.1
are tested. Assuming the commercial time is normally distributed, give the appropriate rejection region for each of the following sample sizes and significance levels. a. n = 6,
= 0.01 b. n = 12,
= 0.05 c. n = 20,
= 0.05 d. n = 23,
= 0.1 Unlock Deck
Unlock for access to all 124 flashcards in this deck.
Unlock Deck
k this deck
16
Earthquake Analysis Narrative
The length of duration, in minutes, of earthquakes in British Columbia has been recorded for future analysis and information. The length of duration of a random sample of six earthquakes is as follows: 1.1, 0.9, 1.5, 0.7, 1.4, and 1.3.
Refer to Earthquake Analysis Narrative. Assuming the distribution of the length of duration of the earthquakes is approximately normal, find a 98% confidence interval for the true average duration of earthquakes in British Columbia.
Unlock Deck
Unlock for access to all 124 flashcards in this deck.
Unlock Deck
k this deck
17
Average Battery Life Narrative
The average life of a certain type and brand of battery is 75 weeks. The average life of each of nine randomly selected batteries is as follows: 74.5, 75.0, 72.3, 76.0, 75.2, 75.1, 75.3, 74.9, and 74.8. Assume the battery life distribution is normal. Do the sample data suggest the average life is smaller than 75 weeks?
Refer to Average Battery Life Narrative. State the appropriate hypotheses.
Unlock Deck
Unlock for access to all 124 flashcards in this deck.
Unlock Deck
k this deck
18
Vertical Blinds Installation Narrative
A drapery store manager was interested in determining whether a new employee can install vertical blinds faster than an employee who has been with the company for two years. The manager takes independent samples of ten vertical blind installations of each of the two employees and computes the following information.
Refer to Vertical Blinds Installation Narrative. Calculate the pooled estimate of the common variance
Unlock Deck
Unlock for access to all 124 flashcards in this deck.
Unlock Deck
k this deck
19
Average Fuel Consumption
The average fuel consumption of a 4-wheel drive truck is 12.9 L/100 km. The average fuel consumption for seven randomly selected trucks is 13.5, 13.0, 12.6, 12.2, 12.8, 12.9, and 13.1. Assume the fuel consumption distribution is normal. The researcher wishes to know if the sample data suggest that the average fuel consumption is different from 12.9 L/100 km.
Please refer to the Average Fuel Consumption paragraph. Compute the approximate p-value associated with the test statistic in the previous question. Do the sample data support the null hypothesis at the = 0.05 level? Justify your conclusion.
The average fuel consumption of a 4-wheel drive truck is 12.9 L/100 km. The average fuel consumption for seven randomly selected trucks is 13.5, 13.0, 12.6, 12.2, 12.8, 12.9, and 13.1. Assume the fuel consumption distribution is normal. The researcher wishes to know if the sample data suggest that the average fuel consumption is different from 12.9 L/100 km.
Please refer to the Average Fuel Consumption paragraph. Compute the approximate p-value associated with the test statistic in the previous question. Do the sample data support the null hypothesis at the
= 0.05 level? Justify your conclusion. Unlock Deck
Unlock for access to all 124 flashcards in this deck.
Unlock Deck
k this deck
20
Earthquake Analysis Narrative
The length of duration, in minutes, of earthquakes in British Columbia has been recorded for future analysis and information. The length of duration of a random sample of six earthquakes is as follows: 1.1, 0.9, 1.5, 0.7, 1.4, and 1.3.
Refer to Earthquake Analysis Narrative. An earthquake expert claims that the average duration of earthquakes in British Columbia is 0.5 minutes. Based on the interval calculated above, can this claim be rejected? Justify your answer.
Unlock Deck
Unlock for access to all 124 flashcards in this deck.
Unlock Deck
k this deck
21
Cigarette Tar Content Narrative
Ten measurements of the tar content of a certain brand of cigarette are 13.5, 14.0, 13.9, 14.2, 15.1, 14.6, 13.8, 14.0, 14.1, and 14.7 in milligrams per cigarette. Assume these measurements were taken from a population with a normal distribution.
One study revealed a child under the age of 10 watches television 4.5 hours per day. A group of families from a certain community would like to believe that their children watch less television than the national average. A random sample of 14 children from the community yielded a mean of 4.1 hours per day with a standard deviation of 1.2. Test the appropriate hypotheses at the = 0.01 level. Assume the viewing time is normally distributed and interpret your results.
Ten measurements of the tar content of a certain brand of cigarette are 13.5, 14.0, 13.9, 14.2, 15.1, 14.6, 13.8, 14.0, 14.1, and 14.7 in milligrams per cigarette. Assume these measurements were taken from a population with a normal distribution.
One study revealed a child under the age of 10 watches television 4.5 hours per day. A group of families from a certain community would like to believe that their children watch less television than the national average. A random sample of 14 children from the community yielded a mean of 4.1 hours per day with a standard deviation of 1.2. Test the appropriate hypotheses at the
= 0.01 level. Assume the viewing time is normally distributed and interpret your results. Unlock Deck
Unlock for access to all 124 flashcards in this deck.
Unlock Deck
k this deck
22
Manufacturing Garment Average Narrative
A garment manufacturing company recorded the amount of time that it took to make a pair of jeans on eight different occasions. The times in minutes are as follows: 12.5, 13.0, 11.9, 10.2, 13.1, 13.6, 13.8, and 14.0. Assume these measurements were taken from a population with a normal distribution. Do the sample data suggest that the average time it takes this company to make a pair of jeans is less than 13.5 minutes?
Refer to Manufacturing Garment Average Narrative. Compute the test statistic for the hypotheses in the previous question.
Unlock Deck
Unlock for access to all 124 flashcards in this deck.
Unlock Deck
k this deck
23
Childcare Costs Narrative
The public relations officer for a particular city claims the average monthly cost for childcare outside the home for a single child is $600. A potential resident is interested in whether the claim is correct. She obtains a random sample of 14 records and computes the average monthly cost of this type of childcare to be $589 with a standard deviation of $40.
-Refer to Childcare Costs Narrative. Approximate the p-value for the test in the previous question.
Unlock Deck
Unlock for access to all 124 flashcards in this deck.
Unlock Deck
k this deck
24
Motorcycle Fuel Consumption Narrative
A Harley Davidson dealer wants to know the average fuel consumption (in litres per 100 km) of a 1992 XLT. A random sample of 17 was taken from a normally distributed population and produced a mean of 4.5 L/100 km and a standard deviation of 0.36 L/100 km.
Refer to Motorcycle Fuel Consumption Narrative. Construct a 95 percent confidence interval for the mean fuel consumption of any 1992 Harley Davidson XLT.
Unlock Deck
Unlock for access to all 124 flashcards in this deck.
Unlock Deck
k this deck
25
Temperature Average Narrative
The average low temperature for Victoria, B.C. in September is 12°C. The average low temperature for each of eight randomly selected years is 11.0, 12.4, 11.8, 10.9, 11.4, 12.2, 10.8, and 12.2. Assume the September low temperature distribution is normal. Do the sample data suggest the average low temperature is lower than 12°C?
Refer to Temperature Average Narrative. State the appropriate hypotheses.
Unlock Deck
Unlock for access to all 124 flashcards in this deck.
Unlock Deck
k this deck
26
Laptop Battery Average Narrative
The manufacturer of a particular battery pack for laptop computers claims its battery pack can function for 8 hours, on average, before having to be recharged. A random sample of 16 battery packs was selected and tested. The mean functioning time before having to be recharged was 7.2 hours with a standard deviation of 1.9 hours.
Refer to Laptop Battery Average Narrative. Assuming the distribution of functioning times is approximately normal, find a 95% confidence interval for the true average functioning time before needing to be recharged.
Unlock Deck
Unlock for access to all 124 flashcards in this deck.
Unlock Deck
k this deck
27
Coffee Vending Machines Narrative
An automatic coffee vending machine dispenses a different amount of coffee in millilitres (mL) for each cup. Assume the following nine measurements were taken from a population with a normal distribution: 185, 170, 196, 176, 173, 187, 193, 170 and 173 mL.
Refer to Coffee Vending Machines Narrative. Interpret the interval in the previous question.
Unlock Deck
Unlock for access to all 124 flashcards in this deck.
Unlock Deck
k this deck
28
Cigarette Tar Content Narrative
Ten measurements of the tar content of a certain brand of cigarette are 13.5, 14.0, 13.9, 14.2, 15.1, 14.6, 13.8, 14.0, 14.1, and 14.7 in milligrams per cigarette. Assume these measurements were taken from a population with a normal distribution.
Refer to Cigarette Tar Content Narrative. Construct a 90% confidence interval for the mean tar content of any cigarette of this brand.
Unlock Deck
Unlock for access to all 124 flashcards in this deck.
Unlock Deck
k this deck
29
Laptop Battery Average Narrative
The manufacturer of a particular battery pack for laptop computers claims its battery pack can function for 8 hours, on average, before having to be recharged. A random sample of 16 battery packs was selected and tested. The mean functioning time before having to be recharged was 7.2 hours with a standard deviation of 1.9 hours.
Refer to Laptop Battery Average Narrative. Based on the interval calculated above, can the manufacturer's claim be rejected? Justify your answer.
Unlock Deck
Unlock for access to all 124 flashcards in this deck.
Unlock Deck
k this deck
30
Cigarette Tar Content Narrative
Ten measurements of the tar content of a certain brand of cigarette are 13.5, 14.0, 13.9, 14.2, 15.1, 14.6, 13.8, 14.0, 14.1, and 14.7 in milligrams per cigarette. Assume these measurements were taken from a population with a normal distribution.
Refer to Cigarette Tar Content Narrative. Interpret the interval in the previous question.
Unlock Deck
Unlock for access to all 124 flashcards in this deck.
Unlock Deck
k this deck
31
Motorcycle Fuel Consumption Narrative
A Harley Davidson dealer wants to know the average fuel consumption (in litres per 100 km) of a 1992 XLT. A random sample of 17 was taken from a normally distributed population and produced a mean of 4.5 L/100 km and a standard deviation of 0.36 L/100 km.
Refer to Motorcycle Fuel Consumption Narrative. Interpret the interval in the previous question.
Unlock Deck
Unlock for access to all 124 flashcards in this deck.
Unlock Deck
k this deck
32
Manufacturing Garment Average Narrative
A garment manufacturing company recorded the amount of time that it took to make a pair of jeans on eight different occasions. The times in minutes are as follows: 12.5, 13.0, 11.9, 10.2, 13.1, 13.6, 13.8, and 14.0. Assume these measurements were taken from a population with a normal distribution. Do the sample data suggest that the average time it takes this company to make a pair of jeans is less than 13.5 minutes?
Refer to Manufacturing Garment Average Narrative. Construct a 95% confidence interval for the mean amount of time it takes this company to make a pair of jeans.
Unlock Deck
Unlock for access to all 124 flashcards in this deck.
Unlock Deck
k this deck
33
Manufacturing Garment Average Narrative
A garment manufacturing company recorded the amount of time that it took to make a pair of jeans on eight different occasions. The times in minutes are as follows: 12.5, 13.0, 11.9, 10.2, 13.1, 13.6, 13.8, and 14.0. Assume these measurements were taken from a population with a normal distribution. Do the sample data suggest that the average time it takes this company to make a pair of jeans is less than 13.5 minutes?
Refer to Manufacturing Garment Average Narrative. Do the sample data support the alternative hypothesis at the = 0.05 level? Justify your conclusion.
A garment manufacturing company recorded the amount of time that it took to make a pair of jeans on eight different occasions. The times in minutes are as follows: 12.5, 13.0, 11.9, 10.2, 13.1, 13.6, 13.8, and 14.0. Assume these measurements were taken from a population with a normal distribution. Do the sample data suggest that the average time it takes this company to make a pair of jeans is less than 13.5 minutes?
Refer to Manufacturing Garment Average Narrative. Do the sample data support the alternative hypothesis at the
= 0.05 level? Justify your conclusion. Unlock Deck
Unlock for access to all 124 flashcards in this deck.
Unlock Deck
k this deck
34
Coffee Vending Machines Narrative
An automatic coffee vending machine dispenses a different amount of coffee in millilitres (mL) for each cup. Assume the following nine measurements were taken from a population with a normal distribution: 185, 170, 196, 176, 173, 187, 193, 170 and 173 mL.
Refer to Coffee Vending Machines Narrative. Construct an 80% confidence interval for the mean amount of coffee that is dispensed for all cups of coffee from this machine.
Unlock Deck
Unlock for access to all 124 flashcards in this deck.
Unlock Deck
k this deck
35
Temperature Average Narrative
The average low temperature for Victoria, B.C. in September is 12°C. The average low temperature for each of eight randomly selected years is 11.0, 12.4, 11.8, 10.9, 11.4, 12.2, 10.8, and 12.2. Assume the September low temperature distribution is normal. Do the sample data suggest the average low temperature is lower than 12°C?
Refer to Temperature Average Narrative. Compute the test statistic for the hypotheses in the previous question.
Unlock Deck
Unlock for access to all 124 flashcards in this deck.
Unlock Deck
k this deck
36
Laptop Battery Average Narrative
The manufacturer of a particular battery pack for laptop computers claims its battery pack can function for 8 hours, on average, before having to be recharged. A random sample of 16 battery packs was selected and tested. The mean functioning time before having to be recharged was 7.2 hours with a standard deviation of 1.9 hours.
Refer to Laptop Battery Average Narrative. Interpret the interval in the previous question.
Unlock Deck
Unlock for access to all 124 flashcards in this deck.
Unlock Deck
k this deck
37
Temperature Average Narrative
The average low temperature for Victoria, B.C. in September is 12°C. The average low temperature for each of eight randomly selected years is 11.0, 12.4, 11.8, 10.9, 11.4, 12.2, 10.8, and 12.2. Assume the September low temperature distribution is normal. Do the sample data suggest the average low temperature is lower than 12°C?
-Refer to Temperature Average Narrative. Compute the approximate p-value associated with the test statistic in the previous question. Do the sample data support the null hypothesis at the = 0.1 level? Justify your conclusion.
Unlock Deck
Unlock for access to all 124 flashcards in this deck.
Unlock Deck
k this deck
38
Motorcycle Fuel Consumption Narrative
A Harley Davidson dealer wants to know the average fuel consumption (in litres per 100 km) of a 1992 XLT. A random sample of 17 was taken from a normally distributed population and produced a mean of 4.5 L/100 km and a standard deviation of 0.36 L/100 km.
Refer to Motorcycle Fuel Consumption Narrative. The dealer claims that the average fuel consumption of a Harley Davidson 1992 XLT is 4.2 L/100 km. At a 95% level of confidence, can this claim be rejected? Justify your answer.
Unlock Deck
Unlock for access to all 124 flashcards in this deck.
Unlock Deck
k this deck
39
Childcare Costs Narrative
The public relations officer for a particular city claims the average monthly cost for childcare outside the home for a single child is $600. A potential resident is interested in whether the claim is correct. She obtains a random sample of 14 records and computes the average monthly cost of this type of childcare to be $589 with a standard deviation of $40.
Refer to Childcare Costs Narrative. Perform the appropriate test of hypothesis for the potential resident using = 0.01.
The public relations officer for a particular city claims the average monthly cost for childcare outside the home for a single child is $600. A potential resident is interested in whether the claim is correct. She obtains a random sample of 14 records and computes the average monthly cost of this type of childcare to be $589 with a standard deviation of $40.
Refer to Childcare Costs Narrative. Perform the appropriate test of hypothesis for the potential resident using
= 0.01. Unlock Deck
Unlock for access to all 124 flashcards in this deck.
Unlock Deck
k this deck
40
Manufacturing Garment Average Narrative
A garment manufacturing company recorded the amount of time that it took to make a pair of jeans on eight different occasions. The times in minutes are as follows: 12.5, 13.0, 11.9, 10.2, 13.1, 13.6, 13.8, and 14.0. Assume these measurements were taken from a population with a normal distribution. Do the sample data suggest that the average time it takes this company to make a pair of jeans is less than 13.5 minutes?
Refer to Manufacturing Garment Average Narrative. State the appropriate hypotheses.
Unlock Deck
Unlock for access to all 124 flashcards in this deck.
Unlock Deck
k this deck
41
Grocery Receipts Narrative
A simple random sample of 100 grocery receipts was drawn from a normal population. The mean and standard deviation of the sample were $120 and $25, respectively.
Refer to Grocery Receipts Narrative. Explain how to use the confidence interval to test the hypotheses at .
A simple random sample of 100 grocery receipts was drawn from a normal population. The mean and standard deviation of the sample were $120 and $25, respectively.
Refer to Grocery Receipts Narrative. Explain how to use the confidence interval to test the hypotheses at
. Unlock Deck
Unlock for access to all 124 flashcards in this deck.
Unlock Deck
k this deck
42
Interest Rates Narrative
The following 10 observations are interest rates on unpaid balances on credit cards for a department store: 10.4, 10.1, 9.5, 10.5, 10.6, 9.3, 9.9, 10.7, 9.5, and 10.0.
Refer to Interest Rates Narrative. Calculate the test statistic , specify the rejection region and then test the hypothesis . Use = 0.01.
The following 10 observations are interest rates on unpaid balances on credit cards for a department store: 10.4, 10.1, 9.5, 10.5, 10.6, 9.3, 9.9, 10.7, 9.5, and 10.0.
Refer to Interest Rates Narrative. Calculate the test statistic , specify the rejection region and then test the hypothesis
. Use = 0.01. Unlock Deck
Unlock for access to all 124 flashcards in this deck.
Unlock Deck
k this deck
43
Disinfectant Experiments Narrative
An experiment to determine the efficacy of using 95% ethanol or 20% bleach as a disinfectant in removing bacterial and fungal contamination when culturing plant tissues was repeated 15 times for each disinfectant. The plant tissue being cultured was sweet potato: Five cuttings per plant were placed on a petri dish for each disinfectant and stored at 25°C for four weeks. The observation reported was the number of uncontaminated eggplant cuttings after the four-week storage.
Disinfectant
Refer to Disinfectant Experiments Narrative. Using the information from the previous question, are you willing to conclude that there is a significant difference in the mean numbers of uncontaminated eggplants for the two disinfectants tested?
Unlock Deck
Unlock for access to all 124 flashcards in this deck.
Unlock Deck
k this deck
44
Test Scores Narrative
The test scores on a 100-point test were recorded for 20 students: 73, 95, 93, 83, 77, 75, 83, 84, 78, 59, 86, 91, 69, 64, 74, 79, 70, 67, 77, and 86.
Refer to Test Scores Narrative If these students can be considered a random sample from the population of all students, find a 95% confidence interval for the average test score in the population.
Unlock Deck
Unlock for access to all 124 flashcards in this deck.
Unlock Deck
k this deck
45
Test Scores Narrative
The test scores on a 100-point test were recorded for 20 students: 73, 95, 93, 83, 77, 75, 83, 84, 78, 59, 86, 91, 69, 64, 74, 79, 70, 67, 77, and 86.
Refer to Test Scores Narrative. Can you reasonably assume that these test scores have been selected from a normal population? Use a stem and leaf plot to justify your answer.
Unlock Deck
Unlock for access to all 124 flashcards in this deck.
Unlock Deck
k this deck
46
The following data were drawn from a normal population: 15, 4, 24, 8, 16, 13, 9, 15, 7, and 22. Estimate the population mean with 90% confidence.
Unlock Deck
Unlock for access to all 124 flashcards in this deck.
Unlock Deck
k this deck
47
A psychologist is trying to determine how many hours the average person sleeps each night. He takes a random sample of 25 individuals and asks each person how many hours he or she slept the previous night. The sum of the observations and the sum of the squared observations are 192.5 and 1531.7. Estimate with 99% confidence the mean number of hours of sleep.
192.5 and 1531.7. Estimate with 99% confidence the mean number of hours of sleep. Unlock Deck
Unlock for access to all 124 flashcards in this deck.
Unlock Deck
k this deck
48
Test Scores Narrative
The test scores on a 100-point test were recorded for 20 students: 73, 95, 93, 83, 77, 75, 83, 84, 78, 59, 86, 91, 69, 64, 74, 79, 70, 67, 77, and 86.
Refer to Test Scores Narrative Calculate the mean and standard deviation of the scores.
The test scores on a 100-point test were recorded for 20 students: 73, 95, 93, 83, 77, 75, 83, 84, 78, 59, 86, 91, 69, 64, 74, 79, 70, 67, 77, and 86.
Refer to Test Scores Narrative Calculate the mean and standard deviation of the scores.
Unlock Deck
Unlock for access to all 124 flashcards in this deck.
Unlock Deck
k this deck
49
During a water shortage, a water company randomly sampled residential water meters in order to monitor daily water consumption. On a particular day, a sample of 25 meters showed a sample mean of 750 litres and a sample standard deviation of 150 litres. Provide a 90% confidence interval estimate of the mean water consumption for the population.
Unlock Deck
Unlock for access to all 124 flashcards in this deck.
Unlock Deck
k this deck
50
Interest Rates Narrative
The following 10 observations are interest rates on unpaid balances on credit cards for a department store: 10.4, 10.1, 9.5, 10.5, 10.6, 9.3, 9.9, 10.7, 9.5, and 10.0.
Refer to Interest Rates Narrative. Find a 99% confidence interval for the population mean , and explain how to use it for testing vs. using
The following 10 observations are interest rates on unpaid balances on credit cards for a department store: 10.4, 10.1, 9.5, 10.5, 10.6, 9.3, 9.9, 10.7, 9.5, and 10.0.
Refer to Interest Rates Narrative. Find a 99% confidence interval for the population mean
, and explain how to use it for testing vs. using Unlock Deck
Unlock for access to all 124 flashcards in this deck.
Unlock Deck
k this deck
51
Grocery Receipts Narrative
A simple random sample of 100 grocery receipts was drawn from a normal population. The mean and standard deviation of the sample were $120 and $25, respectively.
Refer to Grocery Receipts Narrative. Estimate the population mean with 90% confidence.
A simple random sample of 100 grocery receipts was drawn from a normal population. The mean and standard deviation of the sample were $120 and $25, respectively.
Refer to Grocery Receipts Narrative. Estimate the population mean with 90% confidence.
Unlock Deck
Unlock for access to all 124 flashcards in this deck.
Unlock Deck
k this deck
52
Hourly Wages Narrative
A random sample of 15 hourly wages for waitresses (including tips) was drawn from a normal population. The sample mean and sample standard deviation were computed as = $14.9 and s = $6.75.
Refer to Hourly Wages Narrative. Can we infer at the 5% significance level that the population mean is greater than 12? Justify your conclusion.
A random sample of 15 hourly wages for waitresses (including tips) was drawn from a normal population. The sample mean and sample standard deviation were computed as
= $14.9 and s = $6.75.Refer to Hourly Wages Narrative. Can we infer at the 5% significance level that the population mean is greater than 12? Justify your conclusion.
Unlock Deck
Unlock for access to all 124 flashcards in this deck.
Unlock Deck
k this deck
53
Disinfectant Experiments Narrative
An experiment to determine the efficacy of using 95% ethanol or 20% bleach as a disinfectant in removing bacterial and fungal contamination when culturing plant tissues was repeated 15 times for each disinfectant. The plant tissue being cultured was sweet potato: Five cuttings per plant were placed on a petri dish for each disinfectant and stored at 25°C for four weeks. The observation reported was the number of uncontaminated eggplant cuttings after the four-week storage.
Disinfectant
Refer to Disinfectant Experiments Narrative. Is it reasonable to assume that the underlying variances are equal? Justify your conclusion.
Unlock Deck
Unlock for access to all 124 flashcards in this deck.
Unlock Deck
k this deck
54
Assume that the population distributions of ages (in years) of students at two different universities in Ontario are normal with equal variances. Two random samples, drawn independently from the populations, showed the following statistics: = 10, = 25, = 4; = 9, = 24, and = 9. Construct and interpret a 99% confidence interval for the true difference in average ages of students at each university.
= 10, = 25, = 4; = 9, = 24, and = 9. Construct and interpret a 99% confidence interval for the true difference in average ages of students at each university. Unlock Deck
Unlock for access to all 124 flashcards in this deck.
Unlock Deck
k this deck
55
A random sample of seven observations was drawn from a normal population. The following summations were computed: and . Test the hypothesis vs. at the 1% significance level.
and . Test the hypothesis vs. at the 1% significance level. Unlock Deck
Unlock for access to all 124 flashcards in this deck.
Unlock Deck
k this deck
56
Interest Rates Narrative
The following 10 observations are interest rates on unpaid balances on credit cards for a department store: 10.4, 10.1, 9.5, 10.5, 10.6, 9.3, 9.9, 10.7, 9.5, and 10.0.
Here are the red blood cell counts (in cells per microlitre) of a healthy person measured on each of 15 days: 5.6, 5.4, 5.2, 5.4, 5.7, 5.5, 5.6, 5.4, 5.3, 5.5, 5.5, 5.1, 5.6, 5.4, and 5.4. Find a 95% confidence interval estimate of the true mean red blood cell count for this person during the period of testing.
The following 10 observations are interest rates on unpaid balances on credit cards for a department store: 10.4, 10.1, 9.5, 10.5, 10.6, 9.3, 9.9, 10.7, 9.5, and 10.0.
Here are the red blood cell counts (in
cells per microlitre) of a healthy person measured on each of 15 days: 5.6, 5.4, 5.2, 5.4, 5.7, 5.5, 5.6, 5.4, 5.3, 5.5, 5.5, 5.1, 5.6, 5.4, and 5.4. Find a 95% confidence interval estimate of the true mean red blood cell count for this person during the period of testing. Unlock Deck
Unlock for access to all 124 flashcards in this deck.
Unlock Deck
k this deck
57
Hourly Wages Narrative
A random sample of 15 hourly wages for waitresses (including tips) was drawn from a normal population. The sample mean and sample standard deviation were computed as = $14.9 and s = $6.75.
Refer to Hourly Wages Narrative. Can we infer at the 5% significance level that the population mean is greater than 12, assuming that you know the population standard deviation is equal to 6.75? Give reasons for your answer.
A random sample of 15 hourly wages for waitresses (including tips) was drawn from a normal population. The sample mean and sample standard deviation were computed as
= $14.9 and s = $6.75.Refer to Hourly Wages Narrative. Can we infer at the 5% significance level that the population mean is greater than 12, assuming that you know the population standard deviation is equal to 6.75? Give reasons for your answer.
Unlock Deck
Unlock for access to all 124 flashcards in this deck.
Unlock Deck
k this deck
58
Interest Rates Narrative
The following 10 observations are interest rates on unpaid balances on credit cards for a department store: 10.4, 10.1, 9.5, 10.5, 10.6, 9.3, 9.9, 10.7, 9.5, and 10.0.
Refer to Interest Rates Narrative. Find the mean and standard deviation of these data.
The following 10 observations are interest rates on unpaid balances on credit cards for a department store: 10.4, 10.1, 9.5, 10.5, 10.6, 9.3, 9.9, 10.7, 9.5, and 10.0.
Refer to Interest Rates Narrative. Find the mean and standard deviation of these data.
Unlock Deck
Unlock for access to all 124 flashcards in this deck.
Unlock Deck
k this deck
59
Laptop Battery Charge Time Narrative
A computer laboratory manager was in charge of purchasing new battery packs for her lab of laptop computers. She narrowed her choices to two models that were available for her machines. Since the models cost about the same, she was interested in determining whether there was a difference in the average time the battery packs would function before needing to be recharged. She took two independent random samples and computed the following summary information:
Refer to Laptop Battery Charge Time Narrative. Perform the appropriate test of hypotheses to determine whether there is a significant difference in average functioning time before recharging between the two models of battery packs. Test using = 0.05.
A computer laboratory manager was in charge of purchasing new battery packs for her lab of laptop computers. She narrowed her choices to two models that were available for her machines. Since the models cost about the same, she was interested in determining whether there was a difference in the average time the battery packs would function before needing to be recharged. She took two independent random samples and computed the following summary information:
Refer to Laptop Battery Charge Time Narrative. Perform the appropriate test of hypotheses to determine whether there is a significant difference in average functioning time before recharging between the two models of battery packs. Test using
= 0.05. Unlock Deck
Unlock for access to all 124 flashcards in this deck.
Unlock Deck
k this deck
60
Grocery Receipts Narrative
A simple random sample of 100 grocery receipts was drawn from a normal population. The mean and standard deviation of the sample were $120 and $25, respectively.
Refer to Grocery Receipts Narrative. Test the hypothesis vs. at the 10% significance level.
A simple random sample of 100 grocery receipts was drawn from a normal population. The mean and standard deviation of the sample were $120 and $25, respectively.
Refer to Grocery Receipts Narrative. Test the hypothesis
vs. at the 10% significance level. Unlock Deck
Unlock for access to all 124 flashcards in this deck.
Unlock Deck
k this deck
61
In an effort to raise ratings, a television network president decides to reduce the number of commercials. A random sample of eight one-hour programs was monitored from each of two major networks. The data below reflect the time in minutes of commercials for each of the 16 shows. Suppose denotes the mean commercial time for network 1 and denotes the mean commercial time for network 2. Estimate - using a 95% confidence interval. Assume both population distributions are normal and have equal variances.
denotes the mean commercial time for network 1 and denotes the mean commercial time for network 2. Estimate - using a 95% confidence interval. Assume both population distributions are normal and have equal variances. Unlock Deck
Unlock for access to all 124 flashcards in this deck.
Unlock Deck
k this deck
62
Laptop Battery Charge Time Narrative
A computer laboratory manager was in charge of purchasing new battery packs for her lab of laptop computers. She narrowed her choices to two models that were available for her machines. Since the models cost about the same, she was interested in determining whether there was a difference in the average time the battery packs would function before needing to be recharged. She took two independent random samples and computed the following summary information:
-Refer to Laptop Battery Charge Time Narrative. Is it reasonable to assume equality of variances in this ? Justify your answer.
Unlock Deck
Unlock for access to all 124 flashcards in this deck.
Unlock Deck
k this deck
63
Average Telephone Time on Hold Narrative
A customer service representative was interested in comparing the average time (in minutes) customers are placed on hold when calling Gaz Metropolitain and Hydro-Quebec, both in Quebec. The representative obtained two independent random samples and calculated the following summary information: Assume the distributions of time a customer is on hold are approximately normal.
Refer to Average Telephone Time on Hold Narrative. State the appropriate null and alternative hypotheses to test whether there is a significant difference between the two companies in average time a customer is on hold.
A customer service representative was interested in comparing the average time (in minutes) customers are placed on hold when calling Gaz Metropolitain and Hydro-Quebec, both in Quebec. The representative obtained two independent random samples and calculated the following summary information:
Assume the distributions of time a customer is on hold are approximately normal.Refer to Average Telephone Time on Hold Narrative. State the appropriate null and alternative hypotheses to test whether there is a significant difference between the two companies in average time a customer is on hold.
Unlock Deck
Unlock for access to all 124 flashcards in this deck.
Unlock Deck
k this deck
64
Laptop Battery Charge Time Narrative
A computer laboratory manager was in charge of purchasing new battery packs for her lab of laptop computers. She narrowed her choices to two models that were available for her machines. Since the models cost about the same, she was interested in determining whether there was a difference in the average time the battery packs would function before needing to be recharged. She took two independent random samples and computed the following summary information:
Refer to Laptop Battery Charge Time Narrative. Use = 0.05 to test the hypothesis that the two population variances are equal.
A computer laboratory manager was in charge of purchasing new battery packs for her lab of laptop computers. She narrowed her choices to two models that were available for her machines. Since the models cost about the same, she was interested in determining whether there was a difference in the average time the battery packs would function before needing to be recharged. She took two independent random samples and computed the following summary information:
Refer to Laptop Battery Charge Time Narrative. Use
= 0.05 to test the hypothesis that the two population variances are equal. Unlock Deck
Unlock for access to all 124 flashcards in this deck.
Unlock Deck
k this deck
65
Laptop Battery Charge Time Narrative
A computer laboratory manager was in charge of purchasing new battery packs for her lab of laptop computers. She narrowed her choices to two models that were available for her machines. Since the models cost about the same, she was interested in determining whether there was a difference in the average time the battery packs would function before needing to be recharged. She took two independent random samples and computed the following summary information:
Set up the rejection regions for the following testing conditions. Assume the assumptions of normality and equal variances are satisfied.
a. . = 10, = 12, and = 0.05.
b. . = 4, = 8, and = 0.01.
c. . = 15, = 15, and = 0.05.
A computer laboratory manager was in charge of purchasing new battery packs for her lab of laptop computers. She narrowed her choices to two models that were available for her machines. Since the models cost about the same, she was interested in determining whether there was a difference in the average time the battery packs would function before needing to be recharged. She took two independent random samples and computed the following summary information:
Set up the rejection regions for the following testing conditions. Assume the assumptions of normality and equal variances are satisfied.
a.
. = 10, = 12, and = 0.05. b.
. = 4, = 8, and = 0.01. c.
. = 15, = 15, and = 0.05. Unlock Deck
Unlock for access to all 124 flashcards in this deck.
Unlock Deck
k this deck
66
Assume that the population distributions of times (in minutes) for two different skiers to race the same course are normal with equal variances. Two random samples, drawn independently from the populations, showed the following statistics: = 4, = 7.52, = 0.25; = 5, = 8.37, and = 0.09. Construct and interpret a 95% confidence interval for the true difference in average time of skiers to race the same course.
= 4, = 7.52, = 0.25; = 5, = 8.37, and = 0.09. Construct and interpret a 95% confidence interval for the true difference in average time of skiers to race the same course. Unlock Deck
Unlock for access to all 124 flashcards in this deck.
Unlock Deck
k this deck
67
Studying Time Narrative
A faculty advisor was interested in determining whether there is a difference between male and female students in the amount of time (in hours) spent studying on weeknights (Monday through Thursday). The advisor selected a random sample of 12 female students and a second random, but independent, sample of 10 male students and asked each student to indicate the average amount of time spent studying on a weeknight. The following summary statistics are obtained.
Refer to Studying Time Narrative. Develop a 95% confidence interval for the average amount of time spent studying on weeknights by females.
Unlock Deck
Unlock for access to all 124 flashcards in this deck.
Unlock Deck
k this deck
68
Assume that the population distributions of times (in hours) of two different surgeries are normal with equal variances. Two random samples, drawn independently from the populations, showed the following statistics. = 10, = 2.5, = 0.04 = 11, = 2.6, = 0.09
Construct and interpret a 90% confidence interval for the true difference in mean amount of time of the two surgeries.
= 10, = 2.5, = 0.04 = 11, = 2.6, = 0.09Construct and interpret a 90% confidence interval for the true difference in mean amount of time of the two surgeries.
Unlock Deck
Unlock for access to all 124 flashcards in this deck.
Unlock Deck
k this deck
69
Studying Time Narrative
A faculty advisor was interested in determining whether there is a difference between male and female students in the amount of time (in hours) spent studying on weeknights (Monday through Thursday). The advisor selected a random sample of 12 female students and a second random, but independent, sample of 10 male students and asked each student to indicate the average amount of time spent studying on a weeknight. The following summary statistics are obtained.
-Refer to Studying Time Narrative. Using the p-value approach and = 0.10, what conclusion can be drawn about the difference between male and female students in average time spent studying on weeknights?
Unlock Deck
Unlock for access to all 124 flashcards in this deck.
Unlock Deck
k this deck
70
Average Telephone Time on Hold Narrative
A customer service representative was interested in comparing the average time (in minutes) customers are placed on hold when calling Gaz Metropolitain and Hydro-Quebec, both in Quebec. The representative obtained two independent random samples and calculated the following summary information: Assume the distributions of time a customer is on hold are approximately normal.
Refer to Average Telephone Time on Hold Narrative. What is the appropriate conclusion? Justify your answer.
A customer service representative was interested in comparing the average time (in minutes) customers are placed on hold when calling Gaz Metropolitain and Hydro-Quebec, both in Quebec. The representative obtained two independent random samples and calculated the following summary information:
Assume the distributions of time a customer is on hold are approximately normal.Refer to Average Telephone Time on Hold Narrative. What is the appropriate conclusion? Justify your answer.
Unlock Deck
Unlock for access to all 124 flashcards in this deck.
Unlock Deck
k this deck
71
Studying Time Narrative
A faculty advisor was interested in determining whether there is a difference between male and female students in the amount of time (in hours) spent studying on weeknights (Monday through Thursday). The advisor selected a random sample of 12 female students and a second random, but independent, sample of 10 male students and asked each student to indicate the average amount of time spent studying on a weeknight. The following summary statistics are obtained.
Refer to Studying Time Narrative. Approximate the p-value for the test in the above question.
Unlock Deck
Unlock for access to all 124 flashcards in this deck.
Unlock Deck
k this deck
72
Studying Time Narrative
A faculty advisor was interested in determining whether there is a difference between male and female students in the amount of time (in hours) spent studying on weeknights (Monday through Thursday). The advisor selected a random sample of 12 female students and a second random, but independent, sample of 10 male students and asked each student to indicate the average amount of time spent studying on a weeknight. The following summary statistics are obtained.
Refer to Studying Time Narrative. State the null and alternative hypotheses for the advisor.
Unlock Deck
Unlock for access to all 124 flashcards in this deck.
Unlock Deck
k this deck
73
Average Telephone Time on Hold Narrative
A customer service representative was interested in comparing the average time (in minutes) customers are placed on hold when calling Gaz Metropolitain and Hydro-Quebec, both in Quebec. The representative obtained two independent random samples and calculated the following summary information: Assume the distributions of time a customer is on hold are approximately normal.
Refer to Average Telephone Time on Hold Narrative. Set up the appropriate rejection region for the hypotheses above, assuming = 0.10.
A customer service representative was interested in comparing the average time (in minutes) customers are placed on hold when calling Gaz Metropolitain and Hydro-Quebec, both in Quebec. The representative obtained two independent random samples and calculated the following summary information:
Assume the distributions of time a customer is on hold are approximately normal.Refer to Average Telephone Time on Hold Narrative. Set up the appropriate rejection region for the hypotheses above, assuming
= 0.10. Unlock Deck
Unlock for access to all 124 flashcards in this deck.
Unlock Deck
k this deck
74
Average Telephone Time on Hold Narrative
A customer service representative was interested in comparing the average time (in minutes) customers are placed on hold when calling Gaz Metropolitain and Hydro-Quebec, both in Quebec. The representative obtained two independent random samples and calculated the following summary information: Assume the distributions of time a customer is on hold are approximately normal.
Refer to Average Telephone Time on Hold Narrative. Use = 0.10 to test the hypotheses that the two population variances are equal.
A customer service representative was interested in comparing the average time (in minutes) customers are placed on hold when calling Gaz Metropolitain and Hydro-Quebec, both in Quebec. The representative obtained two independent random samples and calculated the following summary information:
Assume the distributions of time a customer is on hold are approximately normal.Refer to Average Telephone Time on Hold Narrative. Use
= 0.10 to test the hypotheses that the two population variances are equal. Unlock Deck
Unlock for access to all 124 flashcards in this deck.
Unlock Deck
k this deck
75
Average Telephone Time on Hold Narrative
A customer service representative was interested in comparing the average time (in minutes) customers are placed on hold when calling Gaz Metropolitain and Hydro-Quebec, both in Quebec. The representative obtained two independent random samples and calculated the following summary information: Assume the distributions of time a customer is on hold are approximately normal.
Refer to Average Telephone Time on Hold Narrative. Is it reasonable to assume equality of variances in this ? Justify your answer.
A customer service representative was interested in comparing the average time (in minutes) customers are placed on hold when calling Gaz Metropolitain and Hydro-Quebec, both in Quebec. The representative obtained two independent random samples and calculated the following summary information:
Assume the distributions of time a customer is on hold are approximately normal.Refer to Average Telephone Time on Hold Narrative. Is it reasonable to assume equality of variances in this ? Justify your answer.
Unlock Deck
Unlock for access to all 124 flashcards in this deck.
Unlock Deck
k this deck
76
The mean playing times (in hours) for five different co-ed volleyball games for two different teams are listed below. Is there sufficient evidence to conclude the mean playing time for the two teams differ? Justify your answer. Assume the population distributions are normal and . Use a 0.05 significance level.
. Use a 0.05 significance level. Unlock Deck
Unlock for access to all 124 flashcards in this deck.
Unlock Deck
k this deck
77
Studying Time Narrative
A faculty advisor was interested in determining whether there is a difference between male and female students in the amount of time (in hours) spent studying on weeknights (Monday through Thursday). The advisor selected a random sample of 12 female students and a second random, but independent, sample of 10 male students and asked each student to indicate the average amount of time spent studying on a weeknight. The following summary statistics are obtained.
Refer to Studying Time Narrative. Perform the appropriate test of hypothesis to determine whether there is a significant difference between male and female students in average time spent studying on weeknights. Use = 0.05.
A faculty advisor was interested in determining whether there is a difference between male and female students in the amount of time (in hours) spent studying on weeknights (Monday through Thursday). The advisor selected a random sample of 12 female students and a second random, but independent, sample of 10 male students and asked each student to indicate the average amount of time spent studying on a weeknight. The following summary statistics are obtained.
Refer to Studying Time Narrative. Perform the appropriate test of hypothesis to determine whether there is a significant difference between male and female students in average time spent studying on weeknights. Use
= 0.05. Unlock Deck
Unlock for access to all 124 flashcards in this deck.
Unlock Deck
k this deck
78
Average Telephone Time on Hold Narrative
A customer service representative was interested in comparing the average time (in minutes) customers are placed on hold when calling Gaz Metropolitain and Hydro-Quebec, both in Quebec. The representative obtained two independent random samples and calculated the following summary information: Assume the distributions of time a customer is on hold are approximately normal.
Refer to Average Telephone Time on Hold Narrative. Calculate the value of the test statistic.
A customer service representative was interested in comparing the average time (in minutes) customers are placed on hold when calling Gaz Metropolitain and Hydro-Quebec, both in Quebec. The representative obtained two independent random samples and calculated the following summary information:
Assume the distributions of time a customer is on hold are approximately normal.Refer to Average Telephone Time on Hold Narrative. Calculate the value of the test statistic.
Unlock Deck
Unlock for access to all 124 flashcards in this deck.
Unlock Deck
k this deck
79
Assume that the population distributions of life expectancy (in years) of men and women are normal with equal variances. Two random samples, drawn independently from the populations, showed the following statistics.
Men: = 10, = 76, = 1
Women: = 10, = 83, = 4
Construct and interpret a 99% confidence interval for the true difference in average life expectancy of men and women.
Men:
= 10, = 76, = 1Women:
= 10, = 83, = 4Construct and interpret a 99% confidence interval for the true difference in average life expectancy of men and women.
Unlock Deck
Unlock for access to all 124 flashcards in this deck.
Unlock Deck
k this deck
80
A child psychologist was interested in the difference in age (in years) between a boy and girl when they first learn to ride a two-wheeled bicycle. The psychologist developed a 99% confidence interval for the difference in average ages to be (-0.58, 0.73). What conclusion, if any, can be drawn from this interval? Justify your answer.
Unlock Deck
Unlock for access to all 124 flashcards in this deck.
Unlock Deck
k this deck
Unlock Deck
Unlock for access to all 124 flashcards in this deck.


