
Genetics: Analysis and Principles 5th Edition by Robert Brooker
Edition 5ISBN: 978-0073525341Genetics: Analysis and Principles 5th Edition by Robert Brooker
Edition 5ISBN: 978-0073525341 Exercise 48
The data in Figure 2.5 show the results of the F 2 generation for seven of Mendel's crosses. Conduct a chi square analysis to determine if these data are consistent with the law of segregation.FIGURE 2.5 Mendel's analysis of single-factor crosses.
Starting material: Mendel began his experiments with true-breeding strains of pea plants that varied in only one of seven different characters (see Figure 2.4).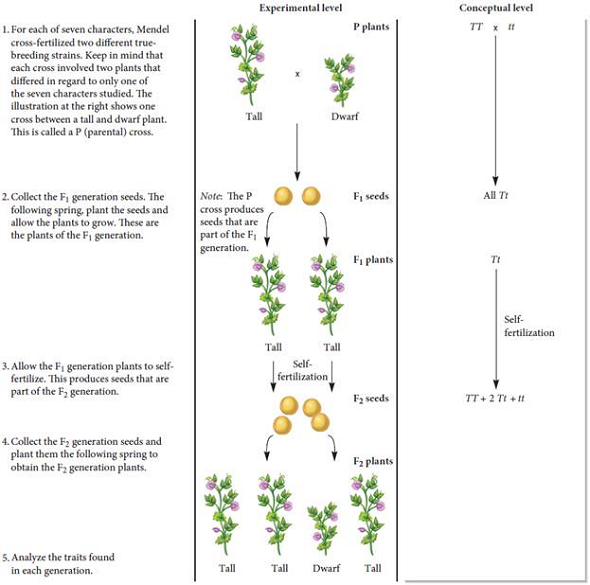
a.
FIGURE 2.4 An illustration of the seven characters that Mendel studied. Each character was found as two variants that were decisively different from each other.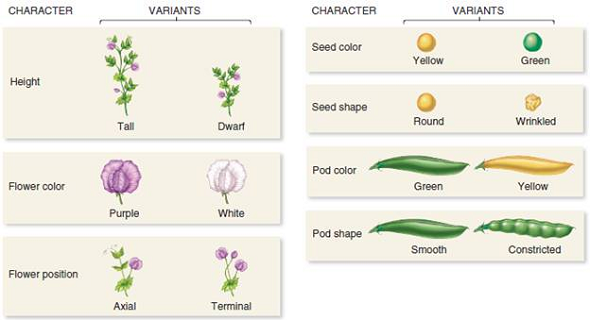
Explanation Verified
Based on Mendel's analysis, we expect ¾ ...
Genetics: Analysis and Principles 5th Edition by Robert Brooker
Why don’t you like this exercise?
Other Minimum 8 character and maximum 255 character
Character 255


