
Essentials of the Living World 5th Edition by George Johnson
Edition 5ISBN: 978-0078096945Essentials of the Living World 5th Edition by George Johnson
Edition 5ISBN: 978-0078096945 Exercise 2
Does the Presence of One Species Limit the Population Size of Others?
Implicit in Darwin's theory of evolution is the idea that species in nature compete for limited resources. Does this really happen? Some of the best evidence of competition between species comes from experimental field studies, studies conducted not in the laboratory but out in natural populations. By setting up experiments in which two species occur either alone or together, scientists can determine whether the presence of one species has a negative impact on the size of the population of the other species. The experiment discussed here concerns a variety of seed-eating rodents that occur in North American deserts. In 1988, researchers set up a series of 50-meter × 50-meter enclosures to investigate the effect of kangaroo rats on smaller seed-eating rodents. Kangaroo rats were removed from half of the enclosures, but not from the other enclosures. The walls of all the enclosures had holes that allowed rodents to come and go, but in plots without kangaroo rats the holes were too small to allow the kangaroo rats to enter.
The graph to the right displays data collected over the course of the next three years as researchers monitored the number of the smaller rodents present in the enclosures. To estimate the population sizes, researchers determined how many small rodents could be captured in a fixed interval. Data were collected for each enclosure immediately after the kangaroo rats were removed in 1988, and at three-month intervals thereafter. The graph presents the relative population size-that is, the total number of captures averaged over the number of enclosures (an average is the numerical mean value, calculated by adding a list of values and then dividing this sum by the number of items in the list. For example, if a total of 30 rats were captured from 3 enclosures, the average would be 10 rats). As you can see, the two kinds of enclosures do not contain the same number of small rodents.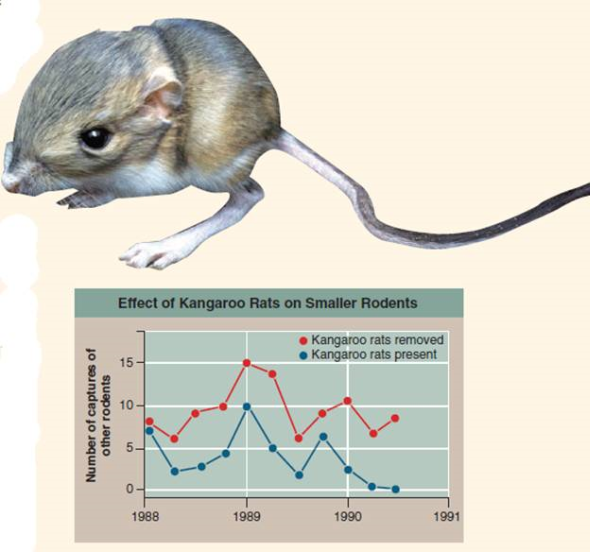
Interpreting Data
a. What is the average number of small rodents in each of the two plots immediately after kangaroo rats were removed? After one year? After two?
b. At what point is the difference between the two kinds of enclosures the greatest?
Explanation Verified
The average number of small rodents in each of these two plots immediately after the kangaroo rats were removed is 9.6 in the plot without kangaroo rats and 5.2 in the plots with kangaroo rats.
After a year the numbers in these two plots, that is, with and without kangaroo rats were, 10 and 6 respectively.
After two years the numbers in these two plots, that is, with and without kangaroo rats were, 8 and 1 respectively.
The difference between the two kinds of enclosures is the greatest at the end of the second year, that is, after1990.
After two years, that is, after 1990, the numbers in these two plots, namely with and without kangaroo rats were, 8 and 1 respectively. This shows the difference distinctly.
Essentials of the Living World 5th Edition by George Johnson
Why don’t you like this exercise?
Other Minimum 8 character and maximum 255 character
Character 255


