
Essentials of the Living World 5th Edition by George Johnson
Edition 5ISBN: 978-0078096945Essentials of the Living World 5th Edition by George Johnson
Edition 5ISBN: 978-0078096945 Exercise 1
Does Natural Selection Act on Enzyme Polymorphism?
The essence of Darwin's theory of evolution is that in nature, selection favors some gene alternatives over others. Many studies of natural selection have focused on genes encoding enzymes because populations in nature tend to possess many alternative alleles of their enzymes (a phenomenon called enzyme polymorphism ). Often investigators have looked to see if weather influences which alleles are more common in natural populations. A particularly nice example of such a study was carried out on a fish, the mummichog ( Fundulus heteroclitus ), which ranges along the East Coast of North America. Researchers studied allele frequencies of the gene encoding the enzyme lactate dehydrogenase, which catalyzes the conversion of pyruvate to lactate. As you learned in chapter 7, this reaction is a key step in energy metabolism, particularly when oxygen is in short supply. There are two common alleles of lactate dehydrogenase in these fish populations, with allele a being a better catalyst at lower temperatures than allele b.
In an experiment, investigators sampled the frequency of allele a in 41 fish populations located over 14 degrees of latitude, from Jacksonville, Florida (31° North) to Bar Harbor, Maine (44° North).
Annual mean water temperatures change 1° C per degree change in latitude. The survey is designed to test a prediction of the hypothesis that natural selection acts on this enzyme polymorphism. If it does, then you would expect that allele a, producing a better "lowtemperature" enzyme, would be more common in the colder waters of the more northern latitudes. The graph on the right presents the results of this survey. The points on the graph are derived from pie chart data such as shown for 20 populations in the map (a pie chart diagram assigns a slice of the pie to each variable; the size of the slice is proportional to the contribution made by that variable to the total). The blue line on the graph is the line that best fits the data (a "best-fit" line, also called a regression line, is determined statistically by a process called regression analysis ).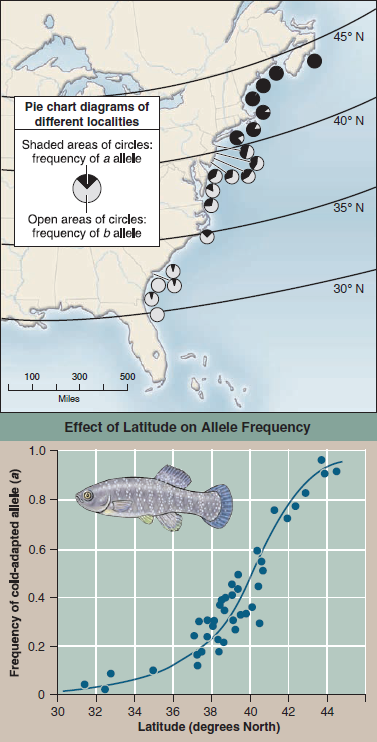
Interpreting Data At what latitude do fish populations exhibit the greatest variability in allele a frequency?
Explanation Verified
An experiment was carried out to know th...
Essentials of the Living World 5th Edition by George Johnson
Why don’t you like this exercise?
Other Minimum 8 character and maximum 255 character
Character 255


