
Essentials of the Living World 5th Edition by George Johnson
Edition 5ISBN: 978-0078096945Essentials of the Living World 5th Edition by George Johnson
Edition 5ISBN: 978-0078096945 Exercise 1
How Real Is Global Warming?
The controversy over global warming has two aspects. The first contentious issue is the claim that global temperatures are rising significantly, a profound change in the earth's atmosphere and oceans referred to as "global warming." The second contentious issue is the assertion that global warming is the consequence of elevated concentrations of carbon dioxide in the atmosphere as a consequence of the widespread burning of fossil fuels.
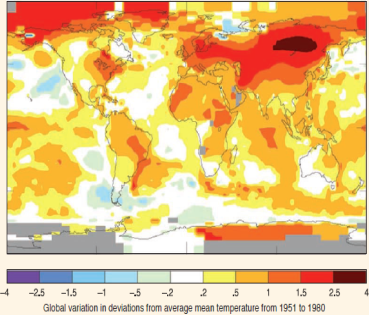
Resolution of the second issue requires detailed science and is only now reaching consensus acceptance. Resolution of the first issue is a simpler proposition, because it is, in essence, a data statement. The graph to the right displays the data in question, global air temperatures for the last century and a half. Temperature data is collected from measuring stations across the globe, as shown in the image below, and averaged. The bars of the histogram represent mean yearly global air temperatures for each year since 1850. To dampen the effects of random year-to-year variations and so better reveal accumulating influences, the data are presented as an anomaly histogram (in an anomaly histogram, each bar presents the deviation of the value during that period from the average value determined for some standard period). In this instance, the anomaly histogram shows the deviation of each year's global mean air temperature from the mean of these values observed over a standard 30-year period between 1961 and 1990.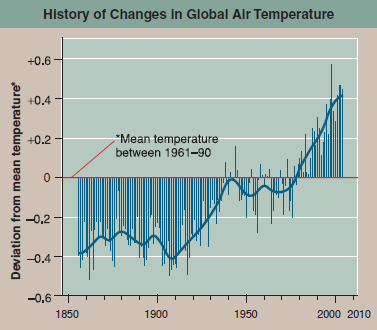
Applying Concepts What fraction of the 155 years do not deviate from the 1961-1990 mean value? What fraction deviates more than +0.2°C? More than ?0.2°C? More than +0.4°C? More than ?0.4°C?
The controversy over global warming has two aspects. The first contentious issue is the claim that global temperatures are rising significantly, a profound change in the earth's atmosphere and oceans referred to as "global warming." The second contentious issue is the assertion that global warming is the consequence of elevated concentrations of carbon dioxide in the atmosphere as a consequence of the widespread burning of fossil fuels.
Resolution of the second issue requires detailed science and is only now reaching consensus acceptance. Resolution of the first issue is a simpler proposition, because it is, in essence, a data statement. The graph to the right displays the data in question, global air temperatures for the last century and a half. Temperature data is collected from measuring stations across the globe, as shown in the image below, and averaged. The bars of the histogram represent mean yearly global air temperatures for each year since 1850. To dampen the effects of random year-to-year variations and so better reveal accumulating influences, the data are presented as an anomaly histogram (in an anomaly histogram, each bar presents the deviation of the value during that period from the average value determined for some standard period). In this instance, the anomaly histogram shows the deviation of each year's global mean air temperature from the mean of these values observed over a standard 30-year period between 1961 and 1990.
Applying Concepts What fraction of the 155 years do not deviate from the 1961-1990 mean value? What fraction deviates more than +0.2°C? More than ?0.2°C? More than +0.4°C? More than ?0.4°C?
Explanation Verified
The anomaly histogram illustrates the de...
Essentials of the Living World 5th Edition by George Johnson
Why don’t you like this exercise?
Other Minimum 8 character and maximum 255 character
Character 255


