Intermediate Microeconomics and Its Application 12th Edition by Walter Nicholson,Christopher Snyder
Edition 12ISBN: 978-1133189022Intermediate Microeconomics and Its Application 12th Edition by Walter Nicholson,Christopher Snyder
Edition 12ISBN: 978-1133189022 Exercise 8
The following data represent 5 points on the supply curve for orange juice: 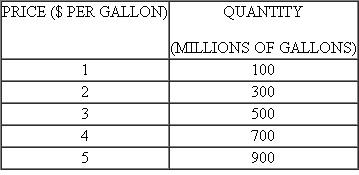 and these data represent 5 points on the demand curve for orange juice:
 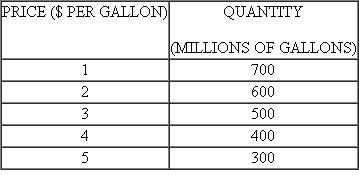 a. Graph the points of these supply and demand curves for orange juice. Be sure to put price on the vertical axis and quantity on the horizontal axis.
b. Do these points seem to lie along two straight lines? If so, figure out the precise algebraic equation of these lines. (Hint: If the points do lie on straight lines, you need only consider two points on each of them to calculate the lines.)c. Use your solutions from part b to calculate the "excess demand" for orange juice if the market price is zero.
d. Use your solutions from part b to calculate the "excess supply" of orange juice if the orange juice price is $6 per gallon.
and these data represent 5 points on the demand curve for orange juice: a. Graph the points of these supply and demand curves for orange juice. Be sure to put price on the vertical axis and quantity on the horizontal axis.b. Do these points seem to lie along two straight lines? If so, figure out the precise algebraic equation of these lines. (Hint: If the points do lie on straight lines, you need only consider two points on each of them to calculate the lines.)c. Use your solutions from part b to calculate the "excess demand" for orange juice if the market price is zero.
d. Use your solutions from part b to calculate the "excess supply" of orange juice if the orange juice price is $6 per gallon.
Explanation Verified
1. Here, as you know that a supply curve...
Intermediate Microeconomics and Its Application 12th Edition by Walter Nicholson,Christopher Snyder
Why don’t you like this exercise?
Other Minimum 8 character and maximum 255 character
Character 255


