
Intermediate Microeconomics and Its Application 12th Edition by Walter Nicholson,Christopher Snyder
Edition 12ISBN: 978-1133189022Intermediate Microeconomics and Its Application 12th Edition by Walter Nicholson,Christopher Snyder
Edition 12ISBN: 978-1133189022 Exercise 27
In Figure, the X-intercept changes from 10 to 5 as the slope ofthegraph changes from -1to -2. Explain:
1. What would happen to the X-intercept in Figure if the slope changed to -5/6?
2. What do you learn by comparing the graphs in Figure to those in Figure?
Figure Change in the Slope of a Linear Function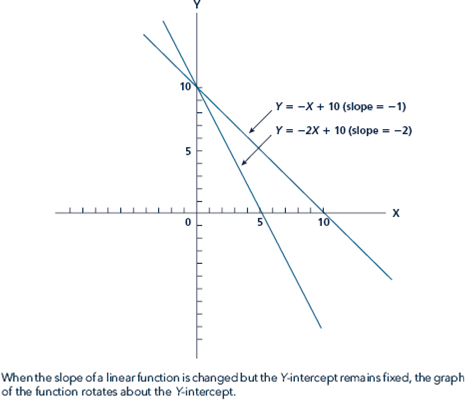
Figure Change in the Y - Intercept of a Linear Function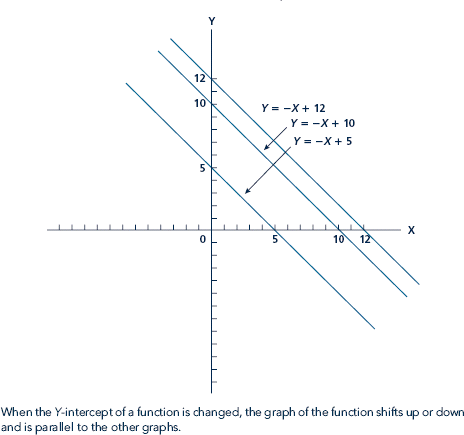
1. What would happen to the X-intercept in Figure if the slope changed to -5/6?
2. What do you learn by comparing the graphs in Figure to those in Figure?
Figure Change in the Slope of a Linear Function
Figure Change in the Y - Intercept of a Linear Function
Explanation Verified
a) The graph below is prepared on the ba...
Intermediate Microeconomics and Its Application 12th Edition by Walter Nicholson,Christopher Snyder
Why don’t you like this exercise?
Other Minimum 8 character and maximum 255 character
Character 255


