
Intermediate Microeconomics and Its Application 12th Edition by Walter Nicholson,Christopher Snyder
Edition 12ISBN: 978-1133189022Intermediate Microeconomics and Its Application 12th Edition by Walter Nicholson,Christopher Snyder
Edition 12ISBN: 978-1133189022 Exercise 2
In the construction of the market demand curve shown in Figure, why is a horizontal line drawn at the prevailing price, P * x ? What does this assume about the price facing each person? How are people assumed to react to this price?
Figure Constructing a Market Demand Curve from Individual Demand Curves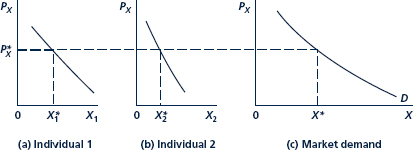
A market demand curve is the horizontal sum of individual demand curves. At each price, the quantity in the market is the sum of the amounts each person demands. For example, at P * X the demand in the market is X * 1 + X * 2 = X *.
Explanation Verified
The graph below shows the individual dem...
Intermediate Microeconomics and Its Application 12th Edition by Walter Nicholson,Christopher Snyder
Why don’t you like this exercise?
Other Minimum 8 character and maximum 255 character
Character 255


