Intermediate Microeconomics and Its Application 12th Edition by Walter Nicholson,Christopher Snyder
Edition 12ISBN: 978-1133189022Intermediate Microeconomics and Its Application 12th Edition by Walter Nicholson,Christopher Snyder
Edition 12ISBN: 978-1133189022 Exercise 2
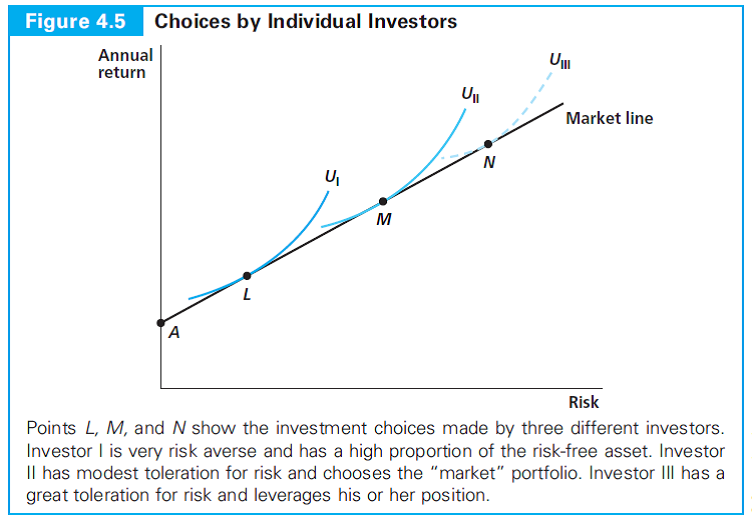
Explain why the slope of the market line in Figures 4.4 and 4.5 shows how risk is "priced" in this market. How might the data in Application 4.4: Puts, Calls, and Black-Scholes be plotted to determine this slope? 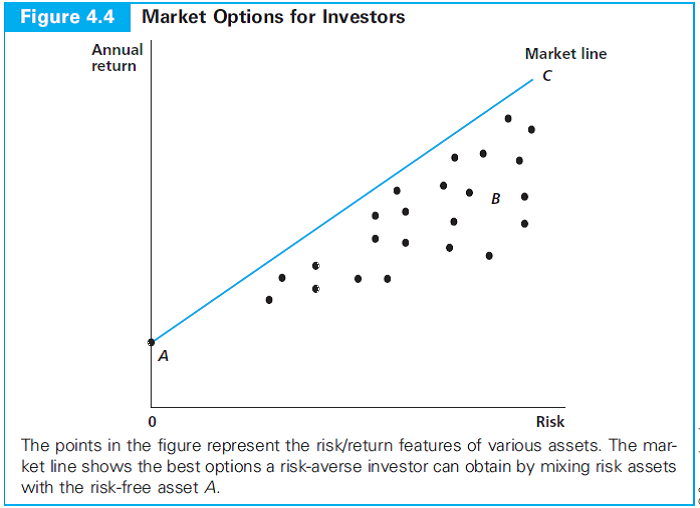
Explanation Verified
The reason why the slope of the market l...
Intermediate Microeconomics and Its Application 12th Edition by Walter Nicholson,Christopher Snyder
Why don’t you like this exercise?
Other Minimum 8 character and maximum 255 character
Character 255


