Intermediate Microeconomics and Its Application 12th Edition by Walter Nicholson,Christopher Snyder
Edition 12ISBN: 978-1133189022
Intermediate Microeconomics and Its Application 12th Edition by Walter Nicholson,Christopher Snyder
Edition 12ISBN: 978-1133189022 Exercise 27
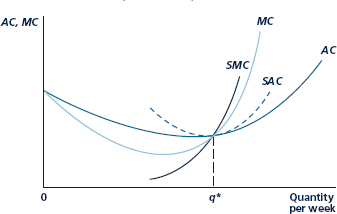
Give an intuitive explanation for the following questions about Figure :
1. Why does SAC exceed AC for every level of output except q*?
2. Why does SMC exceed MC for output levels greater than q*?
3. What would happen to this figure if the firm increased its short-run level of capital beyond K*?
Figure Short-Run and Long-Run Average and Marginal Cost Curves at Optimal Output Level
When long-run average cost is U-shaped and reaches a minimum at q*, SAC and SMC will also pass through this point. For increases in output above q*, short-run costs are higher than long-run costs.
1. Why does SAC exceed AC for every level of output except q*?
2. Why does SMC exceed MC for output levels greater than q*?
3. What would happen to this figure if the firm increased its short-run level of capital beyond K*?
Figure Short-Run and Long-Run Average and Marginal Cost Curves at Optimal Output Level

When long-run average cost is U-shaped and reaches a minimum at q*, SAC and SMC will also pass through this point. For increases in output above q*, short-run costs are higher than long-run costs.
Explanation
1. The SAC exceeds AC for every level of...
Intermediate Microeconomics and Its Application 12th Edition by Walter Nicholson,Christopher Snyder
Why don’t you like this exercise?
Other Minimum 8 character and maximum 255 character
Character 255


