Intermediate Microeconomics and Its Application 12th Edition by Walter Nicholson,Christopher Snyder
Edition 12ISBN: 978-1133189022Intermediate Microeconomics and Its Application 12th Edition by Walter Nicholson,Christopher Snyder
Edition 12ISBN: 978-1133189022 Exercise 8
Leonardo is a mechanically minded person who always builds things to help him understand his courses. To help in his understanding of average and marginal cost curves, he draws a TC-q axis pair on a board and attaches a thin wood pointer by a single nail through the origin. He now claims that he can find the level of output for which average cost is a minimum for any cost curve by the following mechanical process: (1) Draw the total cost curve on his graph; (2) rotate his pointer until it is precisely tangent to the total cost curve he has drawn; and (3) find the quantity that corresponds to this tangency. Leonardo claims that this is the quantity where average cost is minimized. Is he right? For which of the total cost curves in Figure would this procedure work? When would it not work?
Figure Possible Shapes of the Total Cost Curve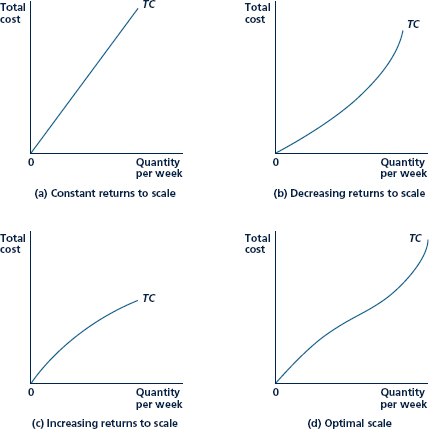
The shape of the total cost curve depends on the nature of the production function. Panela represents constant eturns to scale: As output expands, input costs expand proportionately. Panel b and panel c show decreasing returns to scale and increasing returns to scale, respectively. Panel d represents costs where the firm has an "optimal scale" of operations.
Explanation

This question doesn’t have an expert verified answer yet, let Quizplus AI Copilot help.
Intermediate Microeconomics and Its Application 12th Edition by Walter Nicholson,Christopher Snyder
Why don’t you like this exercise?
Other Minimum 8 character and maximum 255 character
Character 255


