
Intermediate Microeconomics and Its Application 12th Edition by Walter Nicholson,Christopher Snyder
Edition 12ISBN: 978-1133189022Intermediate Microeconomics and Its Application 12th Edition by Walter Nicholson,Christopher Snyder
Edition 12ISBN: 978-1133189022 Exercise 23
Use Equation and Figure to answer the following questions about the relationship between a demand curve and its associated marginal revenue curve.
1. How does the vertical distance between the demand curve and its marginal revenue curve at a given level of output depend on the price elasticity of demand at that output level?
2. Suppose that an increase in demand leads consumers to be willing to pay 10 percent more for a particular level of output. Will the marginal revenue associated with this level of output increase by more or less than 10 percent? Does your answer depend on whether the elasticity of demand changes as a result of the shift?
Equation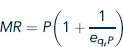
Figure Marginal Revenue Curve Associated with a Demand Curve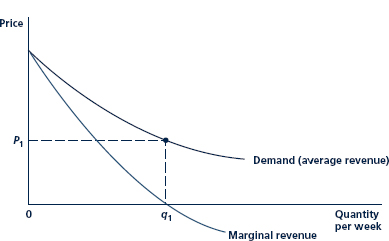
Since the demand curve is negatively sloped, the marginal curve will fall below the demand (''average revenue'') curve. For output levels beyond q 1 , marginal revenue is negative. At q 1 , total revenue (P 1. q 1 ) is a maximum; beyond this point, additional increases in q actually cause total revenues to fall because of the accompanying decline in price.
Explanation Verified
1) Based on the below equation we can ex...
Intermediate Microeconomics and Its Application 12th Edition by Walter Nicholson,Christopher Snyder
Why don’t you like this exercise?
Other Minimum 8 character and maximum 255 character
Character 255


